


1. Introduction
A Bonus–Malus (BM) system is referring to a merit rating system where policyholders get discounts when having no claims and they are punished for making claims. That is to say, the premiums for a policyholder to pay depends very much on his past claim records. This system has now been widely used in many European insurance companies for automobile insurance. However, due to the particular feature of a BM system, one of the biggest issues related to introducing the system is the bonus hunger problem. This means that in order to achieve a premium discount in the following year, the insured may not report some small claims and pay the costs themselves. As a consequence the insurance company is missing some useful information for calculating individual premiums. To our knowledge, this phenomenon is still present in many models used so far in the literature (e.g. Frangos & Vrontos, Reference Frangos and Vrontos2001). In this paper, we introduce a new BM premium model, which we numerically analyse using the same structure as in Frangos & Vrontos (Reference Frangos and Vrontos2001), namely, keeping the total claim size fixed. Under this restriction, our model generates a premium function that reflects a discouragement on the bonus hunger reaction.
The designing of BM systems can date back to the middle of the 20th century, since when only the number of claims reported in the past was considered in the calculation of the future premium a policyholder is to pay. In this case, Picard (Reference Picard1976) claimed that problems might arise if one had a claim worth much more money while the other had lots of small claims. The original objective to develop a fair system is then violated and the sharing of the premiums is not fair among these two policyholders. Thus, introducing the claim severity component is a natural consideration.
Following this thought, Lemaire (Reference Lemaire1995) first applied Picard’s (Reference Picard1976) method to Belgian data that distinguishes between small and large claims. Lemaire (Reference Lemaire1995) found that this classification would lead to serious practical problems, since it is time consuming to assess the exact amount and many policyholders who have claims just over the limit argue a lot. Thus, instead of categorising the claim types, Frangos & Vrontos (Reference Frangos and Vrontos2001) proposed a specific modelling of claim severity. As the claim sizes in motor insurance seem to exhibit long-tails, distributions with this property are thought-out. For instances Valdez & Frees (Reference Valdez and Frees2005) used a distribution called the Burr XII long-tailed distribution to fit the claim sizes data from Singapore Motor Insurance. Another obvious choice to obtain, e.g., Pareto (Frangos and Vrontos, Reference Frangos and Vrontos2001) is mixing the exponential parameter with an Inverse Gamma. In this paper, we will combine the result of mixing distribution presented in Albrecher et al. (Reference Albrecher, Constantinescu and Loisel2011) and the idea of applying the Bayes’ theorem as proposed by Frangos & Vrontos (Reference Frangos and Vrontos2001) for Weibull severities instead of Pareto. We will discuss in detail the motivation and the consequences of choosing a Weibull distribution for the severities.
Our motivation could be interpreted from both academic and practical perspectives. Technically speaking, since Pareto in Frangos & Vrontos (Reference Frangos and Vrontos2001) turned out to fit well on the data, especially in the tails, it is preferable to have some similar-shaped distributions, and Weibull distribution is a reasonable candidate. Even though Weibull distribution does not have tails as long as Pareto, in reality, it can rely on reinsurance that usually alleviates the burden of extremely large claims. Thus, practically speaking, if Weibull distribution fits well the moderate claims of an insurance company, this combined with reinsurance would be the best choice. The additional value of choosing a Weibull fit in some instances is that this could address the bonus hunger problem, as it will be illustrated later in the paper. This is an advantage of such choice, since by carrying out this model, the tendency of policyholders for not reporting small claims could be discouraged.
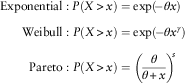
We conclude this paper by fitting an exponential, a Weibull and a Pareto on a given data set. All the upper tails of the three distributions are written as follows with one common parameter  $$\theta $$
:
 $$\eqalignno{ & {\rm Exponential}:P(X\,\gt \,x)=\exp (\!{\minus}\theta x) \cr & \quad \;\;\;{\rm Weibull}:P(X\,\gt \,x)=\exp (\!{\minus}\theta x^{\gamma } ) \cr & \quad \quad \;\,{\rm Pareto}:P(X\,\gt \,x)=\left( {{\theta \over {\theta {\plus}x}}} \right)^{\!\!s} $$
It can be seen that if γ<1, the tail of a Weibull distribution is fatter than that of the Exponential but thinner than that of the Pareto distribution. However, when γ<1, the Weibull tail is lighter than that of the Exponential and a special case appears when γ=1 where the Weibull distribution becomes an Exponential distribution. Thus, we aim to find a Weibull distribution with its shape parameter less than 1 so that a longer-tail property can be retained. Fortunately enough, we have found that the heterogeneity of the claim severity could be described by a Lévy (1/2 stable) distribution. Consequently, when the mixing of this distribution is carried out on an Exponential distribution, a Weibull distribution is obtained in the end (Albrecher et al., Reference Albrecher, Constantinescu and Loisel2011). What is more motivating is that the shape parameter γ is known and equal to 1/2, which is less than 1, fitting our aim.
This paper will be presented via the structure described below. Section 2 discusses the procedure of deriving the premiums for our model. The core of this article lies in section 2.2. It involves explanation of how the mixing distribution is achieved as well as the Bayesian approach. The premium formula is obtained in the end with several analysis described in the subsequent subsection. Section 3 is dedicated to applying both our Weibull model and the one using Pareto claim severities on some given data. Discussions on the findings are concluded in section 4.
2. Premium Calculation Based on an Individual Policyholder
2.1. Modelling of the claim frequency
The modelling of the claim counts is as in Frangos & Vrontos (Reference Frangos and Vrontos2001), so that a comparison of the results can be clearer. We give a very brief explanation here, as details are available in Frangos & Vrontos (Reference Frangos and Vrontos2001).
As in Frangos & Vrontos (Reference Frangos and Vrontos2001), mixing the Poisson intensity  $$\Lambda $$
with a Gamma (α,τ) is a Negative Binomial:
 $$P(N=n)=\mathop{\int}\nolimits_0^\infty {{{\rm e}^{{{\minus}\lambda }} \lambda ^{n} } \over {n\,!\,}}{\times}{{\lambda ^{{\alpha {\minus}1}} \tau ^{\alpha } {\rm e}^{{{\minus}\tau \lambda }} } \over {\Gamma (\alpha )}}d\lambda =\left( {\matrix{ {n{\plus}\alpha {\minus}1} \cr n \cr } } \right)\tau ^{\alpha } \left( {{1 \over {1{\plus}\tau }}} \right)^{{\alpha {\plus}n}} $$
Furthermore, by applying the Bayesian approach, the posterior distribution is given by
 $$\mu (\lambda \,\mid\,n_{1} ,n_{2} ,\,\ldots\,,n_{t} )={{(\tau {\plus}t)^{{K{\plus}\alpha }} \lambda ^{{K{\plus}\alpha {\minus}1}} {\rm e}^{{{\minus}(t{\plus}\tau )\lambda }} } \over {\Gamma (\alpha {\plus}K)}}$$
where  $$K=\mathop{\sum}\nolimits_{i=1}^t n_{i} $$
represents the total claim frequency over
 $$t$$
years with
 $$n_{i} $$
denoting the claim numbers in each year, respectively. It is easily seen that this posterior distribution is still a Gamma but with new parameters K+α and t+τ. According to the Bayesian analysis, the posterior mean is the best estimate, which is given as follows:
 $$\lambda _{{t{\plus}1}} (n_{1} ,n_{2} ,\,\ldots\,,n_{t} )={{\alpha {\plus}K} \over {t{\plus}\tau }}$$
This also represents the expected claim frequency for the coming period, as the mean of a Poisson is λ itself.
2.2. Modelling of the claim severity
In this paper, our focus lies in the claim severity distribution. We use the Weibull distribution to model the claim severities whose applications appear not only in reliability engineering and failure analysis, but also in insurance survival analysis and sometimes in reinsurance (Boland, Reference Boland2007), its probability density function (PDF) is
 $$f(x)=c\gamma x^{{\gamma {\minus}1}} \exp ({\minus}cx^{\gamma } ),x\geq 0,c\,\gt \,0,\gamma \,\gt \,0$$
and its cumulative density function (CDF) is
 $$F(x)=1{\minus}\exp ({\minus}cx^{\gamma } ),x\geq 0$$
It was found by Albrecher et al. (Reference Albrecher, Constantinescu and Loisel2011) that a mixing of a Lévy distribution on the exponential distribution would result in a Weibull distribution with its shape parameter known as 1/2. Suppose the exponential distribution is denoted as
 $$f(X=x\mid\theta )=\theta {\rm e}^{{{\minus}\theta x}} $$
with a distribution function (CDF)
 $$F(X\leq x\mid\theta )=1{\minus}{\rm e}^{{{\minus}\theta x}} $$
And the parameter θ is assumed to be Lévy distributed that is also referred to as the stable (1/2) distribution. Then we have a prior distribution described as follows:
 $$\pi (\Theta =\theta )={c \over {2\sqrt {\pi \theta ^{3} } }}\exp \left( {{\minus}{{c^{2} } \over {4\theta }}} \right),\theta \,\gt \,0$$
Hence, we obtained the distribution function as follows (proof in Appendix A):
 $$F(x)=1{\minus}\exp ({\minus}c\sqrt x ),x\geq 0$$
It is the Weibull distribution with shape parameter equal to 1/2.
Furthermore, with similar approach to Frangos & Vrontos (Reference Frangos and Vrontos2001), we need to find the posterior distribution using the Bayes’ theorem. Suppose the insurance company receives a sequence of claim costs  $$\{ x_{1} ,x_{2} ,\,\ldots\,,x_{K} \} $$
from a policyholder with total of K claims over the time horizon considered. If we let
 $$M=\mathop{\sum}\nolimits_{i=1}^K x_{i} \geq 0$$
to describe the total amount of all these claims, the posterior structure function is written in the following form according to Bayes’ theorem.
 $$\pi (\theta \!\mid\!x_{1} ,x_{2} ,\,\ldots\,,x_{K} )={{\left[ {\prod\nolimits_{i=1}^K {f(x_{i} \!\mid\!\theta )} } \right]\pi (\theta )} \over {\mathop{\int}\nolimits_0^\infty \left[ {\prod\nolimits_{i=1}^K {f(x_{i} \!\mid\!\theta )} } \right]\pi (\theta )d\theta }}={{\theta ^{{K{\minus}{2 \over 3}}} \exp \left( {{\minus}\left( {M\theta {\plus}{{c^{2} } \over {4\theta }}} \right)} \right)} \over {\mathop{\int}\nolimits_0^\infty \theta ^{{K{\minus}{2 \over 3}}} \exp \left( {{\minus}\left( {M\theta {\plus}{{c^{2} } \over {4\theta }}} \right)} \right)d\theta }}$$
We know that after the integration, the denominator will become independent from  $$\theta $$
. By omitting all terms that are not related to
 $$\theta $$
, we can obtain the kernel of this distribution.
 $$\quad\quad\ \pi (\theta \!\mid\!x_{1} ,x_{2} ,\,\ldots\,,x_{K} )\propto\theta ^{{K{\minus}{2 \over 3}}} \exp \left( {{\minus}\left( {M\theta {\plus}{{c^{2} } \over {4\theta }}} \right)} \right)$$
 $$\pi (\theta \!\mid\!x_{1} ,x_{2} ,\,\ldots\,,x_{K} )\propto\theta ^{p} \exp \left( {{\minus}\left( {{\theta \over q}{\plus}{r \over \theta }} \right)} \right)$$
where 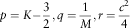 $$p=K{\minus}{3 \over 2},q={1 \over M},r={{c^{2} } \over 4}$$
. This is a form of a Generalised Inverse Gaussian distribution (Tremblay, Reference Tremblay1992). Going back to equation (2), by slightly modifying the variables, it can be rewritten as
 $$\pi (\theta \!\mid\!x_{1} ,x_{2} ,\,\ldots\,,x_{K} )={{\left( {{c \over {2\sqrt M }}} \right)^{{{\minus}\left( {K{\minus}{1 \over 2}} \right)}} \theta ^{{K{\minus}{2 \over 3}}} \exp \left( {{\minus}\left( {M\theta {\plus}{{c^{2} } \over {4\theta }}} \right)} \right)} \over {\mathop{\int}\nolimits_0^\infty \left( {{{2\sqrt M \theta } \over c}} \right)^{{K{\minus}{3 \over 2}}} \exp \left( {{\minus}{{c\sqrt M } \over 2}\left( {{{2\sqrt M \theta } \over c}{\plus}{c \over {2\sqrt M \theta }}} \right)} \right)d\left( {{{2\sqrt M \theta } \over c}} \right)}}$$
The integral on the denominator can be transformed to a modified Bessel function, whose integral representation is normally given as follows (Abramowitz & Stegun, Reference Abramowitz and Stegun1964):
 $$B_{v} (x)=\mathop{\int}\nolimits_0^\infty {\rm e}^{{{\minus}x\cosh t}} \cosh (vt)dt$$
However, we cannot make a direct connection with what we have simply from this expression.
Proposition. An alternative integral representation of the modified Bessel function is given as follows
 $$B_{v} (x)={1 \over 2}\mathop{\int}\nolimits_0^\infty \exp \left( {{\minus}{1 \over 2}x\left( {y{\plus}{1 \over y}} \right)} \right)y^{{v{\minus}1}} dy,x\,\gt\, 0$$
Proof of Appendix B.□
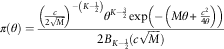
As compared to the integral in equation (3), it is not difficult to rewrite the posterior distribution in the form below:
 $$\pi (\theta )={{\left( {{c \over {2\sqrt M }}} \right)^{{{\minus}\left( {K{\minus}{1 \over 2}} \right)}} \theta ^{{K{\minus}{3 \over 2}}} \exp \left( {{\minus}\left( {M\theta {\plus}{{c^{2} } \over {4\theta }}} \right)} \right)} \over {2B_{{K{\minus}{1 \over 2}}} (c\sqrt M )}}$$
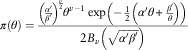
Or alternatively as
 $$\pi (\theta )={{\left( {{{\alpha '} \over {\beta '}}} \right)^{{{v \over 2}}} \theta ^{{v{\minus}1}} \exp \left( {{\minus}{1 \over 2}\left( {\alpha '\theta {\plus}{{\beta '} \over \theta }} \right)} \right)} \over {2B_{v} \left( {\sqrt {\alpha '\beta '} } \right)}}$$
where  $$\alpha '=2M,\beta '={{c^{2} } \over 2},v=K{\minus}{1 \over 2}$$
. From the properties of a Generalised Inverse Gaussian distribution, the expectation is shown below (Embrechts, Reference Embrechts1983):
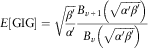 $$E[{\rm GIG}]=\sqrt {{{\beta '} \over {\alpha '}}} {{B_{{v{\plus}1}} \left( {\sqrt {\alpha '\beta '} } \right)} \over {B_{v} \left( {\sqrt {\alpha '\beta '} } \right)}}$$
Since our model distribution was assumed to be exponential whose conditional mean is given by  $$E(X\!\mid\!\theta )={1 \over \theta }$$
. By integrating
 $${1 \over \theta }$$
with respect to the posterior distribution
 $$\pi (\theta )$$
, one gets
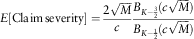 $$E[{\rm Claim}\,{\rm severity}]={{2\sqrt M } \over c}{{B_{{K{\minus}{3 \over 2}}} (c\sqrt M )} \over {B_{{K{\minus}{1 \over 2}}} (c\sqrt M )}}$$
With the claim frequency (equation (1)) considered, this expression contributes to the explicit formula of the estimated net premium for the following period.
 $${\rm Premium}={{\alpha {\plus}K} \over {t{\plus}\tau }}{\times}\left( {{{2\sqrt M } \over c}{{B_{{K{\minus}{3 \over 2}}} (c\sqrt M )} \over {B_{{K{\minus}{1 \over 2}}} (c\sqrt M )}}} \right)$$
Now the problem has reduced to calculate the ratio of the above two Bessel functions. As described by Lemaire (Reference Lemaire1995), two properties of the modified Bessel function could be considered here, i.e., for any  $$x\,\gt \,0,B_{v} (x)$$
satisfies the following two conditions:
 $$B_{{{\minus}v}} (x)=B_{v} (x)$$
 $$\quad \quad \quad \quad \quad B_{{v{\plus}1}} (x)={{2v} \over x}B_{v} (x){\plus}B_{{v{\minus}1}} (x)$$
If we let:
 $${{B_{{v{\minus}1}} (c\sqrt M )} \over {B_{v} (c\sqrt M )}}={{B_{{K{\minus}{3 \over 2}}} (c\sqrt M )} \over {B_{{K{\minus}{1 \over 2}}} (c\sqrt M )}}=Q_{K} (c\sqrt M )$$
then it can be easily seen that Q 1=1 from the first condition. In addition, we can write a recursive function for Q k based on the second condition:
 $${1 \over {Q_{{K{\plus}1}} (c\sqrt M )}}={{2K{\minus}1} \over {c\sqrt M }}{\plus}Q_{K} (c\sqrt M ),K\geq 1$$
This will finally contribute to the calculation of the premium.
On the other hand, it is not difficult to see that our premium model is not defined when M=0. This denotes the scenario where there are no claims. So at the same time K=0. Hence, we will redefine the premium rates for this case. As we assumed the claim severity is Weibull distributed in a single year for each policyholder, it would be reasonable to assume that our initial premium is equal to the product of the mean claim frequency (Negative Binomial) and severity (Weibull). Therefore, the base premium for any new entrant is set as follows:
 $$P_{0} ={\alpha \over \tau }{\times}{2 \over {c^{2} }}$$
Then after, the premium for the following years if no claims are filed will be given by
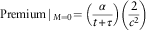 $${\rm Premium}\!\mid\,_{{M=0}} =\left( {{\alpha \over {t{\plus}\tau }}} \right)\left( {{2 \over {c^{2} }}} \right)$$
This means that when there are no claims reported the premium would be discounted with the time a policyholder is within the company.
2.3. Analysis on the premiums
In this subsection, we would like to analyse further on the premium functions from Frangos & Vrontos (Reference Frangos and Vrontos2001) as well as ours. Their premium function is concave. Nevertheless, our model presents a more complex shape, as one can see by analysing the second-order derivatives of the premium functions.
Initially, let us see the premium expression given by Frangos & Vrontos (Reference Frangos and Vrontos2001).
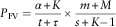 $$P_{{{\rm FV}}} ={{\alpha {\plus}K} \over {t{\plus}\tau }}{\times}{{m{\plus}M} \over {s{\plus}K{\minus}1}}$$
where m>0, s>1 are the parameters in the Pareto distribution originally coming from the Inverse Gamma distribution, and other notations are the same as above. The difference equation with respect to K is obtained as follows:
 $$P_{{{\rm FV}}} (K{\plus}1){\minus}P_{{{\rm FV}}} (K)={{M{\plus}m} \over {t{\plus}\tau }}{\times}{{s{\minus}\alpha {\minus}1} \over {(s{\plus}K{\minus}1)(s{\plus}K)}}$$
Since  $$K\geq 0,s\,\gt \,1$$
, if
 $$s{\minus}\alpha {\minus}1\,\gt\, 0$$
, which is normally the case, we can conclude that the premium is strictly increasing with
 $$K$$
. This will be further illustrated with our numerical example in section 3.
Subsequently, we look at the monotonicity of our Weibull model regarding the variable K when we keep M fixed. By analysing the ratio of two successive K values for the premium function we obtained above, we have
 $${{{\rm Premium}(K{\plus}1)} \over {{\rm Premium}(K)}}={{\alpha {\plus}K{\plus}1} \over {\alpha {\plus}K}}{\times}{{Q_{{K{\plus}1}} (c\sqrt M )} \over {Q_{K} (c\sqrt M )}}$$
Clearly, the left half of the above formula is larger than 1. However, the right half is less than 1, which is explained as follows:
 $${{Q_{{K{\plus}1}} (c\sqrt M )} \over {Q_{K} (c\sqrt M )}}={{B_{{K{\minus}{1 \over 2}}}^{2} (c\sqrt M )} \over {B_{{K{\minus}{3 \over 2}}} (c\sqrt M )B_{{K{\plus}{1 \over 2}}} (c\sqrt M )}}\,\lt\, 1$$
The “<” comes from the Turán-type inequalities whose proof can be found in Ismail & Muldoon (Reference Ismail and Muldoon1978) and Lorch (Reference Lorch1994):
 $$B_{v}^{2} (x)\lt B_{{v{\minus}1}} (x)B_{{v{\plus}1}} (x)$$
Thus, one sees that the monotonicity depends on chosen parameters. This gives evidence that our premium function distinguishes from the Pareto model. In our numerical examples we have identified the specific pattern of our premium.
3. Numerical Illustration
3.1. Data description
In this section, application of the model proposed in section 2 will be illustrated in more details. Initially, a brief description of the data will be given. The data structure is originally obtained from table 2.27 of Klugman et al. (Reference Klugman, Panjer and Willmot1998). But we modified the scale of the data by dividing 5 so that it makes sense in the British environment. By keeping the group structure unchanged, the sample size was also shrunken to 250. The grouped data could be found in Appendix C. However, for some computational reasons, we have randomly generated a data set based on this grouped data. A summary of the data is shown below with its histogram underneath.
As can be seen from this histogram, most of the claims lie below £20,000. The situation where claim severities exceed £45,000 is very rare. In our sample, there are a total of three policyholders claiming more than this amount. We are not concerned much about the tail here, since practically there is settlement for severe claims, through reinsurance, for instance (Table 1).
Description of the data.

3.2. Fitting the distributions
In order to compare with Frangos & Vrontos (Reference Frangos and Vrontos2001), both of the two distributions used to model claim severity will be fitted using our data set. Initially, the Pareto distribution is applied (Figure 1). Our estimates are obtained using R. The results of our maximum likelihood estimation for Pareto distribution is
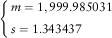 $$\left\{ \matrix{ m=1,999.985031 \hfill \cr s=1.343437 \hfill \cr} \right.$$
And the dot–dashed curve in Figure 2 is the fitted Pareto distribution for the data without the three outliers. On the other hand, the parameter in our Weibull distribution was also estimated through maximum likelihood estimation. (We have a known shape parameter equal to ½.) The estimated scale parameter is equal to 2,227.752. However, in our case, the PDF of the Weibull distribution was written in the form
 $$f(x)={c \over 2}x^{{{\minus}{1 \over 2}}} {\rm e}^{{{\minus}c\sqrt x }} ,x\gt 0$$
Hence, the estimate for our parameter c is obtained by modifying the scale parameter, where  $$c=2,227.752^{{{\minus}{\textstyle{1 \over 2}}}} =0.02118686$$
. The fitted curve is shown by the solid line in the Figure 2.
Histogram of the data.

The fitted curves on the data without the outliers.
There is another fitted curve in this graph, which is drawn by the dashed line, and it is an exponential distribution fitting to the data. The two mixing distributions appear to fit much better than the exponential distribution. On the other hand, in order to see clearly how the curves are fitted to the data, corresponding QQ plots are presented as follows. The tail behaviours of the three distributions can be seen clearly and are consistent with what is discussed section 1.
It is shown on this sketch that the exponential distribution fits the data relatively better up to around £12,500. At the tail where there are extremely large claim sizes, it fails to estimate the probability accurately (Figure 3).
QQ-plot of the exponential distribution versus the sample data.
QQ-plot of the Pareto distribution versus the sample data.
QQ-plot of the Weibull distribution versus the sample data.
Figures 4 demonstrates the goodness-of-fit of the Pareto distribution to our data. Several over-estimations for some small- and medium-sized claims are present. Nevertheless, it fits well especially for very expensive claims. This has emphasised its heavy-tail feature.
It seems that the Weibull distribution fits very well up to £40,000, although there is slight perturbation. In the tail, it fits better than the Exponential distribution but worse than the Pareto distribution, as what is expected (Figure 5).
Overall, the exponential distribution does not perform well compared to the other two. While Weibull fits better for smaller claims, Pareto yields the best performance for very large claim sizes. From these plots, it is likely to suggest a mixture of strategies. When the claim sizes are moderate, the insurer is advised to adopt the Weibull claim severities. Particularly, when reinsurance is in place, Weibull distribution can be the better choice. On the contrary, for very large claim sizes, Pareto distribution plays the key role due to its long-tail property.
3.3. Calculations for net premiums
As mentioned before, the net premiums are calculated via the product of the expected claim frequency and the expected claim severity with independence between the two components assumed. Regarding the claim frequency component, we proceed as Frangos & Vrontos (Reference Frangos and Vrontos2001). Their estimates for the parameters α and τ are
 $$\left\{ \matrix{ \alpha =0.228 \hfill \cr \tau =2.825 \hfill \cr} \right.$$
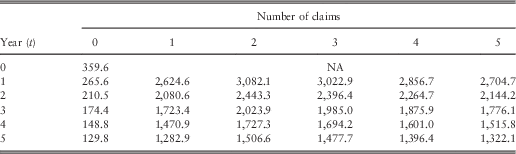
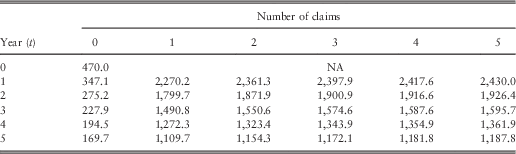
In terms of the claim severity component, our first task is to estimate Q k, as mentioned in the final part of last section. Since we have a recursive function for Q k and its initial value is known as 1, this can be easily calculated. We used MATLAB to generate the solutions for K=1,2,3,4,5 and t=1,2,3,4,5. Tables 2 and 3 underneath demonstrate the resulting premium rates for our Weibull model, and the other two show those for the Pareto model. The first column in each table denotes the scenario where no claims are reported to the company (M=0). While we derive these values from equation (4), Frangos & Vrontos (Reference Frangos and Vrontos2001) used the following formula to calculate the first column premium rates. Notice that tables with different total claim severities have the same first column.
 $$P_{{{\rm FV}}} \!\mid\!(M=0)={\alpha \over {\tau {\plus}t}}{\times}{m \over {s{\minus}1}}$$
Optimal net premiums with Weibull severities and total claim cost (M=7,500).
Optimal net premiums with Weibull severities and total claim cost (M=10,000).
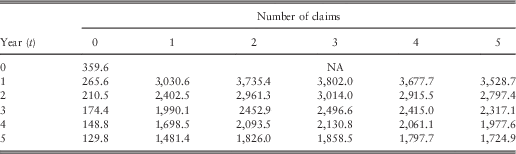
First, let us see our premiums. Table 2 describes the premiums for the situation where the accumulative claim costs are £7,500. Table 3 gives the ones where the total claim amounts are £10,000. Overall, it follows the pattern that the premium decreases over time if claim frequencies are kept constant. How the BM system works will be illustrated in the next example. For instance, if a policyholder has a claim that costs £7,500 in his 1st policy year, his premium will rise to £2,624.6 (Table 2). If in the subsequent year, he has another claim whose severity is £2,500. The total accumulated number of claims is now two and the total size amounts to £10,000 (Table 3). He is then subject to pay £2,9613 in the next year. And if no more claims are filed in the following 3 years, his payment will reduce to £1,826.0 from the beginning of year 6. Now it is essential to see how the BM system using the Pareto model works. Again Tables 4 and 5 represent the total claim cost of £7,500 and £10,000, respectively.
Optimal net premiums with pareto severities and total claim cost (M=7,500).
Optimal net premiums with Pareto severities and total claim cost (M=10,000).
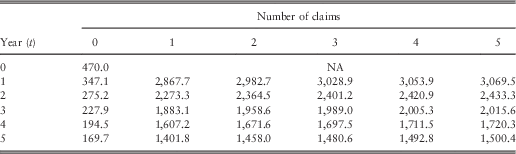
For the same insured person described before, this system will in general punish less severely than the previous one. Specifically, this customer will pay £470 at the start. Owing to one claim reported in the 1st year, his premium is raised to £2,270.2 (Table 4). Then after a second claim in the subsequent year, an increase to £2,364.5 occurs (Table 5). If he has no more claims till the end of the 5th year, his premium payment could go down to £1,458.0. Up to now, the flow of the two systems appears to be similar except that the punishment is less severe in the latter one.
However, for this data set, there is an unexpected finding of our results. Unlike the Pareto fitting (Frangos & Vrontos, Reference Frangos and Vrontos2001), when the total claim size is fixed, our premium is not strictly increasing with the number of claims, but starts to drop slightly for more than two or three claims in our example. The last few columns in Tables 2 and 3 have demonstrated this phenomenon. In order to see how our calculated premiums behave when compared to the Pareto model we have plotted the premiums for large quantities of claims (K=100) when the total claim severity is kept unchanged (Figure 6). Again, two cases where the total cost of claims is £7,500 and £10,000, respectively, are analysed. This irregular behaviour of the severity component of this premium formula may be different depending on the nature of the data set to which the Weibull model is applied because the monotonicity of our premium function is affected by the parameters, as mentioned in section 2.
Behaviours of premium rates with respect to the number of claims when the total claim sizes is £7,500 and £10,000.
As presented in Figure 6, under a fixed total claim cost, our premium function is not strictly increasing with the number of claims. It reaches a peak at some point and then decreases and finally asymptotically converges. To our knowledge so far, this behaviour has not appeared in classical models. However, with this effect, the bonus hunger problems could in some way be alleviated. As seen in our previous tables, if one client has already claimed twice with a total cost slightly less than £7,500 in one particular year. In the system using Pareto claim severities, it is very likely that he will bear the cost himself if he has one more small accident and does not disclose this information to the insurer because of growth in premium payment. However, in our system, there will be a reward if he reveals the true information to the company for a further small claim. It is where the premiums start to decrease. Notice that our premiums only drop a little when the additional claim size is not very large. If one has one more severe claim, he will be paying more than the current amount. Hence, our model is helpful to encourage the insured to be truthful to insurance companies. In this way, it is a flexible decision for the insurer to either fix the premium rates after a certain level of claim frequency or to reward the policyholders for disclosing true information about cheap claims.
On the other hand, this model actually distinguishes the premium payments more according to various claim costs. It punishes more those who make a few large claims than the ones who report many small claims. An extreme example could be seen in Figure 6. When comparing an insured person who makes one claim worth £7,500 and the other who has ten claims summing up to £7,500, which means he has an average of £750 for each claim, we could see that the former one is paying a similar amount to the latter one or even slightly more. Obviously, this is not the case in the Pareto model. This observation implies that our model emphasises more on the claim severity component while the Pareto model addresses more on the frequency level.
It is also noticeable that our initial premium payments are lower than the Pareto model that might be more preferable to starting policyholders thus creating more competitiveness to the insurer. Hence, we proposed a slightly different pricing strategy for insurance companies here. This additional option for insurers leads to a diversity of premium strategies where a suitable one could be chosen from to adapt to certain needs.
4. Discussions and Conclusions
As we have seen from our results, the BM system adopting the Weibull severities provides a lower entrance premium level and punishes more for fewer large-sized claims and less for numerous small claims. This could be considered as one of the options when insurers are deciding on pricing strategies. We would suggest our model to be adopted by those who prefer to offer a mild treatment to policyholders with many small claims, discouraging thus the hunger for bonus phenomenon. We recommend that the insurance company would consider all these factors when choosing among models. Sometimes a mixture of the models would be the most rational choice.
To conclude, this paper extends (Frangos & Vrontos, Reference Frangos and Vrontos2001) by choosing a different severity distribution. We analysed the BM system only considering the a posteriori information. By comparing the two models when applied to the same data set, although we provide worse estimation in the tail, we offer cheaper initial premiums and more reasonable, especially to those who claim many times but with small severities. Furthermore, on this data set our model seems to discourage the hunger for bonus phenomenon, which is empirically significant.
Further extensions are possible if the a priori information is considered. A potentially fruitful direction of research might be the consideration of a BMS that integrates the a priori and a posteriori information on a individual basis based on the framework developed by Dionne & Vanasse (Reference Dionne and Vanasse1989) and Frangos & Vrontos (Reference Frangos and Vrontos2001).
Acknowledgements
The authors would like to acknowledge Nicholas Frangos and Spyros Vrontos for the introduction to the topic, Dominik Kortschak and Bo Li for helpful remarks during the revision of this paper. Moreover, we would like to thank the anonymous reviewer for his/her suggestions, and the idea to consider the generalised BMS that integrates the a priori and a posteriori information on a individual basis. The authors also kindly acknowledge partial support from the RARE-318984 project, a Marie Curie IRSES Fellowship within the 7th European Community Framework Programme. The paper has received the Best Paper Award at the 2013 Perspectives on Actuarial Risks in Talks of Young researchers (PARTY) conference, Ascona, Switzerland, January 27th–February 1st.
Appendix A: Derivation of Weibull distribution
Some techniques were used to calculate the distribution function of the mixing distribution:
 $$F(x)=\mathop{\int}\nolimits_0^\infty (1{\minus}{\rm e}^{{{\minus}\theta x}} ){c \over {2\sqrt {\pi \theta ^{3} } }}\exp \left( {{\minus}{{c^{2} } \over {4\theta }}} \right)d\theta $$
By the change of variables, let
 $$\delta ={c \over {2\sqrt \theta }},\;\theta ={{c^{2} } \over {2\sigma ^{2} }}$$
with  $$\theta \in (0,\infty)$$
,
 $$\infty$$
will decrease from ∞ to 0. Then
 $$d\delta ={\minus}{1 \over 2}{c \over {2\sqrt {\theta ^{3} } }}d\theta $$
and
 $${\minus}2d\delta ={c \over 2}\theta ^{{{\minus}{3 \over 2}}} d\theta $$
. The integral is then modified to the following form:
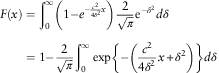 $$\eqalignno{ F(x) & =\mathop{\int}\nolimits_0^\infty \left( {1{\minus}e^{{{\minus}{{c^{2} } \over {4\delta ^{2} }}x}} } \right){2 \over {\sqrt \pi }}{\rm e}^{{{\minus}\delta ^{2} }} d\delta \cr & =1{\minus}{2 \over {\sqrt \pi }}\mathop{\int}\nolimits_0^\infty \exp \left\{ {{\minus}\left( {{{c^{2} } \over {4\delta ^{2} }}x{\plus}\delta ^{2} } \right)} \right\}d\delta $$
The equating of  $$\mathop{\int}\nolimits_0^\infty {2 \over {\sqrt \pi }}{\rm e}^{{{\minus}\delta ^{2} }} d\delta =1$$
comes from the well-known fact that
 $$\mathop{\int}\nolimits_0^\infty {\rm e}^{{{\minus}\delta ^{2} }} d\delta ={{\sqrt \pi } \over 2}$$
. Before continuing the above equation, we let
 $${{c^{2} x} \over 4}=a\geq 0$$
and use the letter I to denote the integral in equation (A.1), then it becomes
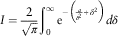 $$I={2 \over {\sqrt \pi }}\mathop{\int}\nolimits_0^\infty {\rm e}^{{{\minus}\left( {{a \over {\delta ^{2} }}{\plus}\delta ^{2} } \right)}} d\delta $$
On the other hand, if we look at the integral:
 $$I_{0} =\mathop{\int}\nolimits_0^\infty {\rm e}^{{{\minus}\left( {\delta {\minus}{{\sqrt a } \over \delta }} \right)^{2} }} d\left( {\delta {\minus}{{\sqrt a } \over \delta }} \right)=\mathop{\int}\nolimits_0^\infty {\rm e}^{{{\minus}\left( {\delta {\minus}{{\sqrt a } \over \delta }} \right)^{2} }} d\delta {\plus}\mathop{\int}\nolimits_0^\infty {\rm e}^{{{\minus}\left( {\delta {\minus}{{\sqrt a } \over \delta }} \right)^{2} }} {{\sqrt a } \over {\delta ^{2} }}d\delta $$
Now let  $$\epsilon ={{\sqrt a } \over \delta }$$
, with δ increasing from 0 to infinity. ϵ is decreasing from infinity to 0. And again we have
 $$d\epsilon ={\minus}{{\sqrt a } \over {\delta ^{2} }}d\delta $$
. Hence, the latter term in the above integral is altered. We have:
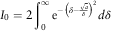 $$I_{0} =2\mathop{\int}\nolimits_0^\infty {\rm e}^{{{\minus}\left( {\delta {\minus}{{\sqrt a } \over \delta }} \right)^{2} }} d\delta $$
On the other hand, if we let
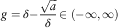 $$g=\delta {\minus}{{\sqrt a } \over \delta }\in ({\minus}\infty,\infty)$$
then
 $${{dg} \over {d\delta }}=1{\plus}{{\sqrt a } \over {\delta ^{2} }}\gt \,0$$
This indicates that g is monotonically increasing from minus infinity to infinity. Thus, the integral I 0 is alternatively written as
 $$I_{0} =\mathop{\int}\nolimits_0^\infty {\rm e}^{{{\minus}\left( {\delta {\minus}{{\sqrt a } \over \delta }} \right)^{2} }} \left( {1{\plus}{{\sqrt a } \over {\delta ^{2} }}} \right)d\delta =\mathop{\int}\nolimits_{{\minus}\infty}^\infty {\rm e}^{{{\minus}g^{2} }} dg=\sqrt \pi $$
Combining the results of equations (A.1) and (A.2), we know that
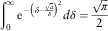 $$\mathop{\int}\nolimits_0^\infty {\rm e}^{{{\minus}\left( {\delta {\minus}{{\sqrt a } \over \delta }} \right)^{2} }} d\delta ={{\sqrt \pi } \over 2}$$
Recall that the integral we would like to solve is actually
 $$I={2 \over {\sqrt \pi }}{\rm e}^{{{\minus}2\sqrt a }} \mathop{\int}\nolimits_0^\infty {\rm e}^{{{\minus}\left( {\delta {\minus}{{\sqrt a } \over \delta }} \right)^{2} }} d\delta ={\rm e}^{{{\minus}2\sqrt a }} =\exp ({\minus}c\sqrt x )$$
Therefore, we have proved that the resulting distribution function is
 $$F(x)=1{\minus}\exp ({\minus}c\sqrt x )$$
□
Appendix B: Proof of the Transformed Integral Representation of the Modified Bessel Function
The form we often see on various mathematical handbooks regarding the modified Bessel function is presented below:
 $$B_{v} (x)=\mathop{\int}\nolimits_0^\infty {\rm e}^{{{\minus}x\cosh t}} \cosh (vt)dt$$
Expanding the cosh terms, we can write,
 $$B_{v} (x)=\mathop{\int}\nolimits_0^\infty \exp \left( {{\minus}{x \over 2}({\rm e}^{t} {\plus}{\rm e}^{{{\minus}t}} )} \right){{{\rm e}^{{vt}} {\plus}{\rm e}^{{{\minus}vt}} } \over 2}dt$$
It can be transformed initially by changing of the variable. We let  $$y={\rm e}^{t} $$
with
 $$t\in (0,\infty),y\in (1,\infty)$$
and
 $$t=lny$$
,
 $$dt={1 \over y}dy$$
. Substituting into the above formula yields
 $$B_{v} (x)={1 \over 2}\mathop{\int}\nolimits_1^\infty \exp \left( {{\minus}{x \over 2}\left( {y{\plus}{1 \over y}} \right)} \right)y^{{v{\minus}1}} dy{\plus}{1 \over 2}\mathop{\int}\nolimits_1^\infty \exp \left( {{\minus}{x \over 2}\left( {y{\plus}{1 \over y}} \right)} \right)y^{{{\minus}(v{\plus}1)}} dy$$
Before continuing, we set  $$z={1 \over y}$$
,
 $$y={1 \over z}$$
with
 $$y\in (1,\infty)$$
,
 $$z\in (0,1)$$
and
 $$dy={\minus}{1 \over {z^{2} }}dz$$
. The second integral is then modified. Notice here the sign of the integral will change due to the alteration of the domain of the variable. It follows that
 $$\eqalignno{B_{v} (x)&={1 \over 2}\mathop{\int}\nolimits_1^\infty \exp \left( {{\minus}{x \over 2}\left( {y{\plus}{1 \over y}} \right)} \right)y^{{v{\minus}1}} dy{\minus}{1 \over 2}\mathop{\int}\nolimits_0^1 \exp \left( {{\minus}{x \over 2}\left( {{1 \over z}{\plus}z} \right)} \right)z^{{v{\plus}1}} \left( {{\minus}{1 \over {z^{2} }}} \right)dz \cr &={1 \over 2}\mathop{\int}\nolimits_0^\infty \exp \left( {{\minus}{x \over 2}\left( {y{\plus}{1 \over y}} \right)} \right)y^{{v{\minus}1}} dy$$
This has completed the proof. □
Appendix C: Grouped Data for Claim Severities



