Introduction
Vineyard management is based on uniform application of irrigated water across an entire vineyard to ensure that each vine receives the same amount of water. In some parts of a vineyard, vines may be over-irrigated, while in other parts, they may suffer from water stress. This occurs due to differences in soil property and topography. When the soil is coarser, water-holding capacity is lower. Therefore, vines located in this type of soil are less vigorous than those in heavier soil, where water-holding capacity is higher. For vineyards with varied topography, yields from higher and lower spots can differ by up to 10-fold (Bramley and Lamb Reference Bramley and Lamb2003).
In light of these factors, certain areas in a field may require tailored irrigation scheduling in order to address uniform vine canopy size. Until now, no commercial drip irrigation system has successfully carried out differential irrigation across an entire vineyard. Several studies aiming to achieve differential irrigation have included sensor-triggered systems in greenhouses (Lichtenberg, Majsztrik, and Saavoss Reference Lichtenberg, Majsztrik and Saavoss2013) and small-scale open field crop systems (Kamel et al., Reference Kamel, El-Shafei, Sharaf and Yousef2012). The most popular study of variable rate irrigation involved center pivot-irrigated crops (Patil and Al-Gaadi Reference Patil and Al-Gaadi2012).
Differential drip irrigation studies based on canopy size, yield map and vine water potential have also been conducted in Australia (McClymont et al., Reference McClymont, Goodwin, Mazza, Baker, Lanyon, Zerihun, Chandra and Downey2012; Proffitt and Pearce Reference Proffitt and Pearce2004) and Spain (Bellvert et al., Reference Bellvert, Marsal, Mata and Girona2012; Martínez, Casasnovas et al., Reference Martínez-Casasnovas, Vallés Bigorda and Ramos2009). In these studies, the vineyard was divided into management zones, and each zone was irrigated according to its needs. In the Australian studies, variability reduction in vegetative growth and yield variability occurred, while in Spain there was no reduction in yield variability. Modifying the number of drippers per vine can result in different amounts of water applied, but it lacks the flexibility to schedule the irrigation differently for each vine, hence, a much sophisticated system needs to be designed. The most advanced system of variable rate irrigation for vineyards was reported by Sanchez et al. (Reference Sanchez, Mendez-Costabel, Sams, Morgan, Dokoozlian, Klein, Hinds, Hamann, Claassen and Lew2014). They reported a decreased variability in both NDVI and yield in a VRI irrigated plot in comparison to a control of one irrigation block.
The aim of this study was to implement a variable irrigation rate in vineyards by applying different amounts of water in different areas across the field in order to reduce the spatial variability in both yield and quality.
Materials and Methods
The research was performed at a central Israeli vineyard (31°52'7.14''N, 35°1'28.38''E) located in a semi-arid climate with annual rainfall of about 500 mm (only winter rain from October to April, no significant rain during the growing season). The Syrah variety was planted in 2006 in a 1.2-hectare plot with row spacing of 3 meters and vine spacing of 1.5 meters. Before installing the VRDI system, the vineyard was irrigated by a single on-surface dripper-line located in the vine row. The dripper’s discharge rate was 1.6 litres/hour with spacing of 0.75 meters between drippers. The vineyard was irrigated once a week, always on the same day, and the average annual amount of irrigation water, until harvest, was about 100 mm. The vineyard’s soil is clay to silty-clay with a high calcium carbonate concentration (56%). It is located on a hillside with a west-east slope across the rows and a wave-like slope along the rows. The soil profile is at least 80 cm deep.
Data collection
Vineyard data were collected before (2014) and after (2016) the VRDI system was installed. Routine measurements were made at six different locations across the plot: in the southern, center and northern areas, in two rows – A (east) and B (west) (Fig. 3). During the growing season, routine measurements of mid-day stem water potential (SWP) (pressure bomb method, ARIMAD 3000S), leaf area index (LAI) (AccuPAR Ceptometer LP-80, Decagon devices) were conducted on five vines at each of the six locations, and normalized difference vegetation index (NDVI) (Landsat, Sentinal 2) imaging was acquired across the entire plot.
At the end of the season, five vines were harvested by hand from each of the six locations. The grapes from each vine were weighed, and the number of clusters was recorded. The harvested grapes were sent to the scientific winery operated by the Samaria and the Jordan Rift Regional R&D Center at Ariel University. The winery prepared wine from each of the six samples, and conducted routine chemical analyses at the various wine-making stages. Approximately one year after the harvest, six Israeli wine specialists carried out wine tasting and ranking of the wines.
System Installation
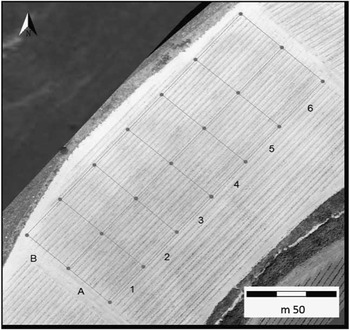
The VRDI system was installed in early 2016. The 1.2-hectare plot was divided into 12 irrigation zones (regardless of spatial variability pattern), each one 33 meters wide (11 rows) and 30 meters long (20 vines) (Figure 1). The 12 zones were divided into two strips, A and B, with six irrigation zones – A1 to A6 and B1 to B6. Each irrigation zone was independently irrigated. Each zone was controlled by an electric valve, and all of the valves were controlled by a main controller. The valves, water meters and controller were installed within a 70 cm x 90 cm x 60 cm (height) box. The box, as well as the sub-mains coming out of it, were buried in the soil so that only its lid could be accessed for maintenance. The irrigation laterals for each row were connected to the sub-mains according to zone number. All of the dripper lines and laterals were placed at a depth of 10 cm to avoid any mechanical damage to the system during the season.
VRDI system layout; 2 strips, 6 zones each (A1-A6; B1-B6); each zone is individually irrigated.

VRDI irrigation scheduling
VRDI irrigation scheduling in 2016 was based on the NDVI value, stress factor and SWP for each zone from the 2014 data collection. The zones that exhibited low vigor in 2014 (A4-A6 and B4-B6) in 2014 were irrigated early in the season (beginning of April) at a higher rate of up to 15 mm per week. The zones that exhibited high vegetation in past years (A1-A3 and B1-B3) were irrigated late in the season (end of May) at a low water rate of 5 mm per week.
Results
The different measurements that were conducted in 2014 in the vineyard had indicated a clear trend along the rows from south to north. The observed trend was a reduction in vine canopy size that was reflected by the measured LAI values. The values of LAI that are shown in Figure. 2 were measured just before the harvest in August 2014, but the same trend was observed throughout the season in the plot.
Leaf area index (LAI) values measured in the 6 locations in the plot at the end of the season, just before the August 2014 harvest. Letters on the bars represent statistical significance.

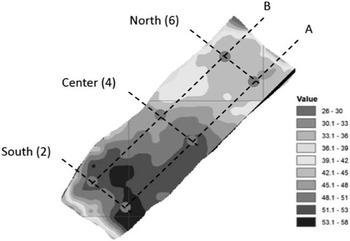
The LAI values were consistent with the NDVI map obtained during the same period in August 2014 (Figure 3). A trend of reduced canopy size along the south-to-north rows can be clearly observed from the map. The map indicates variability intensity across the plot, and shows that the LAI values follow a logical trend rather than a random reading of uniformed zones.
NDVI map obtained in August 2014 just before harvest. The dots are the measurement locations for LAI, SWP and yield. The numbers in brackets are the VRDI zone numbers for comparison and orientation.

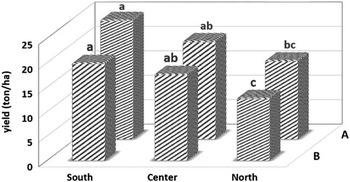
A trend of higher yields in the southern part of the plot and lower yields in the northern part (Figure 4) was identified from the data. The yield for the different locations was in good agreement to the LAI measurements and the NDVI map.
Measured yields at 6 different locations during the 2014 season. Letters on the bars represent statistical significance (means comparison p<0.05).

Based on the 2014 survey, there is a variability pattern. The vines in the southern part of the plot were larger, less stressed and had higher yields. Meanwhile, less than 200 meters north in the same row and with the same irrigation scheduling, the vines were smaller, far more stressed, and had substantially lower yields. The 2014 harvest showed a gap of about 17% between the actual and full yield potential (defined as the high yield at the south part of the field), given the farmer’s quality and yield constraints for that specific field and variety.
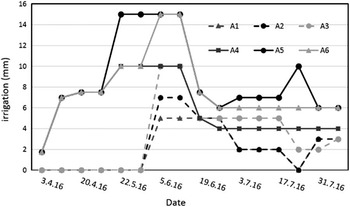
The 2016 irrigation scheduling was based under the assumption that the northern zones of the plot (A4-A6 and B4-B6) had lower vigor in past years due to a lack of available water from winter rains. As such, irrigation was started earlier and with higher volumes of water in the season in these zones. The zones with higher vigor in 2014 (A1-A3 and B1-B3) were irrigated later in the season with lower volumes of water. During mid-season, when the canopy size of the vines in the different zones was similar (60% veraison stage) the volume of irrigated water had become similar for all zones until harvest, with the exception of adjustments according to SWP measurements. Figure 5 shows irrigation scheduling for the A strip (A1-A6) during the 2016 season, while the B strip irrigation underwent similar patterns.
Irrigation scheduling of A1 to A6 zones during the 2016 season.

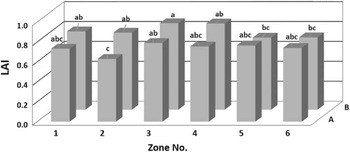
The LAI values measured in August 2016 show some variation. However, these data show that the trend of reduced LAI from south to north observed over the past years was not observed during the 2016 season (Figure 6). Although there is a statistical significant between the different zones, there is more uniformity between the north and south zones in 2016.
LAI values measured across different irrigation zones during August 2016 season. Letters on the bars represent statistical significance.

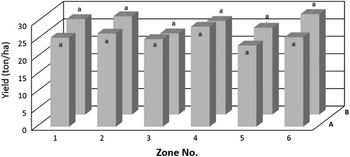
The results of the 2016 harvest indicate that the previous pattern of south-to-north yield reduction (Figure 4) also no longer existed as can be seen in Figure 7. After VRDI irrigation, the plot reached its yield potential throughout all of the zones, while the yield nearly doubled in the northern zones in 2016 compared to 2014. Based on the results of the first year of VRDI system operation, it is estimated that the 2016 season yield increased by about 17% compared to past years due to variable volumes of water applied to each zone.
2016 season yield of grapes by zone as measured by the hand harvest of 5 vines in each zone. Letters on the bars represent statistical significance.

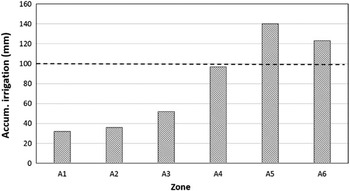
At the end of the 2016 season, the northern irrigation zones had received about 300% more water than the southern irrigation zones. About 20% less water was applied from the beginning of the 2016 season until harvest compared to past years when about 100 mm of water was applied per season. The highest volume of water was applied to zone A5 (140 mm), while the lowest volume (30 mm) was applied to A1 (Figure 8).
Total volume of water applied in zones A1 to A6 during the 2016 season; dashed line represents the average annual volume of water applied in previous years

Summary and Conclusion
Prior to the deployment of VRDI in 2016, each part of the vineyard received the same volume of water regardless of need. With the VRDI system, irrigation – both in terms of time and volume – was changed in each zone. In one instance, one zone received 300% more water than another even though the physical distance between the two was less than 120 meters along the row. Previous patterns of lower canopy size, higher SWP, and lower yield along the plot’s south-to-north rows were likely due to lower water-holding capacity in the northern part of the plot. Therefore, vines in those areas had less available water in the early stages of the growing season, leading to a smaller canopy size and lower yields. The VRDI system enabled refilling of the soil with water in the northern zones early in the season. As such, they experienced similar initial conditions to vines in the southern zones, that is, a full soil profile filled with winter rainwater. Due to the variable allocation of water across the different irrigation zones, total yield increased by 17% and water consumption fell by 20% compared to past years of single-zone irrigation.
In terms of the future, the system needs to be improved in order to be more sensitive to canopy size variations. In addition, it needs to be able to detect SWP variability without requiring ground measurements, with thermal imaging a potentially good option. Eventually, the system will have to work automatically with no farmer involvement.