Introduction
With the decline of various commercial fish stocks and the global rising demand for seafood, cephalopods are emerging as an increasingly important resource for the fishing industry both in volume and value (Caddy and Rodhouse, Reference Caddy and Rodhouse1998; Hunsicker et al., Reference Hunsicker, Essington, Watson and Sumaila2010; Rodhouse et al., Reference Rodhouse, Pierce, Nichols, Sauer, Arkhipkin, Laptikhovsky, Lipiński, Ramos, Gras, Kidokoro, Sadyasu, Pereira, Lefkaditou, Pita, Gasalla, Haimovici, Sakai and Downey2014). While many cephalopod fisheries are regulated across the globe, European waters are somewhat unique with no assessment-based advice on fishing opportunities and no management specified in the Common Fisheries Policy (CFP; Rodhouse et al., Reference Rodhouse, Pierce, Nichols, Sauer, Arkhipkin, Laptikhovsky, Lipiński, Ramos, Gras, Kidokoro, Sadyasu, Pereira, Lefkaditou, Pita, Gasalla, Haimovici, Sakai and Downey2014; Arkhipkin et al., Reference Arkhipkin, Rodhouse, Pierce, Sauer, Sakai, Allcock, Arguelles, Bower, Castillo, Ceriola, Chen, Chen, Diaz-Santana, Downey, González, Granados Amores, Green, Guerra, Hendrickson, Ibáñez, Ito, Jereb, Kato, Katugin, Kawano, Kidokoro, Kulik, Laptikhovsky, Lipinski, Liu, Mariátegui, Marin, Medina, Miki, Miyahara, Moltschaniwskyj, Moustahfid, Nabhitabhata, Nanjo, Nigmatullin, Ohtani, Pecl, Perez, Piatkowski, Saikliang, Salinas-Zavala, Steer, Tian, Ueta, Vijai, Wakabayashi, Yamaguchi, Yamashiro, Yamashita and Zeidberg2015). Consequently, there are no total allowable catch limits for cephalopod catches although some EU countries specify minimum landing sizes (Pierce et al., Reference Pierce, Allcock, Bruno, Bustamante, Gonzalez, Guerra, Jereb, Lefkaditou, Malham, Moreno, Pereira, Piatkowski, Rasero, Sanchez, Santos, Begona, Santurtun, Seixas, Sobrino and Villanueva2010; Jereb et al., Reference Jereb, Allcock, Piatkowski, Hastie and Pierce2015, Barrett et al., Reference Barrett, Bensbai, Broadhurst, Bustamante, Clark, Cooke, Di Cosmo, Drerup, Escolar, Fernández-Álvarez, Ganias, Hall, Hanlon, Hernández-Urcera, Hua, Lacoue-Labarthe, Lewis, Lishchenko, Maselli, Moustafid, Nakajima, O'Brien, Parkhouse, Pengelly, Pierce, Ramírez, Robin, Sajikumar, Smith, Villanueva and Yến2022).
Recently, there has been growing concern regarding the English Channel, where the lack of management could be adversely affecting the populations of cuttlefish and squid, as well as the small-scale fisheries that depend on cuttlefish (Lishchenko et al., Reference Lishchenko, Perales-Raya, Barrett, Oesterwind, Power, Larivain, Laptikhovsky, Karatza, Badouvas, Lishchenko and Pierce2021). The English Channel, an essential fishing area bordered by the United Kingdom to the north and France to the south, is generally shallow, with greater depths in the western part compared to the eastern part (Dauvin, Reference Dauvin2019). This region is crucial for cephalopod fisheries, since 57% of cuttlefish and 36% of squid of the northeast Atlantic catches come from ICES divisions 7.d (Eastern) and 7.e (Western English Channel) (ICES, 2023). Fisheries targeting these two species are primarily from France and the UK, with cuttlefish and squid ranking as the 6th and 7th most valuable fishery resources in the Normandy Region (Ifremer, 2020). However, the sustainable management of these resources faces unique challenges due to their distinctive life histories, including short life spans, variable fecundities and semelparous reproduction, which necessitate innovative stock assessment approaches (Arkhipkin et al., Reference Arkhipkin, Hendrickson, Payá, Pierce, Roa-Ureta, Robin and Winter2021).
Not all European countries collect the same amount of fisheries-related data on cephalopod resources. Even small-scale artisanal fisheries are monitored around the Iberian peninsula (Roa-Ureta et al., Reference Roa-Ureta, Fernández-Rueda, Acuña, Rivera, González-Gil and García-Flórez2021) whereas, until recently, northern countries sometimes consider them just as bait. In such cases, fishermen and authorities have limited motivation to actively monitor or evaluate the stock status. Moreover, a large proportion of these resources are identified to the family level only (Arkhipkin et al., Reference Arkhipkin, Hendrickson, Payá, Pierce, Roa-Ureta, Robin and Winter2021).
In the English Channel, the squid stock complex includes two species (not separated by the fishing industry): Loligo forbesii (Steenstrup, 1856) and Loligo vulgaris (Lamarck, 1798). Both species have an approximately 1-year lifespan (Holme, Reference Holme1974; Guerra and Rocha, Reference Guerra and Rocha1994) and are semelparous. The timing of their life cycle is offset by 3 months, L. forbesii recruitment occurring in June whereas L. vulgaris recruitment happens in September (Royer, Reference Royer, Périès and Robin2002; Laptikhovsky et al., Reference Laptikhovsky, Allcock, Barnwall, Barrett, Cooke, Drerup, Firmin, Lozach, MacLeod and Oesterwind2022). In a simplified version of the Loligo life cycle, the fishing season begins on 1 June of the year and ends on 30 May one year later, corresponding to the beginning of L. forbesii recruitment.
The cuttlefish stock is a single-species stock (Sepia officinalis, Linnaeus, 1758) which in this area has a 2-year lifespan and is also semelparous. Recruitment into the fishery begins in October of the first year, and the annual cohort is fully recruited by the start of the second summer of life (1 year after hatching) (Boucaud-Camou and Boismery, Reference Boucaud-Camou and Boismery1991; Boucaud-Camou et al., Reference Boucaud-Camou, Koueta, Boismery and Medhioub1991; Dunn, Reference Dunn1999). In a simplified version, the cuttlefish fishing season starts on 1 July of year y and ends on 30 June of the following year (Gras et al., Reference Gras, Roel, Coppin, Foucher and Robin2014).
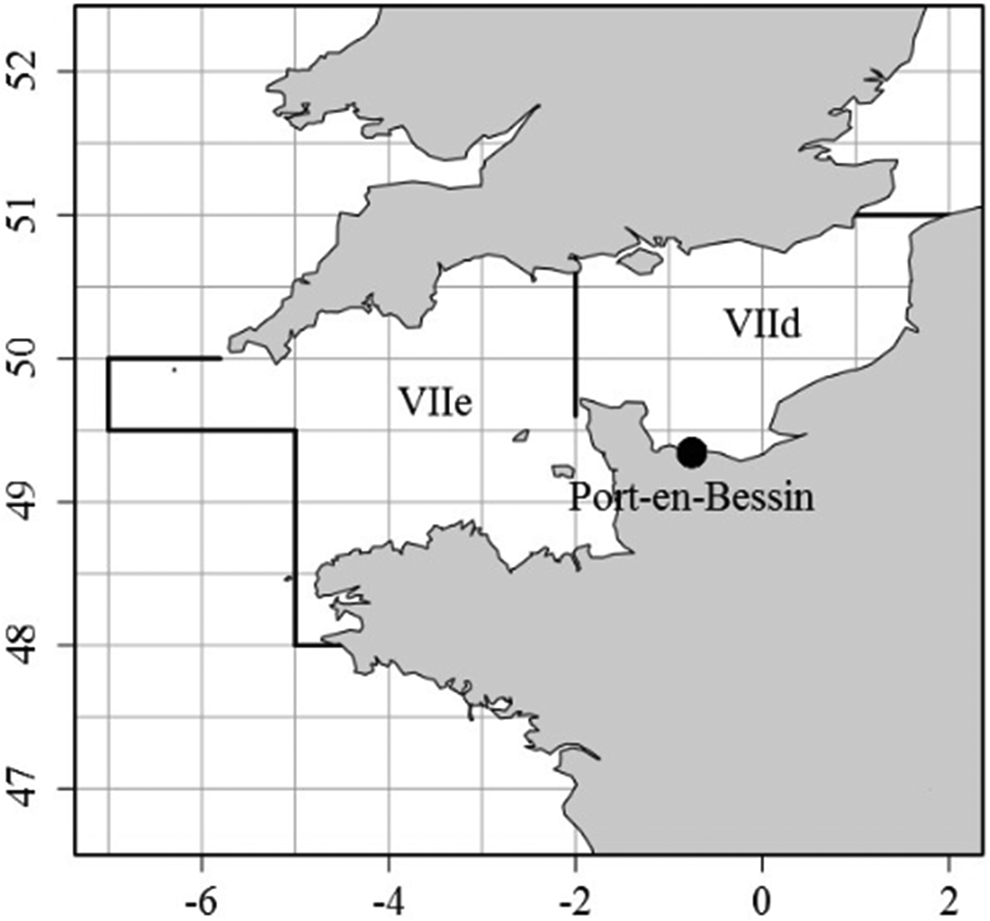
Their short life cycles require a data-intensive approach to monitoring, with high population sampling frequency over brief time frames (Arkhipkin et al., Reference Arkhipkin, Hendrickson, Payá, Pierce, Roa-Ureta, Robin and Winter2021). The University of Caen has conducted monthly cephalopod samplings at Port-en-Bessin (Normandy, Figure 1), the most important port for cephalopod landings in the English Channel. These sampling efforts, raised with commercial fishing data, lay the groundwork for this study, which aims to discern the species composition and size structure of cephalopod landings. Although parts of the time series have already been used in population models (Royer et al., 2002, Reference Royer, Pierce, Foucher and Robin2006) this is the first time an analysis covering three decades of observations is published. The analysis of these datasets will contribute significantly to the understanding of stock structures (in term of species composition and cohort size) and highlight the limits of the application of local observations to the whole English Channel populations. Finally, this study describes the characteristics of a fishery that has enjoyed a fairly constant operating regime throughout this period, when several major changes are now looming, whether due to Brexit and the Fisheries Act, or to the development of offshore renewable energies.
The English Channel with the ICES divisions VIIe and VIId (black lines), the ICES rectangles (grey lines) and the location of Port-en-Bessin's fish market in Normandy, France (black dot).

In this context, the objectives of the present study are manifold: (1) first we explored seasonal and long-term variations of cephalopod landings at Port-en-Bessin fish market; (2) then, we studied the specific composition and size distribution of landed cephalopods; and (3) finally we used commercial fishing data to analyse the geographic origins of landings.
Materials and Methods
Sampling protocols
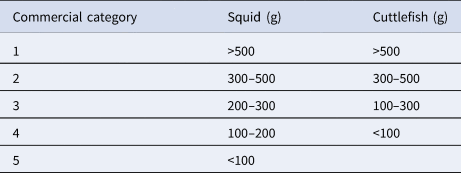
Sampling of cephalopod landings was conducted at the Port-en-Bessin fish market (Calvados, Normandy, France) for squid and cuttlefish since November 1992 and November 1996, respectively. A sampling protocol was developed to estimate the monthly total numbers of squid landed by species and length-class and the monthly total number of cuttlefish S. officinalis landed by length-class. The fish market is organised in such a way that the catch is sorted into commercial categories (weight) immediately after landings (Table 1). This creates a stratification of the landings of squid and cuttlefish boxes. When studying a box of squid, the total weight of the animals studied is recorded, the squid are sorted by species and measured (dorsal mantle length (DML) to the centimetre below).
Weight classes (in grams) for commercial categories for squid and cuttlefish

The EU regulation 2406/96 (of 26 November 1996) describes three standard size categories in cuttlefish (thus category 4 is local and likely below the lower boundary of category 3) but do not state commercial categories in squid (categories presented her are thus defined for France only).
Field operations
On each date, the landings of two vessels were studied and for each vessel two boxes of each category were measured. In order to gain time a subsample of squid from category 4 (7 kg) and category 5 (5 kg) was measured. Similarly for cuttlefish, a subsample of the smallest category, category 4 (4 kg), is measured.
The main feature to identify L. forbesii and L. vulgaris is the relative size of suckers on tentacular clubs (Holme, Reference Holme1974; Jereb and Roper, Reference Jereb and Roper2010). Damaged animals without tentacles were measured and in a first step recorded as ‘undetermined squid’. In a second step, they were allocated to one of the two Loligo species according to the prevalence of squid determined in the same length-class. Squid numbers landed and relative proportions of each species in a box are not affected by this procedure.
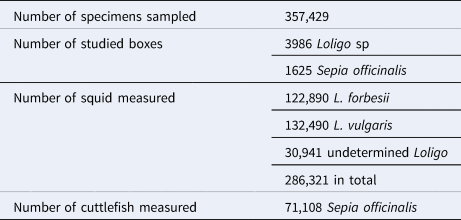
Over the 30 years of biological sampling, only minor changes to the protocol have been applied. Over the period 1992–1995, two samplings per month were done and no data were collected in May when squid landings are at their lowest. Since 1996, the sampling effort was reduced to one sampling operation per month. Not all months could be sampled (341 months sampled instead of 353 months for squid and 298 months sampled instead of 305 months for cuttlefish), and July was often missing. The present study is based on data up to March 2023. In total, 357,429 cephalopod specimens were sampled: 286,321 squid and 71,108 cuttlefish (Table 2; Figure 2).
Sampling effort at Port-en-Bessin fish market (from November 1992 for squid and from November 1996 for cuttlefish to March 2023)

(A) Number of squid specimens sampled at Port-en-Bessin fish market in blue for L. forbesii, orange for L. vulgaris and grey for indetermined Loligo from November 1992 and (B) number of cuttlefish specimens sampled from November 1996 to March 2023 (red bars).

Data base integration and raising computations
Length data from all studied boxes (numbers of individuals per 1 cm DML-class) were stored in a database alongside information about landings (date, vessel) and the total weight of squid and cuttlefish per commercial category landed each month. The average numbers measured per kg observed in the sampled boxes are raised by the total weight landed in the month at the fish market. To estimate the monthly landings numbers-at-length per species, we proceeded with a two-step method. In a first step the numbers-at-length are computed for each category and in a second step they are added together for the k commercial categories.
For each category (c, where c = 1,…,k), in each month (i), for each species (s) and each length class (l), the landings in numbers are represented as:

where landings in category c are:

where Y i,c is the landings in weight in month i and category c and $\bar{R}_{i, s, \;l, \;c}\;$ is the mean number per studied kg in month i, species s, length class l and category c

where j denotes the studied box, ni,c is the number of studied boxes, yi,s,l,c,j is the number measured in size l and xi,c,j is the studied weight in box j
Data analysis
It is important to note that data analysis is carried out by fishing season, which corresponds to the year in which the cohort is recruited, rather than the calendar year. In a simplified version of the life cycle, the fishing season for Loligo species runs from 1 June to 30 May of the following year, and for cuttlefish from 1 July to 30 June. Consequently, fishing season variations were analysed from 2001 to 2021, as data for the 2022 season remained incomplete, extending into mid-2023.
Comparison of landings trends
In a first step, Port-en-Bessin landings were compared to landings data extracted from national databases (‘Système d'Information Halieutique’; SIH). Cephalopod landings (kg) and the associated fishing effort (hours of trawling) were extracted per harbour and per ICES statistical rectangle (boxes of 0.5° latitude and 1° longitude) of the English Channel from 2000 to 2022 for all French bottom otter trawls. Temporal trends were explored at long-term and seasonal scales.
Analysis of Loligo species proportions
In a second step, the prevalence of L. forbesii and L. vulgaris in Port-en-Bessin landings is analysed for interannual and seasonal trends or patterns. Changes from year to year underline the variability of stock composition and resource exploitation whereas seasonal variability is more likely to reflect differences between species in terms of life cycle phenology.
Analysis of length structures
The allocation of S. officinalis individual numbers into their two distinct cohorts (groups 0 and 1) was enabled by the identification of a bimodal pattern within their monthly distribution. Hartigan's dip statistic (HDS) from R package diptest (Maechler, Reference Maechler2015) was used to detect bimodality showing how strongly a distribution deviates from unimodality towards multimodality (Hartigan and Hartigan, Reference Hartigan and Hartigan1985). When HDS test was significant (HDS P value ≤ 0.05), bimodality is confirmed if two and only two obvious peaks are seen in the distribution (Zhang et al., Reference Zhang, Mapes and Soden2003). When bimodality was detected, the antimodes (the trough that separate the two modes of the distribution) were estimated to determine the separation of the monthly distribution into the two distinct cohorts using the R package modes (Deevi, Reference Deevi2016).
In unimodal squid distributions and in each mode of the cuttlefish length structures the monthly mean length were plotted in order to better understand the general patterns and to spot outliers.
Geographic origin of Port-en-Bessin landings
Geographic origin of landings was studied by considering the 7.e and 7.d ICES divisions separately. Logbook data from each fishing operation enabled to track the origin of sampled landings.
Results
Landings and fishing effort at the Port-en-Bessin fish market
Interannual trends in squid and cuttlefish landings at Port-en-Bessin fishing market are showing very similar trends with all French landings trend suggesting that Port-en-Bessin would be a representative harbour for French cephalopod catches (Appendix 1). Fishing effort also showed similar trends between Port-en-Bessin and the national French averages, with a general decline over time. However, an exception was observed for cuttlefish, where fishing effort at Port-en-Bessin has increased since 2010.
Cuttlefish and squid landings at Port-en-Bessin per fishing season showed variability and a general declining trend (Figure 3A, B). From the 1990s to the 2020s, landings at the Port-en-Bessin fish market declined to one-tenth for cuttlefish and to one-quarter for squid.
(A) Sepia officinalis and (B) Loligo landings by fishing season and size category in Port-en-Bessin (fishing seasons from 1993 to 2021 respectively for Loligo and Sepia landings; only complete fishing seasons are considering).

Cuttlefish landings (Figure 3A) have a sharper decline across fishing seasons particularly since 2008. Squid also showed a downward trend, but with some fluctuations (Figure 3B). In 1993's fishing season Loligo sp. landings were the highest with 937 tons and decreased until they reached their lowest values in 2012 (152 tons). From 2012 to 2017, landings increased slightly to 461 tons and then decreased again to 214 tons in 2020. In 2021, a slight increase has been noted with 253 tons landed.
In terms of size distribution, cuttlefish landings are mostly represented by the larger size category (size 1) which declines sharply across fishing seasons. Conversely, squid landings show a more even distribution of size categories throughout fishing seasons, though the larger categories (sizes 1, 2 and 3) collectively decrease over time, without a single size class driving the trend.
Specific composition of cephalopod landings
Long finned squid (mix of the two Loligo species)
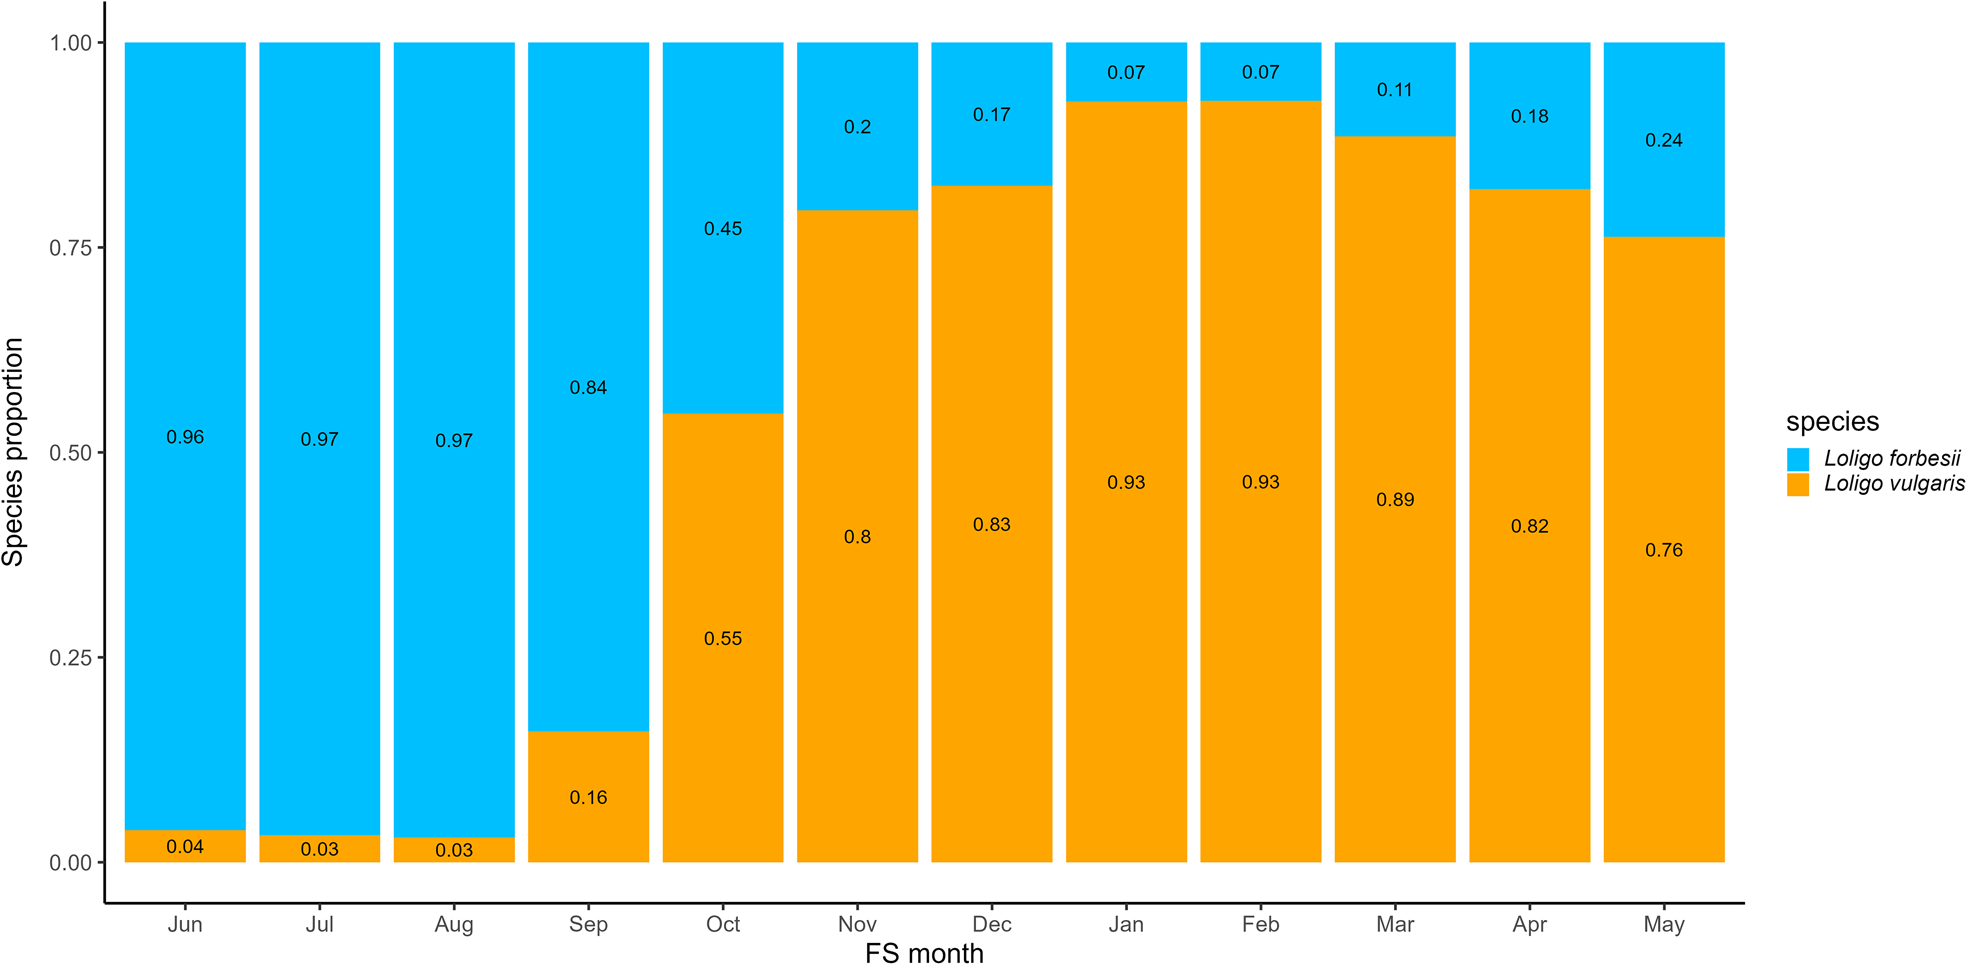
From June to August, landings were almost entirely represented by L. forbesii (proportion greater than 96%, Figure 4). From September onwards, the proportion of L. vulgaris increases from 16% in September, becoming the predominant species in October with 55%, and peaking at 93% in February.
Mean proportion of the two Loligo species (Loligo forbesii and Loligo vulgaris) by month in Port-en-Bessin fishing market (1992–2023).

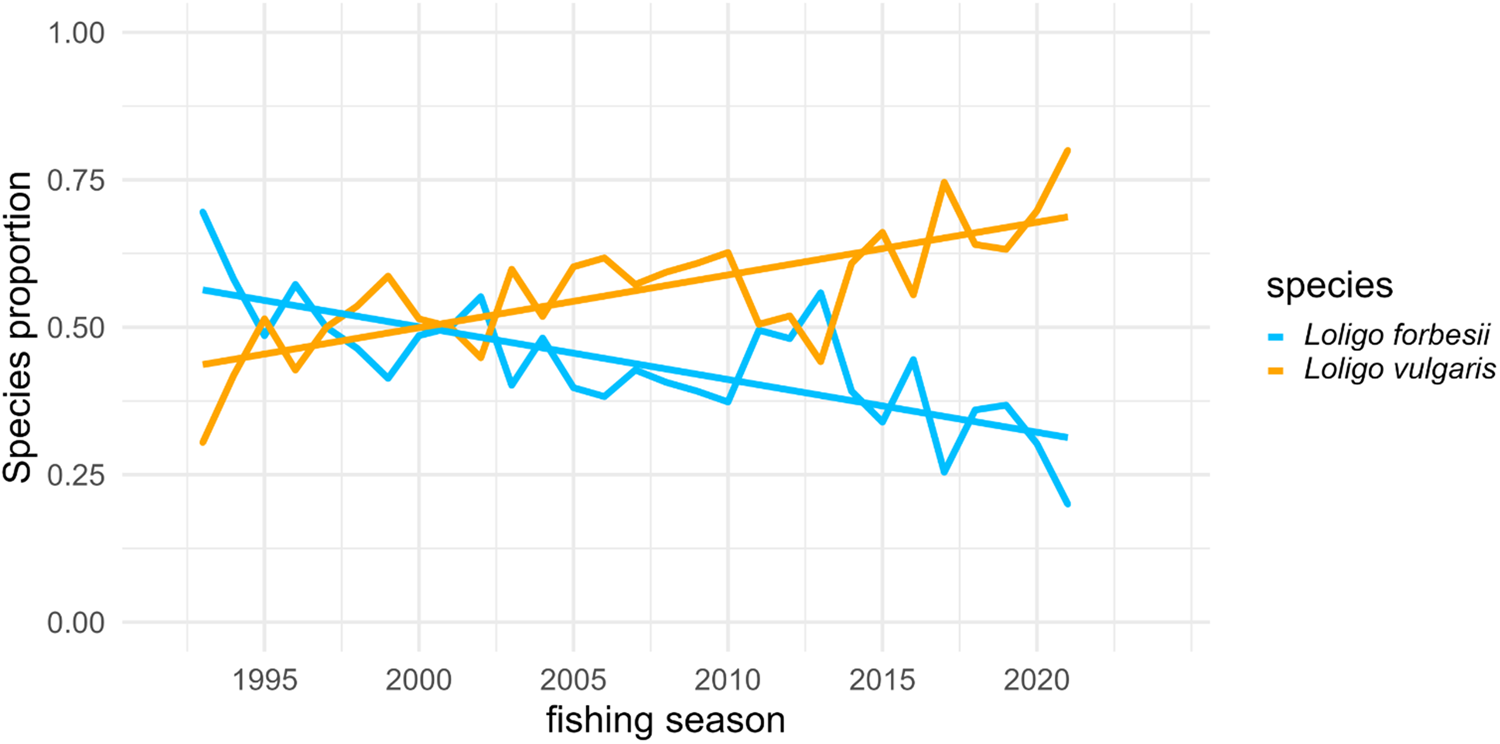
The interannual trend (Figure 5) showed an evident decline in the proportion of L. forbesii contrasting with the general increase of L. vulgaris over time (linear regression P value < 0.001; R 2 = 0.44). At the beginning of the study period (1993), L. forbesii represented around 60% of the Loligo specimens in the catch composition and L. vulgaris around 40%. L. forbesii proportion diminished, falling above 20% by the end of the study period in 2021 fishing season. Conversely, L. vulgaris has increased reaching roughly 80% of the Loligo specimens by 2021. The crossover point observed around the fishing season 2001 indicates the shift in dominance between the two species.
Proportion of the two Loligo species (Loligo forbesii and Loligo vulgaris) by fishing season in Port-en-Bessin fishing market (1993–2021; only complete fishing seasons are considering).

In addition, details of numbers per species and per commercial category are presented in Figure 6. In L. forbesii, the total numbers of individuals showed an overall decline. The categories of small specimens (4 and 5) contributed largely to the variability of the total number of individuals. The categories of large specimens (1–3) showed less variation over time, maintaining a low and relative steady value suggesting consistent capture rate of large and older animals.
Numbers of individuals of the two Loligo species (Loligo forbesii and Loligo vulgaris) by fishing season in Port-en-Bessin fishing market (1993–2021; only complete fishing seasons are considered).

In the case of L. vulgaris, fluctuations in landings in numbers are more pronounced and show a global increase of number of individuals over the years with highest values than in L. forbesii species. The most substantial numbers were recorded in 2008 and 2013 with notably high individual numbers in 2010, 2017 and 2021. The smallest categories (4 and 5) are increasing since 2014 and contribute mostly to the global increase in the total numbers of animals landed.
Seasonal patterns looked different in L. forbesii and L. vulgaris (Figure 7). Numbers of L. forbesii increased at the beginning of the fishing season (June) to August and decreased from September to May. At the beginning of the fishing season, L. forbesii individuals were mostly represented by smallest size categories 4 and 5 and gradually biggest size categories 1, 2 and 3 increased in proportion. July recorded the highest number of individuals in the smallest category (category 5).
Mean estimates of numbers of specimens landed at Port-en-Bessin in the two Loligo species (Loligo forbesii and Loligo vulgaris) by fishing season month and size category (1993–2023 averages).

In L. vulgaris, mean individual numbers showed seasonal variations with an increase from August to November and decreased from December to July. Until October, L. vulgaris individuals are mostly represented by smallest size categories 4 and 5 and gradually larger size categories 1, 2 and 3 increased in proportion. November recorded the highest number of individuals in the smallest category (category 5).
Cuttlefish (S. officinalis)
In S. officinalis (Figure 8), the total number of individuals showed an overall decline from the 1990s to the 2020s. The category of largest specimens (category 1) contributed largely to the variability of the total number of individuals until 2013. After 2013, the contribution of category 1 decreased and became equivalent to the other categories (2 and 3). Categories 2 and 3 showed less variation over time, maintaining a low and relative steady value suggesting consistent capture rate of younger or smaller animals. The smallest category (category 4) shows similar variations to categories 2 and 3 from 1996 to 2003 and become almost zero from 2004 and zero since 2018.
Numbers of individuals of Sepia officinalis by fishing season in Port-en-Bessin fishing market (1996–2021).

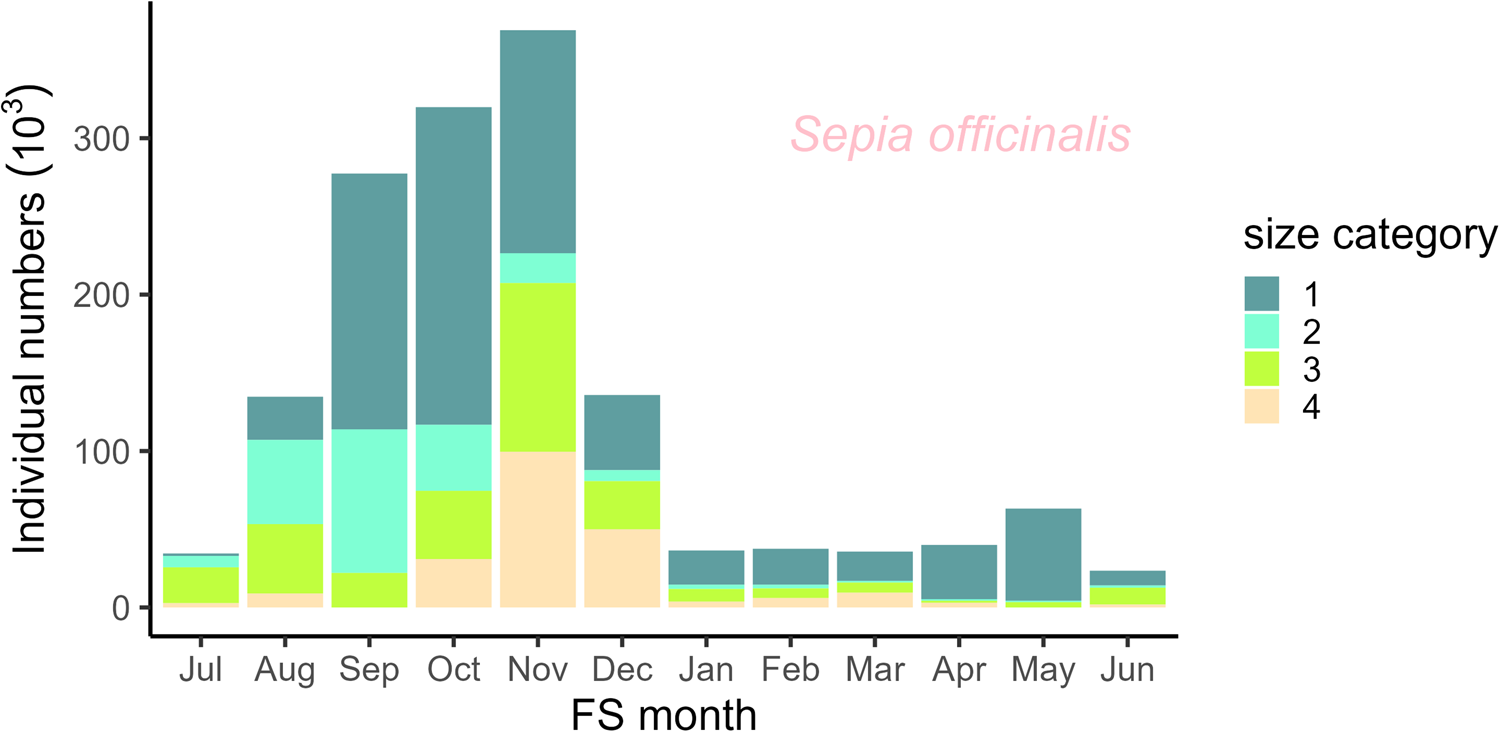
Mean individual numbers of the S. officinalis showed seasonal variations (Figure 9). Numbers increase at the beginning of the fishing season (July) to November and decreased sharply from December to January and remain low until July excepting a little peak in May.
Mean estimates of numbers of Sepia officinalis specimens landed at Port-en-Bessin by fishing season month and size category (1996–2021 averages).

At the beginning of the fishing season, S. officinalis individuals are mostly represented by categories 2 and 3 and gradually the proportion of size category 1, the largest, increases. The highest number of individuals in the smaller categories (categories 4 and 3) are found from October to December, with a maximum of smallest individuals occurring in November. During the spring season (April, May), individuals are mostly represented by the biggest size (category 1) with an increase of smallest individuals (category 3) in June.
Size structure of studied species
Loligo species
At the beginning of the fishing season, L. forbesii mean DML was at its lowest around 14 cm in June (Figure 10A). Mean DML increases gradually until it reaches 28 cm in December. After December, the number of L. forbesii caught significantly decreases, making the size structure data less informative.
Interannual variability in mean size (DML) of Loligo forbesii (A) in blue and Loligo vulgaris (B) in orange landed at Port-en-Bessin each month (boxplot of 1993–2021 averages).

In L. vulgaris (Figure 10B), mean DML is at its lowest around 13 cm in September. Mean DML increases gradually until it reaches 24 cm in April. From May to August, the number of L. vulgaris landed drops significantly, making the size structure data less informative.
Monthly length structure in relative frequency for the two Loligo species was in the Appendix 2A and 2B. No significant changes in mean DML were detected over time for either species.
Sepia officinalis
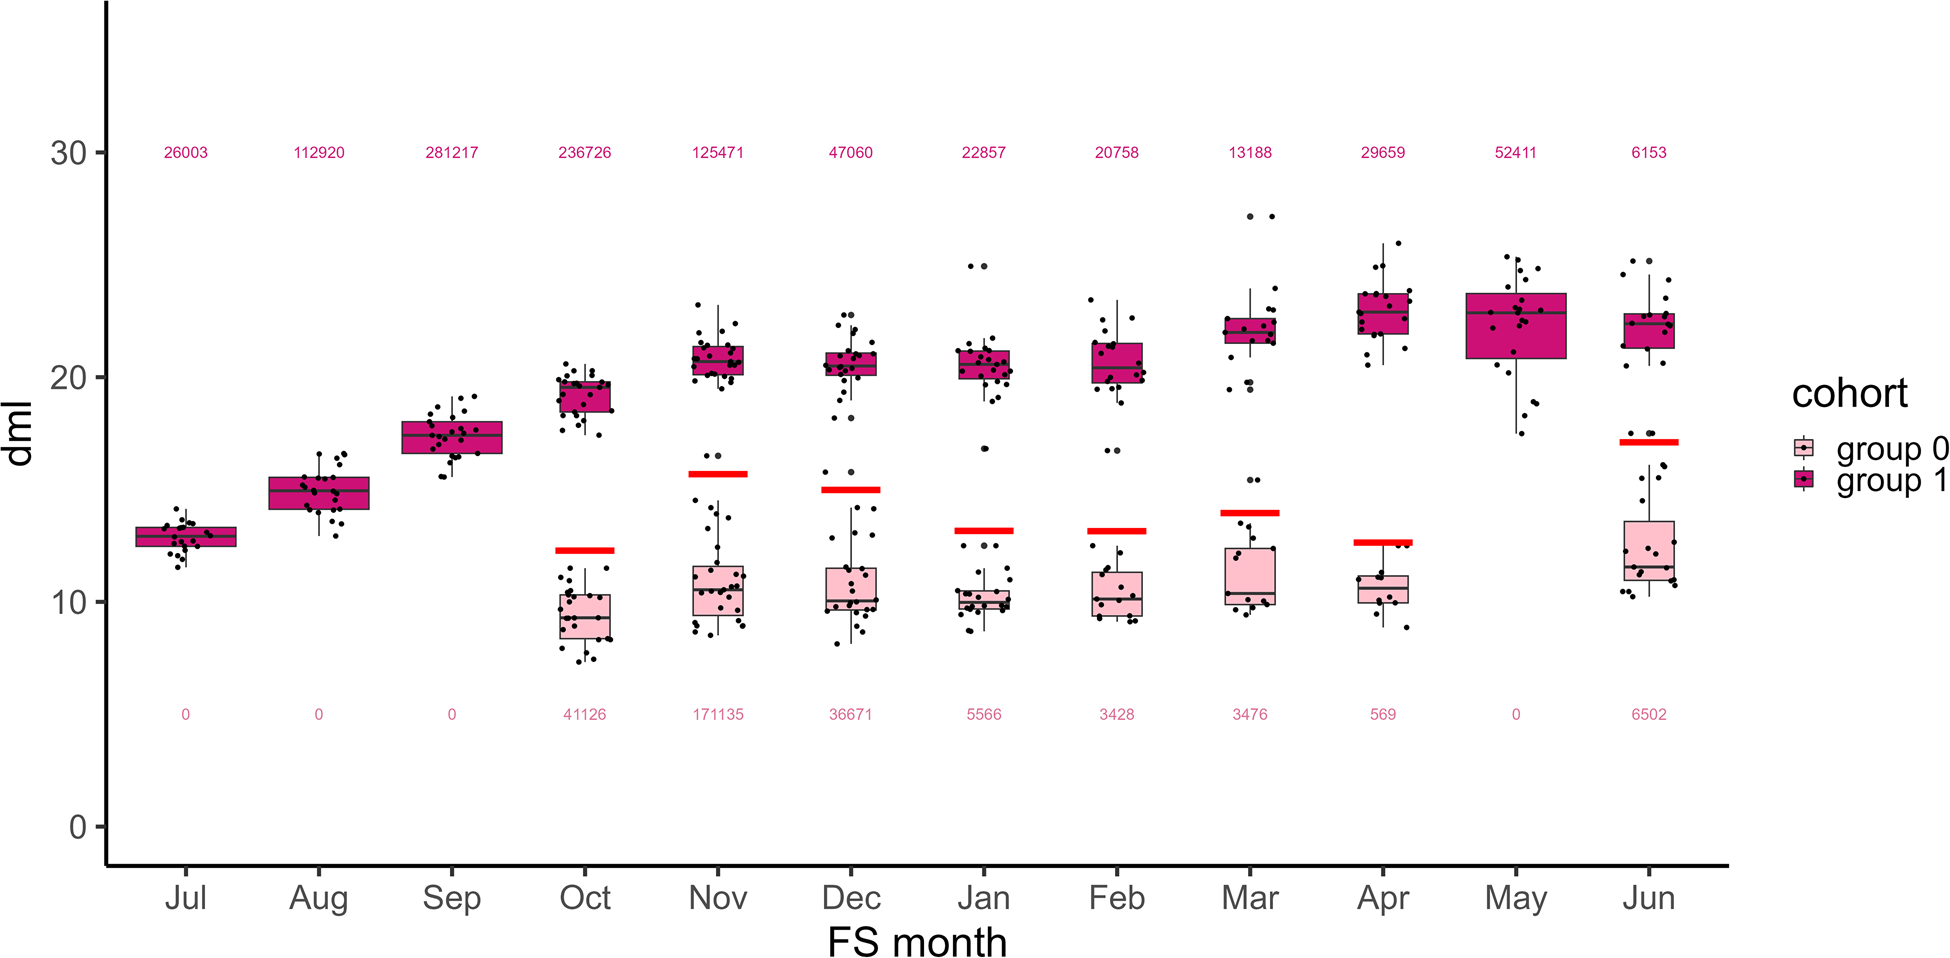
Bimodal size structure of this biannual species has enabled us to study the two cohorts separately using antimode values (Appendix 3). In cuttlefish (Figure 11), the appearance of the new cohort of the year begins in October resulting in the appearance of a bimodal distribution with the smallest individuals around 8 cm. Individuals grow progressively reaching their maximum size (around 22 cm) in April–May of the following year during the breeding season, just before dying. Postspawning mortality explains why there is a unimodal distribution in July–August–September, consisting of animals entering their second year of life when the 2-year-old adults have died and the new cohort has not yet been recruited.
Trends in mean size (DML) and estimates of mean individual numbers of Sepia officinalis landed at Port-en-Bessin by month (1993–2021 cohort averages with group 0, in light pink and group 1, in dark pink). When bimodality was detected in the monthly distribution. Antimodes (in red) were used to split the monthly distribution in two distinct cohorts.

The 1-year cohort is not found in May (Figure 11) because the distribution does not appear to be bimodal (Appendix 2); however, the variance in size of individuals in May is greater than in the other months. This could suggest that the two cohorts are present but not detectable.
Cuttlefish monthly length structures are presented in Appendix 2C (relative frequencies).
There is a significant decline over time in the mean DML (Figure 12A) and in individual numbers (Figure 12B) of the S. officinalis cohort of group 1 (linear regression P value < 0.001; R 2 = 0.56; linear regression P value < 0.05; R 2 = 0.20 respectively). At the beginning of the study period (1996), the mean DML of the group 1 cohort was around 20 cm against 17 cm in the 2022 fishing season. No difference in size and individual numbers was found for the cohort of group 0.
(A) Mean dorsal mantle length and (B) individual numbers of Sepia officinalis for each cohort (group 0, in light pink and group 1, in dark pink) at Port-en-Bessin (1996–2022 fishing season averages).

Geographic origin of landings
In relation to the restructuration of France national data bases (SIH), the analysis was carried out here based on fishery statistics collected for fishing seasons 2001–2021 providing geographic origin of Port-en-Bessin cephalopod landings at the scale of ICES divisions.
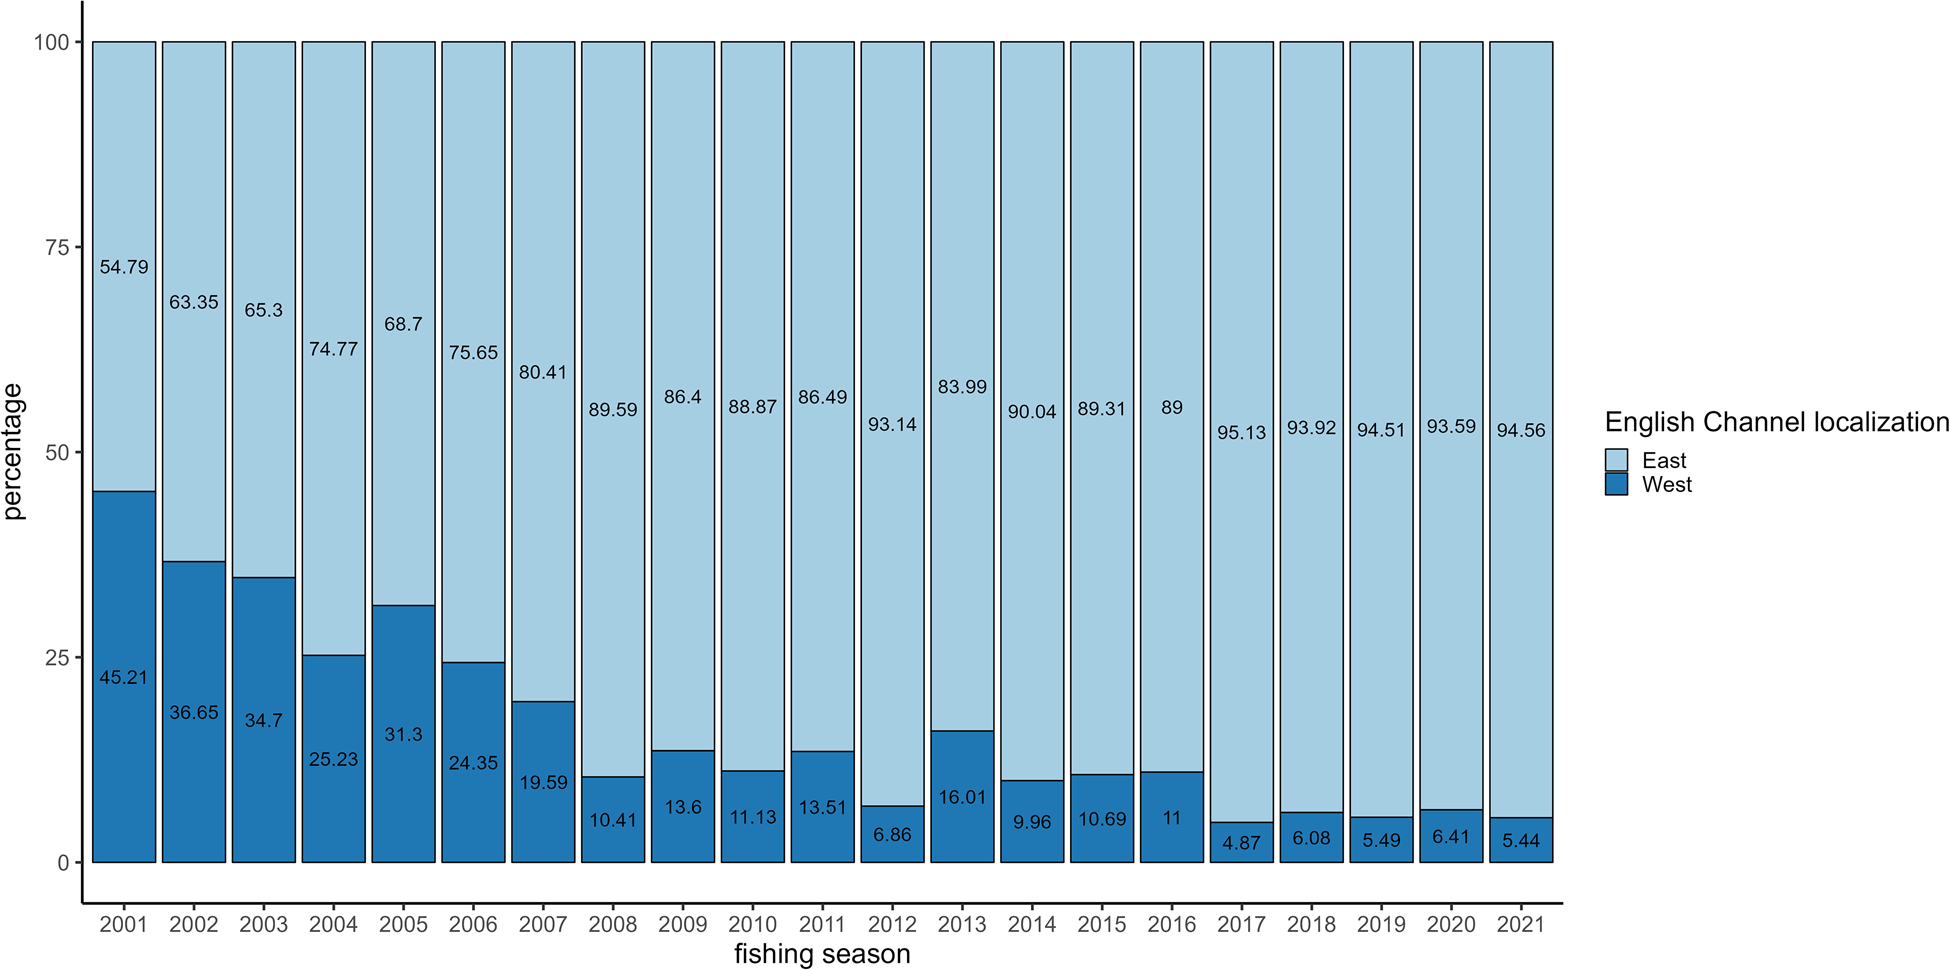
The geographic origin of landings (Figure 13) showed a clear shift in fishing grounds exploited by the Port-en-Bessin fleet. The proportion of squid landings is decreasing in the Western part of the English Channel from 45% during 2001 fishing season to just around 5% in 2021. A similar trend was observed for S. officinalis landings (Appendix 4).
Geographic origin of Port-en-Bessin Loligo landings from 2001 to 2021 (sky blue ‘East’ fishing operations carried out in ICES division 7.d and navy blue ‘West’ in division 7.e).

Discussion
This study is the first complete analysis of the 30-year cephalopod sampling programme conducted at Port-en-Bessin (Normandy, France), with a focus on loliginid squid and cuttlefish stocks. While earlier studies utilized select outputs, such as species proportions (e.g. Royer et al., 2002; Challier et al., Reference Challier, Dunn and Robin2005), this analysis comprehensively addresses the entire dataset, providing a detailed understanding of species composition and size structure over an extended period. It takes into account interannual variations and changes in the activity of the fishing fleet as suggested by Robin and Boucaud (Reference Robin and Boucaud-Camou1993). The short life cycle of studied species requires a data-intensive approach to monitoring, with high population sampling frequency over brief time frames (Arkhipkin et al., Reference Arkhipkin, Hendrickson, Payá, Pierce, Roa-Ureta, Robin and Winter2021). A total of 286,321 squid and 71,208 cuttlefish specimens were sampled at the Port-en-Bessin fish market, starting in November 1992 for squid and in November 1996 for cuttlefish to March 2023.
The determination of cephalopod species in fishery statistics is a recurring request from the ICES Working Group on Cephalopod Fisheries and Life history (WGCEPH) as outlined on Term of Reference E: ‘Recommend tools for identification of cephalopod species and update best practices for data collection’ (ICES, 2020). In France, the sampling of landings in the English Channel was part of the extended data acquisition programme for fisheries (Data Collection Framework) from 2002 to 2008. However, since this period, these species have not been systematically studied in other programmes (like observations on board of commercial vessels ‘Obsmer’ or research trawl surveys) nor with sufficient frequency. Small-scale artisanal fisheries are monitored around the Iberian Peninsula (Roa-Ureta et al., Reference Roa-Ureta, Fernández-Rueda, Acuña, Rivera, González-Gil and García-Flórez2021) but in Northern Europe, the sampling effort deployed in Port-en-Bessin is quite unique.
Port-en-Bessin harbour is crucial in cephalopod fisheries, representing in the English Channel (7D and 7E ICES division) the second place for squid landings and the third place for cuttlefish landings. Landings at this harbour account, respectively, for 13 and 12% of French catches made in the English Channel. Originally designed as a one-off assessment in order to provide species proportions and length data that could be extrapolated to all squid and cuttlefish exploited in the English Channel the sampling programme is now a long-term series of observations useful to describe trends in stocks and in the fisheries. It is worth noting that interannual trends in squid and cuttlefish landings at Port-en-Bessin showed very similar trends with all French landings suggesting that Port-en-Bessin would be a representative harbour for French cephalopod catches.
Like all French landings, there has been a significant decline in Port-en-Bessin fishing market cephalopod landings since the 1990s. Cuttlefish landings were divided by 10 from the 1990s to the 2020s mainly due to the decrease of large size category cuttlefish. In Loligo sp., landings were divided by 4 for the same period with an even decrease of the different size categories. These declining observations coincided with a drop in total landings from the same area suggesting that the status of loliginid and cuttlefish populations in the English Channel may be of concern (ICES, 2023).
The fishing effort associated with cephalopod landings also decreased following trends similar to the landings. This general trend is likely related to decommissioning schemes implemented by France (as described for instance in ‘JORF no 0193 du 19 août 2017’). However, an exception was observed for the fishing effort linked to cuttlefish landings at Port-en-Bessin, which experienced a resurgence. This suggests that Port-en-Bessin trawlers have tended to be more targeting cuttlefish in recent years. The behaviour of demersal trawlers exploiting a group of species is complex (Ulrich et al., Reference Ulrich, Le Gallic, Dunn and Gascuel2002); in the case of Port-en-Bessin trawlers their interest in cuttlefish may have increased as a result of the reduction of pot fishing in the same area (Ifremer, 2024).
Commercial landing data combined with sampling effort allow us to discern length structure of the fished population and total number of cephalopods landed per species.
In S. officinalis, the individual numbers by size category reveal that largest individuals are consistently less prevalent throughout the time series. This led to a situation where, since 2013, the numbers of the largest cuttlefish became comparable to those of the smallest size category, which maintain relatively stable values over time. The bimodal size pattern of this biannual species has facilitated the study of the two cohorts separately, allowing us to revisit the life cycle of cuttlefish as detailed by various authors (Boucaud-Camou and Boismery, Reference Boucaud-Camou and Boismery1991; Boucaud-Camou et al., Reference Boucaud-Camou, Koueta, Boismery and Medhioub1991; Dunn, Reference Dunn1999; Gras et al., Reference Gras, Roel, Coppin, Foucher and Robin2014).
In the English Channel, the cuttlefish undertake well-documented seasonal migrations. During the summer, egg hatch and juveniles grow along the coast. In the autumn, the juveniles migrate to offshore waters and the smallest specimens at approximately 8 cm are observed in October in fishing nets, representing the first year's youngest recruits. Over time, these individuals grow and return to the coast the following spring. This migration cycle repeats during the second year of life reaching their largest size (about 22 cm) in April–May of the following year, corresponding to the breeding season, just before the post-spawning mortality. In May, the 1-year cohort is absent, with most of individuals represented in largest size category (category 1). This is likely because large specimens of 2-years-old arrive first at their breeding location (Guerra and Castro, Reference Guerra and Castro1988; Ezzedine-Najai et al., Reference Ezzedine-Najai, Ros and Guerra1997) in coastal areas targeted by fishermen (Dunn, Reference Dunn1999). In June, smaller individuals (category 3) are observed, suggesting the subsequent arrival of the 1-year-old cohort in coastal areas.
There is an obvious decline over time in the mean DML and in the numbers of individuals of the second cohort. At the beginning of the study period (1996), the mean DML was around 20 cm against 17 cm in 2022. This decrease in size could be attributed to the influence of temperature variations on cephalopod life cycles (Rodhouse et al., Reference Rodhouse, Symon and Hatfield1992; Boyle and Pierce, Reference Boyle and Pierce1994; Waluda and Pierce, Reference Waluda and Pierce1998; Waluda et al., Reference Waluda, Trathan and Rodhouse1999), where an increase in temperature typically results in faster somatic growth and a decrease in final size of the organism (Gi Jeon, Reference Gi Jeon1982; Medhioub, Reference Medhioub1986; Le Goff and Daguzan, Reference Le Goff and Daguzan1991; Jackson, Reference Jackson1997; Forsythe et al., Reference Forsythe, Walsh, Turk and Lee2001; Jackson and Moltschaniwskyj, Reference Jackson and Moltschaniwskyj2002; Forsythe, Reference Forsythe2004; Domingues et al., Reference Domingues, Bettencourt and Guerra2006). This is consistent with the gradual warming of the waters of the Western English Channel (L'Hévéder et al., Reference L'Hévéder, Speich, Ragueneau, Gohin and Bryère2017).
Additionally, the intense fishing pressure observed in the English Channel may be exerting selection on life-history traits, favouring individuals that mature more rapidly at a smaller size or younger age, as has been documented in other heavily exploited species (Rothschild, Reference Rothschild1986; Ottersen et al., Reference Ottersen, Hjermann and Stenseth2006), such as the decline in maturation size observed in cod stocks (Andersen et al., Reference Andersen, Farnsworth, Thygesen and Beyer2007). These findings are consistent with data from the CGFS (Channel Ground Fish Survey) scientific surveys conducted in October in the English Channel between 2000 and 2017, which show a decline in biomass and abundance indices for this species.
No difference in size was observed for the 1-year-old cohort, indicating a stable size among these individuals likely due to an unchanged minimum capture size. Their numbers also remain consistent resulting in consistent catch levels. This stability suggests that juvenile populations are maintained, with recruitment likely influenced more by the survival rates of eggs, paralarvae and juveniles than by the number of spawning adults (Boyle and Rodhouse, Reference Boyle and Rodhouse2005).
Since fishermen do not distinguish the two squid species, an analysis of their mixing proportion was conducted suggesting a rising trend of L. vulgaris, while the presence of L. forbesii is decreasing over time. While there could be concerns about a potential bias due to the geographically restricted sampling at a single port, this trend is supported by data from the CGFS scientific survey conducted in October in the English Channel between 2000 and 2017 (ICES, 2018). This survey recorded increasing biomass and abundance indices for L. vulgaris and declining indices for L. forbesii. It is consistent with the findings of Oesterwind et al. (Reference Oesterwind, Barrett, Sell, Núñez-Riboni, Kloppmann, Piatkowski and Laptikhovsky2022) who found that the distribution range of L. forbesii has declined in the English Channel, but has increased in the North Sea, suggesting a northward shift in population range. Rising temperatures could be one of the causes of this shift, where warmer temperatures may lead to rapid development of L. vulgaris paralarvae and juveniles, by shortening the vulnerable paralarvae phase, thereby enhancing survival rates and hence increasing recruitment (Moreno et al., Reference Moreno, Pierce, Azevedo, Pereira and Santos2012). Conversely, L. forbesii, which spawns in deeper, colder waters, might experience challenges due to rising sea temperatures (Lordan and Casey, Reference Lordan and Casey1999; Salman and Laptikhovsky, Reference Salman and Laptikhovsky2002). Since L. forbesii has adapted to cooler environments, higher temperatures do impact its reproductive success and overall distribution (Marcout et al., Reference Marcout, Foucher, Pierce and Robin2024). This thermal sensitivity of deeper, colder-water spawning populations may lead to a disadvantage for L. forbesii in warming seas, further contributing to the observed shifts in distribution between these two Loligo species.
The mixing of species changes during the fishing season related to the differences in life-cycle timing (Holme, Reference Holme1974; Robin and Boucaud-Camou, Reference Robin and Boucaud-Camou1995; Royer et al., 2002; Laptikhovsky et al., Reference Laptikhovsky, Allcock, Barnwall, Barrett, Cooke, Drerup, Firmin, Lozach, MacLeod and Oesterwind2022). Recruitment begins in June in L. forbesii and in September in L. vulgaris. At the beginning of the fishing season, L. forbesii mean DML is the lowest around 14 cm in June. Mean DML increases gradually until it reaches 28 cm in December. For L. vulgaris, recruitment begins in September with minimum mean DML around 13 cm until it reaches 24 cm in April. If the size at sexual maturity is known for each species individually (as for L. vulgaris from Moreno et al., Reference Moreno, Pereira, Arvanitidis, Robin, Koutsoubas and Perales-Raya2002), analysing the size structure of catches for the two species separately can provide a critical benchmark for effective resource management.
Monthly species proportions observed at Port-en-Bessin have been applied to model population dynamics at the scale of the whole English Channel (Royer et al., 2002). The fact to use only observations from one harbour was a strong hypothesis. However, it is worth noting that the seasonal pattern of species recruited and exploited in sequence according to their life-cycle is very consistent in the long term. This advocates for a general trend at the population scale.
Concerning the geographic origin of landings, results reveal a shift in the fishing grounds of Port-en-Bessin vessels, with a decrease in cephalopod catches in the Western part of the English Channel (from 45% of squid catches in 2001 to 5% in 2021 and from 35% of cuttlefish catches in 2001 to 4% in 2021). The significant reduction in the presence or catchability of cephalopods in the Western part of the English Channel might indicate changes in cephalopods distribution, migration patterns or habitat preference that have become favourable in the Eastern part of the English Channel. Climate change may be contributing to a recent eastward shift in cephalopod distribution in the English Channel (Oesterwind et al., Reference Oesterwind, Barrett, Sell, Núñez-Riboni, Kloppmann, Piatkowski and Laptikhovsky2022). This shift in distribution may also help explain the growing interest of the Dutch fleet in squid fisheries in recent years (2019–2022; ICES, 2023), as they increasingly target the Eastern English Channel, where squid populations appear to be more concentrated.
This redistribution may also reflect changes in fishing strategies, such as the reallocation of fishing effort closer to harbours to reduce steaming costs, a practice increasingly adopted by fleets to mitigate rising fuel prices (Poos et al., Reference Poos, Bogaards, Quirijns, Gillis and Rijnsdorp2010; Bastardie et al., Reference Bastardie, Nielsen, Andersen and Eigaard2013).
In addition, the impacts of Brexit and the Fisheries Act have likely influenced both fishing strategies and landing practices within the French fishing fleet. To gain a more comprehensive understanding, it would be valuable to compare these findings with data from other harbours along both the French and English coasts of the English Channel. Further investigation is needed to understand the underlying causes and to inform sustainable fishery management practices.
Supplementary Material
The supplementary material for this article can be found at https://doi.org/10.1017/S0025315425000281.
Data
The data that support the findings of this study are available from the online supplementary materials.
Acknowledgements
In addition to the involvement of university staff and students, this work has benefited from the financial support of a long series of projects funded by the EU or by the Normandy Region. These are listed in Appendix 5.
Author contributions
A.M.: sampling program participation, investigation, data curation, formal analysis, writing – original draft. M.G.: sampling program participation, review and editing. E.F.: fisheries statistic data acquisition, data analysis advice. J.R.: implementation and monitoring of the sampling program, co-ordination of the study, supervision – writing, review and editing.
Competing interest
None.