INTRODUCTION
Soil organic carbon (SOC) is considered a carbon (C) sink or source of atmospheric carbon dioxide (CO2), depending on soil use and management, vegetation and water resources (Lal Reference Lal2009). It is estimated that in the last 200 years, soil C stocks have become a source of atmospheric CO2, mainly due to fossil fuel burning (Lal Reference Lal1997). Marland et al. (Reference Marland, Andres, Boden, Johnston and Brenkert1999) report dramatic increases in emissions from burning fossil fuels during the 20th century: from 534 million tonnes (t) C/year in 1900 to 6608 t C/year in 1998.
Today it is necessary to explore a large potential for synergies between mitigation and adaptation and further studies are warranted to better quantify short- and long-term effects on suitability for mitigation and adaptation to climate change (Smith & Olesen Reference Smith and Olesen2010).
The models that attempt to explain SOC changes have been developed to predict loss rates or sequestering of SOC, understand processes and develop SOC management schemes, among other things (Lal Reference Lal2009; Liu et al. Reference Liu, Chan and Conyers2009). The Rothamsted organic carbon turnover model (RothC model) has been used particularly to predict SOC changes in agricultural, forest and grassland systems in diverse parts of the world (Coleman et al. Reference Coleman, Jenkinson, Crocker, Grace, Klir, Korschens, Poulton and Richter1997; Falloon et al. Reference Falloon, Smith, Coleman and Marshall1998; Falloon & Smith Reference Falloon and Smith2002; Skjemstad et al. Reference Skjemstad, Spouncer, Cowie and Swift2004; Guo et al. Reference Guo, Falloon, Coleman, Zhou, Li, Lin and Zhang2007; Liu et al. Reference Liu, Chan and Conyers2009). Smith et al. (Reference Smith, Smith, Powlson, Mcgill, Arah, Chertov, Coleman, Franko, Frolking, Jenkinson, Jensen, Kelly, Klein-Gunnewiek, Komarov, Li, Molina, Mueller, Parton, Thornley and Whitmore1997) evaluated nine SOC models with data from seven long-term experiments in different parts of the world and found that the RothC-26.3 model was one of the best since it simulated all land uses, had few errors and achieved modelling with widely available data, as well as being simple in its structure.
Most of the models for predicting SOC changes have been used in long-term experiments. It is difficult to measure significant changes in SOC over periods of less than 20 years, since the changes are relatively small in proportion to the size of the C stocks. Also, there is continuous entry and exit of SOC, and a substantial fraction of soil organic matter appears to be inactive for a short time. In addition, sampling is inherently variable (Ellert et al. Reference Ellert, Janzen, McConkey, Lal, Kimble, Follet and Stewart2001; Post et al. Reference Post, Izaurralde, Mann and Bliss2001; Conant & Paustian Reference Conant and Paustian2002). However, Campbell et al. (Reference Campbell, Zentner, Selles, Biederbeck, McConkey, Blomert and Jefferson2000) quantified the effects of crop rotation on SOC for 6 years in a semi-arid environment and showed that SOC changes in such a short time can be affected by crop management and can be reasonably measured or estimated.
In Mexico, a preliminary compilation of temporal information on SOC revealed that the available data are from short-term experiments (<20 years). Nevertheless, sites for which SOC measurements were available are being re-sampled to obtain data over longer periods.
The present study, part of broader research work in SOC modelling at a regional and national scale in Mexico, evaluated the performance of the RothC model with SOC data from short-term experiments (1–15 years) conducted at five sites. The experiments included agricultural, forest, grassland and scrub systems; plant residue (PR) and organic fertilizer inputs were obtained by direct measurements and estimations.
MATERIALS AND METHODS
Description of the RothC conversion model
The RothC model, according to Coleman & Jenkinson (Reference Coleman and Jenkinson2005), considers the effect of soil type, moisture content, temperature and plant cover on the SOC conversion processes. SOC stock is divided into five compartments as function of speed of decomposition, four of them are considered active and one passive: (1) easily decomposed plant material (DPM, remains in the soil for 0·17 years), (2) microbial biomass (BIO, 1·69 years), (3) resistant plant material (RPM, 2·31 years), (4) humified organic matter (HUM, 49·5 years) and (5) inert organic matter (IOM, is set to a mean residence time of 50 000 years).
The DPM and RPM compartments decompose and become BIO and HUM, and they contribute CO2 to the atmosphere. The model includes a function that adjusts the proportions of BIO, HUM and CO2, according to the soil clay content. IOM (t/ha) is obtained from Falloon et al. (Reference Falloon, Smith, Coleman and Marshall1998):

where COT=organic carbon (t/ha).
Decomposition of each active compartment at the end of month (Y) in t/ha is given by the expression:

where Y o is the initial C; a, b and c are the factors that modify the rate of decomposition k (temperature, moisture and soil plant cover, respectively); the value of k (per year) is fixed for each active compartment: DPM: 10·0, RPM: 0·3, BIO: 0·66, HUM: 0·02; and t is 1/12 so that the rate of decomposition can be expressed monthly. The distinction between the PRs that enter the soil is given as a function of the default values originating from the DPM/RPM ratio: 1·44 for farming systems and cultivated grasses; 0·67 for bushes and grasses; and 0·25 for tropical or deciduous forests. The entry parameters include mean temperature, monthly mean precipitation, mean monthly evaporation, clay content (edapho-climatic data), monthly C input from PRs and organic fertilizers, and the number of months that the soil has cover.
RothC model simulations
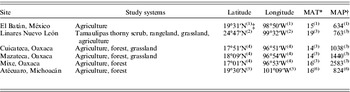
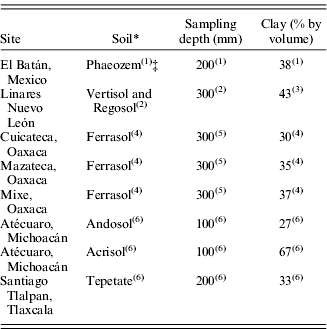
Simulation with the RothC model developed in two stages: initialization and prediction. In the initialization stage, following the proposal of Jenkinson et al. (Reference Jenkinson, Meredith, Kinyamario, Warren, Wong, Harkness, Bol and Coleman1999), it was assumed that the SOC content measured in the systems achieves a condition of equilibrium. The RothC model is executed inversely to obtain the quantity of C that enters the soil yearly to maintain the specific initial SOC content (COi) measured in the experiment. The condition of equilibrium is achieved by executing the RothC continually for 10 000 years. During this process, the distribution of C is determined for each of the five compartments necessary for the model to function. In this stage, the necessary monthly data are the edapho-climatic parameters mentioned above, together with soil plant cover, C input to the soil to maintain COi, the DPM/RPM ratio and IOM. The data on climate covering 30–38 years were obtained from the climate database of the Rapid Extractor of Climatological Information (IMTA 2000) and from weather stations located in the experimental sites (Table 1). The soil data were obtained from several reliable sources of information available for each experiment (Table 2); IOM was obtained with Eqn (1); the DPM/RPM ratio was that recommended by RothC by default. Part of this information is summarized in Tables 1 and 2. In the prediction stage, the model was executed with the C contents of each compartment obtained in the previous stage, soil-climate information, DPM/RPM ratio and monthly information from the management scenario that included C entry (t/ha) from PR, organic fertilizer and soil cover. The distribution of PRs was uniform during the months soil was covered because, as Coleman & Jenkinson (Reference Coleman, Jenkinson, Powlson, Smith and Smith1996) indicate, the way in which the entries are distributed has little effect on SOC calculations.
General characteristics of the study sites

* MAT=mean annual temperature (°C).
† MAP=mean annual precipitation (mm).
‡ Source: (1)Fuentes et al. (Reference Fuentes, Govaerts, De León, Hidalgo, Dendooven, Sayre and Etchevers2009); (2)Pando-Moreno et al. (Reference Pando-Moreno, Jurado, Manzano and Estrada2004); (3)IMTA (2000); (4)PMSL (2009); (5)Covaleda (Reference Covaleda2008); (6)CNA (2007a); and (7)CNA (2007b).
Edaphic characteristics of the study sites
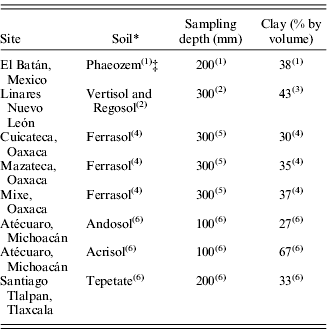
* FAO (1998).
‡ Source: (1)Fuentes et al. (Reference Fuentes, Govaerts, De León, Hidalgo, Dendooven, Sayre and Etchevers2009); (2)Pando-Moreno et al. (Reference Pando-Moreno, Jurado, Manzano and Estrada2004); (3)Bravo-Garza & Bryan (Reference Bravo-Garza and Bryan2005); (4)Estrada, personal communication; (5)Acosta (Reference Acosta2003) and González-Molina et al. (Reference González-Molina, Etchevers-Barra and Hidalgo-Moreno2008); and (6)Covaleda (Reference Covaleda2008).
According to Smith et al. (Reference Smith, Falloon, Coleman, Smith, Piccolo, Cerri, Bernoux, Jenkinson, Ingram, Szabo, Pasztor, Lal, Kimble and Stewart2000), the RothC model must be tested and, if necessary, recalibrated using data from the specific region where it is to be used. Therefore, at the start of the simulations of each experiment, tests were conducted with C input from PR and organic fertilizer, considering that it is an important parameter in calibrating the model (Guo et al. Reference Guo, Falloon, Coleman, Zhou, Li, Lin and Zhang2007). The DPM/RPM ratio was not modified because it had been tested previously by Janik et al. (Reference Janik, Spouncer, Correll and Skjemstad2002) in temperate soils of Australia and by Shirato et al. (Reference Shirato, Paisancharoen, Sangtong, Nakviro, Yokozawa and Matsumoto2005) in tropical soils of Nigeria with little change in RothC model simulations.
The information from both stages in terms of the C that enters the soil as PR, organic fertilizers and soil plant cover (months) is described in detail in the following section for each of the systems reported by study site.
General characteristics of the study sites
The study was conducted in five sites in Mexico: (1) El Batán, State of Mexico; (2) Linares, Nuevo León; (3) the Mazateca, Cuicateca and Mixe regions of the northern mountains of Oaxaca; (4) Atécuaro, Michoacán; and (5) Santiago Tlalpan, Tlaxcala. The El Batán site is an experimental station of CIMMYT where SOC information in agricultural management systems (16 treatments) has been stored over a period of 15 years, 1991–2006. For the present study, however, the information from 1996 to 2006 was used (Fuentes et al. Reference Fuentes, Govaerts, De León, Hidalgo, Dendooven, Sayre and Etchevers2009). In Linares, Pando-Moreno et al. (Reference Pando-Moreno, Jurado, Manzano and Estrada2004) reported SOC over the period 1993–1999 in four systems: agriculture, grasslands, rangelands and Tamaulipas thorny scrub in a reserve. For the Mazateca, Cuicateca and Mixe regions of the northern mountains of Oaxaca, information is available on SOC in farming, forest and grassland systems for the period 2000–4 (Monreal et al. Reference Monreal, Etchevers, Acosta, Hidalgo, Padilla, López, Jimenez and Veláquez2005; González et al. Reference González-Molina, Etchevers-Barra and Hidalgo-Moreno2008). The Atécuaro and Santiago Tlalpan sites were studied by Covaleda (Reference Covaleda2008) for a period of 4 years and 1 year, respectively, in forest and agricultural systems. The main characteristics of the study sites are presented in Tables 1 and 2.
El Batán, Estado de México
Systems
The agricultural systems of this site were a combination of (1) tillage types: zero tillage (ZT) or traditional tillage (TT); (2) residue management with (A+R) or without (A−R) residues; (3) monocropping: maize (m) or wheat (w); and (4) rotation: wheat–maize and maize–wheat (P), making a total of 16 treatments. Regarding residue management, +R consisted in leaving all of the residues of the previous crop, which were ploughed under or left on the surface, depending on the experimental treatment, while –R consisted in removing all of the aerial residues of the previous crop with a rake.
Plant residue input
In the A+R maize and wheat systems, C input to the soil in each treatment in which PRs were added included the aerial biomass (AB), which was measured yearly, and roots, which were assumed to be 0·15 of the AB. This proportion was taken from the study of Kuzyakov & Domanski (Reference Kuzyakov and Domanski2000), who indicated that in cereals (wheat and barley) 0·10–0·15 of the total C sequestered by the photosynthetic process is stored in the root. In maize managed without adding aerial PRs, the C inputs to the soil were 0·18 of the AB remaining on the surface after harvest (Pérez et al. Reference Pérez, Etchevers, Navarro and Nuñez2000) and 0·15 of AB being the contribution from roots. In wheat, the contribution was 0·30 of the AB as harvest remains (Fischer et al. Reference Fischer, Santiveri and Vidal2002) and 0·15 of the AB estimated as the contribution of roots. It was assumed that in no-till systems there was plant cover on the soil throughout the year, even in those managed without PRs. In the case of TT with maize, soil had cover from April to October and in wheat from May to September.
Linares, Nuevo León
Systems
The systems studied were: (1) Tamaulipas thorny scrub in a reserve; (2) agriculture (AGR-LIN), such as maize and wheat; (3) rangelands that are sites of conversion from primary or secondary vegetation to grazing sites (RL); and (4) grasslands with introduced grasses, such as buffelgrass (Pennisetum ciliare L.) (GR).
Entry of PRs and organic fertilizers
Information on entry of C into the soil from PRs and organic fertilizers (t/ha) introduced into the model was from estimations and relationships near the site. In Tamaulipas thorny scrub estimations of the AB and underground biomass (UB) by Nárvar-Chaidez & De (Reference Nárvar-Chaidez and De2008) and the monthly distribution of litter from the work of González et al. (Reference González Rodríguez, Cantú Silva, Gómez Meza and Ramírez Lozano2004) were used. In the agricultural systems, PRs were estimated on the basis of the 3 t/ha maize grain yield and a harvest index (HI) of 0·4. The roots were estimated as 0·15 of the AB and remains from the previous harvest were 0·18 of the AB. In rangeland, PR was obtained with the following equation:

where PPN is the net primary productivity (kg dry matter (DM)/ha/year), UPPN is the proportion of PPN used by domestic ruminants (kg DM/ha/year), and IL is the proportion of invisible losses of PPN by insects, fauna and wind (kg DM/ha/year). UPPN was obtained from the study of Esparza (personal communication), where the related precipitation and UPPN in grasses and found a maximum of 0·80 in grasses of Chihuahua (300 mm) to only 0·03 in the dry tropics (1200 mm); in Linares it was 0·08. IL of PPN were considered to be 0·30. The concentration of C in DM was 0·45; and 0·001 is the conversion factor to tonnes. PPN is equal to

where PMA is the mean annual precipitation (mm) and the constant 8 represents the amount of forage produced with each mm of precipitation (kg MS/ha). The value of the constant was deduced from the reports of Le Houerou (Reference Le Houerou1984) and Le Houerou et al. (Reference Le Houerou, Bingham and Skerbek1988), who estimate this value in the range of 1·5–7·2 for arid and semi-arid zones of the world with precipitation of 300–600 mm. In the case of Linares, precipitation is more than 750 mm. To estimate the amount of organic fertilizer that is added as manure, the stocking rate (SR) of the site was calculated

where 4380 kg DM of forage needed yearly for a cow weighing c. 450 kg, and UPPN and IL are 0·08 and 0·30, respectively. In this way, C contributed by manure (CA) is

where total animal intake=4380×0·5/SR, and substituting gives:

The value 0·5 is the undigested DM contributed as faeces, since in the case of tropical rangelands, according to Díaz-Solís et al. (Reference Díaz-Solís, Kothmann, Hamilton and Grant2003), digestibility is 0·50–0·65. The concentration of C in DM not assimilated by livestock was 450 g/kg.
Finally, in grasslands, the calculation of C entry as PR and organic fertilizer followed the same procedure as that explained for rangeland, considering 0·40 UPPN for livestock and also eliminating IL since soil management on grasslands is more intensive. An UPNN per animal of 0·40 was considered for tropical grasslands, since use in temperate grasslands is nearly 0·60 (Díaz-Solís et al. Reference Díaz-Solís, Kothmann, Grant and De Luna-Villarreal2006) and that in these systems the forage is of lower quality. Soil plant cover in scrub, rangelands and grasslands systems is year round, while in agricultural systems it is from April to November.
Oaxaca
Systems
The systems studied were: (1) agriculture: maize (Zea mays L.), sometimes intercropped with bean (Phaseolus vulgaris L.) (milpa) under TT or conservation tillage (CT); milpa intercropped with fruit trees (MIFT) rows of peach (Prunus persica L.) or coffee that form a living wall barrier or terrace. The latter has a runoff filter next to the wall (base of the tree trunks) that was built upstream with harvest residues and branches pruned from the fruit trees. The living barrier (LB), unlike the living wall terrace, does not have a runoff filter, and the remainder of the plot (where there are no trees) is managed under TT; (2) forests of secondary vegetation in the Mazateca region: liquidambar (LF) (Liquidambar sp.), alder (AF) (Alnus sp.); coffee (CA) (Coffea arabica L.) in the Mazateca and Mixe regions; and in the Mixe region: 6-year-old acahual (ACA); and (3) grasslands in the Cuicateca and Mazateca regions (Cortés et al. Reference Cortés, Turrent, Díaz, Hernández, Mendoza and Aceves2005).
Entry of PRs and organic fertilizers
AB and UB of all of the systems were measured by Acosta (Reference Acosta2003); crop residues and organic fertilizers were reported by Cortés et al. (Reference Cortés, Turrent, Díaz, Hernández, Mendoza and Aceves2005). In the agricultural systems, MIFT and LB, separate predictions were made for the zone of the fences or barriers (×m), which occupied 0·1 ha of the plot, and for the remaining 0·9 ha of the plot (×p) since entry of residues in the two portions was different (Table 5). In the TT systems, PR entries included roots (0·15 of the AB) and 0·18 of the AB. In the agricultural systems of the Mazateca and Mixe regions, C entries of herbaceous plants were accounted. In the agricultural systems, the residues were distributed over March and November. In MIFT×m and LB×m, soil cover was permanent throughout the year. In some agricultural systems, chicken manure containing 162·3 g C/kg (Rivero & Carecedo Reference Rivero and Carecedo1999) was applied during the planting month. In forest systems, because of the lack of data on litter production, 0·60 of the measured layer of forest litter was considered as aerial PRs. The soil had plant cover the entire year. In grasslands, PRs were estimated with Eqn (3), considering 0·40 UPPN (Díaz-Solís et al. Reference Díaz-Solís, Kothmann, Grant and De Luna-Villarreal2006). PPN on the grasslands was the sum of AB plus UB as measured by Acosta (Reference Acosta2003). Entry of C as organic fertilizer was estimated with Eqns (5) and (6), 0·40 used by livestock. The soil had plant coverage all year. The concentration of C assigned to PRs and pruning was 0·45 of the DM based on the measurements of Figueroa-Navarro et al. (Reference Figueroa-Navarro, Etchevers-Barra, Velázquez-Martínez and Acosta-Mireles2005).
Atécuaro, Michoacán (Andosol)
Systems
The data refer to the integration of 10 forest sites (B1–B10), one grazing site and one agricultural site. The sites are distributed on a hillside near the community of Atécuaro. Here, degradation was found to decrease with altitude. The forest systems comprise pine–oak forests populated mainly by two pine species and seven oak species, located on moderate to steep slopes (up to 42°), with variable tree density (250–1560 number of standing tree/ha). These systems exhibit different degrees of degradation resulting from lumbering, opening of paths for dragging logs and grazing. The grazing site has shrub vegetation and repopulating pines, while the agricultural site, recently abandoned and thus not cultivated, has grasses (Covaleda Reference Covaleda2008).
Entry of PRs and organic fertilizer
In forest systems, C entries from roots (t/ha) were estimated from the PR necessary to obtain the initial SOC value by executing the model inversely. It was assumed that 0·30–0·50 of these PRs are forest roots (in the reference study, samples were collected only to a depth of 100 mm). Kuzyakov & Domanski (Reference Kuzyakov and Domanski2000) pointed out that the amount of C from forest roots should be greater than in other systems since they are deeper and have a longer residence time because they contain lignin and other components that decompose slowly. These authors report that the proportion of C in roots relative to the total assimilated C is 0·10–0·15 in cereals and 0·15–0·25 in grasslands. Edwards & Harris (Reference Edwards and Harris1977) and Persson (Reference Persson1978) have reported values of 0·40–0·60 in forests. Forest litter was measured in forest sites B4 and B10, and with this data, litter production was estimated in other sites as a function of tree density and state of degradation. The amount of C contributed by herbaceous plants and shrubs was estimated based on the information in Ordóñez et al. (Reference Ordóñez, De Jong, García-Oliva, Aviña, Pérez, Guerrero, Martínez and Masera2008) for the study area. In the agricultural system, the PR considered are those obtained from the study of Covaleda (Reference Covaleda2008) for maize: roots (0·15 of AB) and AB (0·18). The amount of C from herbaceous plants was assumed to be 0·2 t/ha, considering the measurements of Ordóñez et al. (Reference Ordóñez, De Jong, García-Oliva, Aviña, Pérez, Guerrero, Martínez and Masera2008) at agricultural sites in the Purépecha region of Michoacán. In the grasslands, PR were estimated with Eqns (3) and (4), considering a constant of 15 (kg MS/ha/mm) and a 0·40 UPPN based on a study of grasslands in areas of the Mexican dry and wet tropics (Díaz-Solís et al. Reference Díaz-Solís, Kothmann, Grant and De Luna-Villarreal2006). Organic fertilizer was estimated with Eqns (5) and (6) with a 0·40. UPPN by livestock. The soil had plant cover all the year round in the forest systems, while in grasslands and maize cropping, the soil was covered from April to November.
Atécuaro, Michoacán (Acrisol)
Systems
The agricultural systems of this site are divided into four treatments: (1) traditional without fallow (Tt) with one annual crop using low levels of chemical fertilizers; (2) improved traditional (Tm), with associated crops, contribution of PR and moderate use of agrochemicals; (3) organic management (To), with multi-cropping and organic fertilizers; and (4) fallowing every other year (Tav), consisting in 1 year of fallow with cattle grazing, followed by 1 year of cropping.
Entry of PRs and organic fertilizers
PR for maize was estimated with the study site AB data: roots (0·15 of AB) and AB (0·18) (Covaleda Reference Covaleda2008). The amount of C from herbaceous plants was assumed considering the study of Ordóñez et al. (Reference Ordóñez, De Jong, García-Oliva, Aviña, Pérez, Guerrero, Martínez and Masera2008). In the Tm and To systems, harvest residues and organic fertilizer were added to the soil (Covaleda Reference Covaleda2008). The Tav system was left with the entry of PR from the maize crop one year and the other year with grassland PR. PR and organic fertilizers were estimated under the same considerations as for the Andosol soil plots of the same site. The soil had plant cover during the months of April to November in the Tt, Tm and To systems. In the Tav system cover alternated: April to November during the cropping year and all the year round during the fallow-grazing year.
Santiago Tlalpan, Tlaxcala
Systems
The agricultural systems of this site involved five treatments: (1) traditional (Tt) with one annual crop using low rates of chemical fertilizers; (2) traditional improved (Tm) with associated crops, addition of PR and greater use of agrochemicals; (3) organic (To) with associated crops and organic fertilizers; (4) ploughed with traditional system management (Pt); and (5) ploughed with organic system management (Po).
Entry of PRs and organic fertilizers
Root PR for maize was estimated considering a HI of 0·4 (Navarro & Flores Reference Navarro, Flores, Zebrowski, Quantin and Trujillo1997) and a grain yield of 2·7 t/ha (Fechter-Escamilla et al. Reference Fechter-Escamilla, Vera, Werner, Zebrowski, Quantin and Trujillo1997). Aerial PRs, such as weeds and harvest remains, were reported by Covaleda (Reference Covaleda2008). The soil had plant cover from April to November and during the entire year when PRs were added.
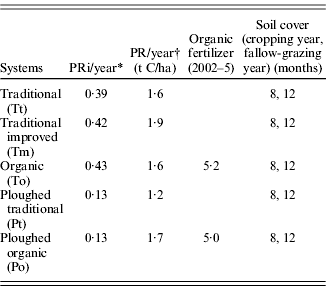
Table 3 shows an example of t C/ha to the soil from initial PR (PRi), generated by the RothC model, measured PR and organic fertilizers, and months when soil has plant cover in the systems of Santiago Tlalpan, Tlaxcala.
Entry of C to soil as PR and organic fertilizer, and months soil has plant cover in the systems of Santiago Tlalpan, Tlaxcala
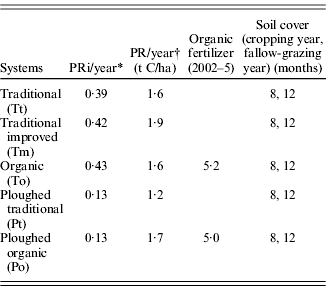
* PRi=PR mean entry to produce initial SOC.
† PR=PR mean entry/year.
Evaluation of RothC model performance
To evaluate the model's performance, pairs of SOC data, observed and predicted, of the systems were grouped by site and by system in the evaluation period. The statistics used were the coefficient of correlation (r), root mean square error (RMSE), efficiency of the model (EF) and relative error (ER) as defined by Smith et al. (Reference Smith, Smith, Powlson, Mcgill, Arah, Chertov, Coleman, Franko, Frolking, Jenkinson, Jensen, Kelly, Klein-Gunnewiek, Komarov, Li, Molina, Mueller, Parton, Thornley and Whitmore1997). RMSE ranged from 0 to ∞, EF from −∞ to 1 and ER from −∞ to ∞. In an ideal test, RMSE and ER are equal to 0 and EF is equal to 1. R 2 of the regression analysis was also calculated to illustrate the adjustment of the results.
RESULTS
RothC model performance in the sites
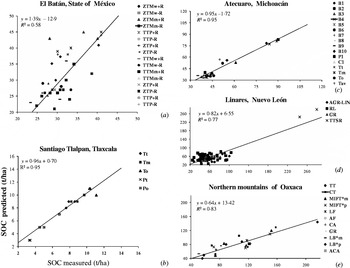
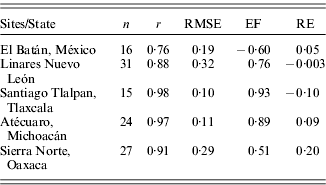
Consistency was observed in terms of the r values in the SOC simulation in the temperate sites El Batán, northern mountains of Oaxaca, Atécuaro and Santiago Tlalpan and in the hot climate site Linares. The r values were in the range of 0·76–0·98, and the RMSE values were between 0·10 and 0·32, without omitting extreme values (Table 4). The sites Santiago Tlalpan and Atécuaro had lower RMSE values of 0·10 and 0·11, respectively. In Atécuaro, this was probably because this was a 1-year experiment, and the rates of SOC change were small. In El Batán, Linares and Oaxaca, the RMSE were 0·19, 0·32 and 0·29, respectively. EF, which was positive at Linares (0·76), Santiago Tlalpan (0·93), Atécuaro (0·89) and Oaxaca (0·51), indicated that the predicted values describe the trend of the measured values better than the average of the observations. In the El Batán site, with a negative value (−0·60), the predicted values do not describe the trend in measured values. The ER value indicated that there was no bias in the total difference of measured and predicted values at El Batán, Linares and Atécuaro, but a bias did exist with the ER values −0·10 and 0·20 at Santiago Tlalpan and Oaxaca, respectively (Table 4). The trends in EF values are clearly seen in the dispersion graphs of the measured and predicted SOC values. The predictions of the model in the systems at El Batán had an R 2 of 0·58, unlike the other four sites where linear trends were observed with R 2 values in the range of 0·77–0·98 (Fig. 1).
Linear regression fit (R 2) of measured SOC against SOC predicted with the RothC model in five sites studied in Mexico. Legend: El Batán: zero tillage (ZT) or traditional tillage (TT); residue management with (+R) or without (−R) residues; monocropping: maize (m) or wheat (w); and rotation: wheat–maize and maize–wheat (R). Santiago Tlalpan: traditional (Tt); traditional improved (Tm); organic (To); ploughed with traditional system management (Pt); and ploughed with organic system management (Po). Atécuaro: traditional without fallow (Tt); improved traditional (Tm); organic management (To); and fallowing every other year (Tav); forest sites (B1–B10), grazing site (P1); and agricultural site (C1). Linares: Tamaulipas thorny scrub in a reserve (TTSR); agriculture Linares (AGR-LIN); rangelands (RL); grasslands with introduced grasses (GR). Oaxaca: traditional tillage (TT) or conservation tillage (CT); milpa intercropped with fruit trees (MIFT×p; MIFT×m) of the fences or barriers (0·9 ha of the plot=×p; 0·1 ha of the plot=×m); the living barrier (LB); liquidambar forests (Liquidambar sp.) (LF): alder (Alnus sp.) (AF); coffee (Coffea arabica L.) (CA); 6-year-old acahual (ACA); and grasslands (GR).

Statistics that describe RothC model performance in short-term experiments in five study sites of México
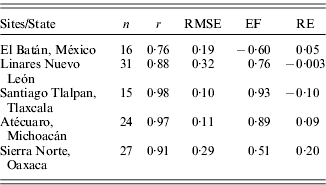
n=number of pairs of observed and predicted SOC data.
RMSE=root mean square error.
EF=model efficiency.
RE=relative error.
Performance of the RothC model in systems
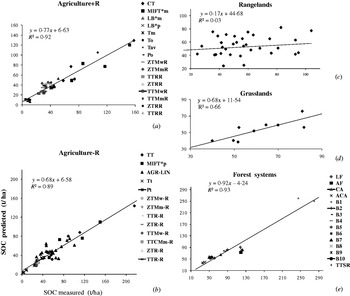
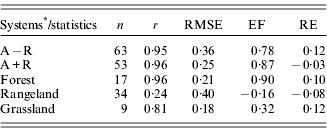
The various land use systems across the sites were grouped into similar categories. The A−R systems included those with meagre entry of PRs into the soil such as TT, TTMm−R, ZTMt−R, ZTMm−R, ZTMt−R, CTP−R and TTP−R, etc. Their counterparts were A+R systems, such as TT, Tm, To, etc. The forest systems included Alder, Liquidamber, Pine–Oak, Acahual, Coffee, and preserved Tamaulipas thorny scrub. The SOC contents of the El Batán systems, grouped with the A+R and A−R systems had a better fit, regardless of the site where they were found (Table 5). The coefficient of correlation, in the range of 0·81 and 0·96, indicated the existence of a high degree of association between pairs of measured and predicted values in the agriculture, forest and grassland systems, but not in the rangeland system (0·24). RMSE was above 0·18, the highest value being that of rangeland (0·40). EF was positive and above 0·78 in the agriculture and forest systems, and 0·32 in grasslands. The lowest EF value occurred in rangeland systems (−0·16). The ER value indicated that there was no bias in the total difference of measured and predicted values in all of the systems, except in A−R and grasslands, where value was 0·12 (Table 5). The simulation error (SRME, EF and r) and the simulation bias (ER) can be seen in the dispersion graphs of Fig. 2, where the agriculture and forest systems had an R 2 in the range of 0·90–0·93, grasslands 0·66 and rangeland 0·03.
Linear regression fit (R 2) of the measured SOC against that predicted by the RothC model in five systems studied in Mexico. Legend: A+R (farming with residues added): zero tillage (ZT) or traditional (TT); residue management with (+R) or without (−R) residues; monocropping: maize (m) or wheat (w); and rotation: wheat–maize and maize–wheat (R) (ZTMw+R, ZTMm+R, TTP+R, ZTP+R, TTMw+R, TTMm+R); improved traditional (Tm); fallowing every other year (Tav); organic management (To); ploughed with organic system management (Po); milpa intercropped with fruit trees (MIFT×m) or the living barrier (LB×p and LB×m) (0·9 ha of the plot=×p; 0·1 ha of the plot fences or barriers=×m); and conservation tillage (CT). A−R (farming with no added residues): traditional (Tt); ploughed with traditional system management (Pt); agriculture Linares (AGR-Lin); traditional tillage (TT); traditional without fallow (Tt); MIFT×p; ZTMw−R, ZTMm−R, TTP−R, ZTP−R, TTMw−R, TTMm−R. Forest systems: liquidambar forests (Liquidambar sp.) (LF): alder (Alnus sp.) (AF); coffee (Coffea arabica L.) (CA); 6-year-old acahual (ACA); 10 forest sites (B1–B10), Tamaulipas thorny scrub in a reserve (TTSR). Rangeland: rangeland of Linares. Grassland: grassland of Linares, Oaxaca and Atécuaro.

Statistics that describe RothC model performance in short-term experiments in the systems studied in México
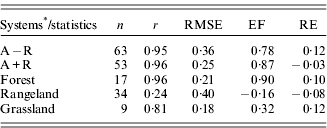
n=number of pairs of observed and predicted SOC data.
RMSE=root mean square error.
EF=model efficiency.
RE=relative error.
* A+R (farming with residues added): zero tillage (ZT) or traditional tillage (TT); residue management with (+R) or without (−R) residues; monocropping: maize (m) or wheat (w); and rotation: wheat–maize and maize–wheat (P) (ZTMw+R, ZTMm+R, TTP+R, ZTP+R, TTMw+R, TTMm+R); improved traditional (Tm); fallowing every other year (Tav); organic management (To); ploughed with organic system management (Po); milpa intercropped with fruit trees (MIFT×m) or the living barrier (LB×p and LB×m) (0·9 ha of the plot=×p; 0·1 ha of the plot fences or barriers=×m); and conservation tillage (CT). A−R (farming with no added residues): traditional (Tt); ploughed with traditional system management (Pt); agriculture Linares (AGR-Lin); traditional tillage (TT); traditional without fallow (Tt); MIFT×p; ZTMw−R, ZTMm−R, TTP−R, ZTP−R, TTMw−R, TTMm−R). Forest systems: liquidambar forests (Liquidambar sp.) (LF): alder (Alnus sp.) (AF); coffee (Coffea arabica L.) (CA); 6-year-old acahual (ACA); 10 forest sites (B1–B10), Tamaulipas thorny scrub in a reserve (TTSR). Rangeland: rangeland of Linares. Grassland: grassland of Linares, Oaxaca and Atécuaro.
DISCUSSION
RothC model performance in the sites
Although the RothC model was initially developed for temperate ecosystems (Smith et al. Reference Smith, Falloon, Coleman, Smith, Piccolo, Cerri, Bernoux, Jenkinson, Ingram, Szabo, Pasztor, Lal, Kimble and Stewart2000), it has been applied to predict SOC changes in a range of ecosystems (Coleman et al. Reference Coleman, Jenkinson, Crocker, Grace, Klir, Korschens, Poulton and Richter1997; Falloon et al. Reference Falloon, Smith, Coleman and Marshall1998; Falloon & Smith Reference Falloon and Smith2002). In the present work, the temperature function was parameterized with data from Ibadan, Nigeria, a tropical climate site (Kaonga & Coleman Reference Kaonga and Coleman2008). The present results are similar to the SOC predictions in Chinese sites with mean annual temperatures in the range of 4·6–12·7°C and mean annual rainfall of 372–600 mm. Guo et al. (Reference Guo, Falloon, Coleman, Zhou, Li, Lin and Zhang2007) used the RothC model to simulate SOC trends over time in four agricultural treatments in three sites of China and obtained r values of 0·55–0·86 and SRME of 0·02–0·20, omitting extreme values. Also, Shirato et al. (Reference Shirato, Paisancharoen, Sangtong, Nakviro, Yokozawa and Matsumoto2005), in tropical soils of Thailand, obtained positive r values in plots cultivated with maize and cassava, without applying PR to the soil. However, in plots where large amounts of residues were returned to the soil, simulated SOC was overestimated and the SRME values between 0·20 and 0·60 were attributed to a major contribution by fauna in the decomposition of the residues in tropical soils, in contrast with the soils of temperate climates. According to Smith et al. (Reference Smith, Smith, Powlson, Mcgill, Arah, Chertov, Coleman, Franko, Frolking, Jenkinson, Jensen, Kelly, Klein-Gunnewiek, Komarov, Li, Molina, Mueller, Parton, Thornley and Whitmore1997), some databases can be more difficult to simulate than others. The high SRME value of 0·32 of the Linares site was attributed to the fact that rangelands are complex systems, frequently perturbed by overgrazing, erosion and invasion of shrubs, toxic plants, rodents and fire, in addition to the heterogeneity of vegetation, soil and climatic variability of the area where they are located (Melgoza-Castillo Reference Melgoza-Castillo, Basurto and Hadley2006). In the case of Oaxaca, the high RMSE value would be due to the fact that the database consisted of measured SOC data, which according to a previous study of González et al. (Reference González-Molina, Etchevers-Barra and Hidalgo-Moreno2008) had overestimated the C concentration associated with a mineral fraction by 0·17 because of the presence of organic residues that were removed only after a second cleaning of the samples to remove all root residues. Guo et al. (Reference Guo, Falloon, Coleman, Zhou, Li, Lin and Zhang2007) point out that, when evaluating the performance of a model, several factors should be considered, a major one being the precision of the analytical data, which may be affected by errors committed in the laboratory or in sampling. Guo et al. (Reference Guo, Falloon, Coleman, Zhou, Li, Lin and Zhang2007) comment that a consensus at the international level is needed regarding the manner in which soil carbon is measured. However, in spite of the high RMSE values, compared with other simulations using the RothC model they are within the ranges reported by Smith et al. (Reference Smith, Smith, Powlson, Mcgill, Arah, Chertov, Coleman, Franko, Frolking, Jenkinson, Jensen, Kelly, Klein-Gunnewiek, Komarov, Li, Molina, Mueller, Parton, Thornley and Whitmore1997), Shirato et al. (Reference Shirato, Paisancharoen, Sangtong, Nakviro, Yokozawa and Matsumoto2005) and Guo et al. (Reference Guo, Falloon, Coleman, Zhou, Li, Lin and Zhang2007).
A possible explanation for the low EF values at El Batán cannot be related to the estimation of C entry through PRs since these were measured yearly. Nevertheless, it is necessary to make some considerations concerning the PR entry values with respect to the tillage system (CT and TT). According to Liu et al. (Reference Liu, Chan and Conyers2009), there is a need to improve the amplitude of the RothC model to simulate different tillage systems. The results they obtained with this model indicated that an important consideration is the loss of a large proportion of residues retained on the surface before entering the soil to become part of the SOC and also that high SOC contents in CT treatments can be the result of slow residue decomposition.
Performance of the RothC model in systems
According to the statistics evaluated, the best performance of the RothC model, in general, was obtained in agricultural and forest systems; in grasslands its performance was average, and it failed in the case of rangelands in the Linares site. The RothC model has been applied in crop systems, grasslands and forest soil systems (Coleman et al. Reference Coleman, Jenkinson, Crocker, Grace, Klir, Korschens, Poulton and Richter1997; Smith et al. Reference Smith, Smith, Powlson, Mcgill, Arah, Chertov, Coleman, Franko, Frolking, Jenkinson, Jensen, Kelly, Klein-Gunnewiek, Komarov, Li, Molina, Mueller, Parton, Thornley and Whitmore1997) and also in agroforestry systems (Kaonga & Coleman Reference Kaonga and Coleman2008), but there are no reports of its application in rangelands. The rangelands in Mexico are complex systems due to characteristics described by Melgoza-Castillo (Reference Melgoza-Castillo, Basurto and Hadley2006); they have more spatially variable SOC because vegetation and soils are more heterogeneous, and the climate is variable, in addition to the frequency and intensity of defoliation, the number of domestic ruminants and the intensity of grazing. However, alternative methods of estimating PRs and organic fertilizers used for grasslands in the Linares, Oaxaca and Michoacán sites revealed approximate trends in SOC changes (Tables 3 and 4).
The results of the present study show that major modifications in the internal parameters of the model are not necessary for the sites and systems evaluated in this work, except for the rangeland systems. Most adaptation options for climate change have positive impacts on mitigation.