Introduction
Concrete is the most widely used building material in the world and responsible for 5–10% of total greenhouse gases emission. The mechanical properties of concrete such as elastic parameters, strength, ductility, creep, shrinkage, and fracture behavior largely depend on the material structure at the nano- and microscale. To understand and improve the macroscopic mechanical performance of concrete, it is essential to study its microstructural mechanical properties. As an effective and powerful tool to detect the local elastic properties and hardness of the material microstructure, nanoindentation has been used to interpret the local elastic properties and hardness of such cement-based material at the nano- and microscale. Previously, many works have been done in studying the mechanical properties (indentation modulus, M, and hardness, H) of cement pastes by nanoindentation. In most studies,[Reference Constantinides and Ulm1–Reference Hu, Li, Gao and Zhang11] statistical analysis was used to deconvolute the mechanical properties of active phases from large arrays of nanoindentation tests on the polished cement paste. Statistical analysis exhibits some advantages in the study of such multi-phase material, e.g. the researchers do not need to know the location or material phase where each nanoindentation test was performed. The identified phases of the order of indentation modulus and hardness from low to high were considered as low-density C–S–H (calcium–silicate–hydrates), high-density C–S–H, ultra-high-density phase, and residual cement clinkers.[Reference Ulm, Vandamme, Bobko and Ortega6, Reference Vandamme and Ulm7, Reference Vandamme, Ulm and Fonollosa10] Ultra-high-density phase was a composite of high-density C–S–H and calcium hydroxide nanocrystals.[Reference Chen, Sorelli, Vandamme, Ulm and Chanvillard12] Some other studies considered the third phase as calcium hydroxide rather than ultra-high-density phase.[Reference Constantinides and Ulm4, Reference Howind, Hughes, Zhu, Puertas, Goñi, Hernández, Guerrero, Palacios, Dolado, Palomo, Zaragoza and Agüí8, Reference Davydov, Jirasek and Kopecky9] Regarding the significance of the microstructural mechanical information of hardened cement paste in concrete science and technology, this study aims to use nanoindentation to measure and map mechanical properties of the hardened cement pastes at different water-to-cement ratios, and reveal the identified phases of grid nanoindentation.
Materials and experiments
For the sake of comparison, two cement pastes were prepared at the different water-to-cement mass ratios (w/c) of 0.23 and 0.40. In the specimen preparation process, ASTM type I Portland cement was firstly mechanically mixed with deionized water and then cast into steel molds. After 24 h, the specimens were demolded and cured in moist condition (23 ± 1 °C and 95% relative humidity) prior to testing. Before nanoindentation tests, they were carefully polished to achieve a smooth surface. The polishing procedure can be divided into coarse- and fine polishing processes. Firstly, the small cubes of size approximately 15 mm × 15 mm × 10 mm were cut out at the middle portion. Then, in the coarse polishing process, they were polished carefully with abrasive paper (180, 240, 400, 600, 800, and 1200 grit) in order. After that, oil-based diamond suspensions (3, 1, and 0.25 µm) were used in the fine polishing process. Finally, they were cleaned in an ultrasonic bath to remove debris and suspensions left on the surface of the specimens. Using such polishing procedure, the specimen surface was smooth enough for the nanoindentation tests, as used in the previous work.[Reference Hu, Han, Gao, Zhang and Li13]
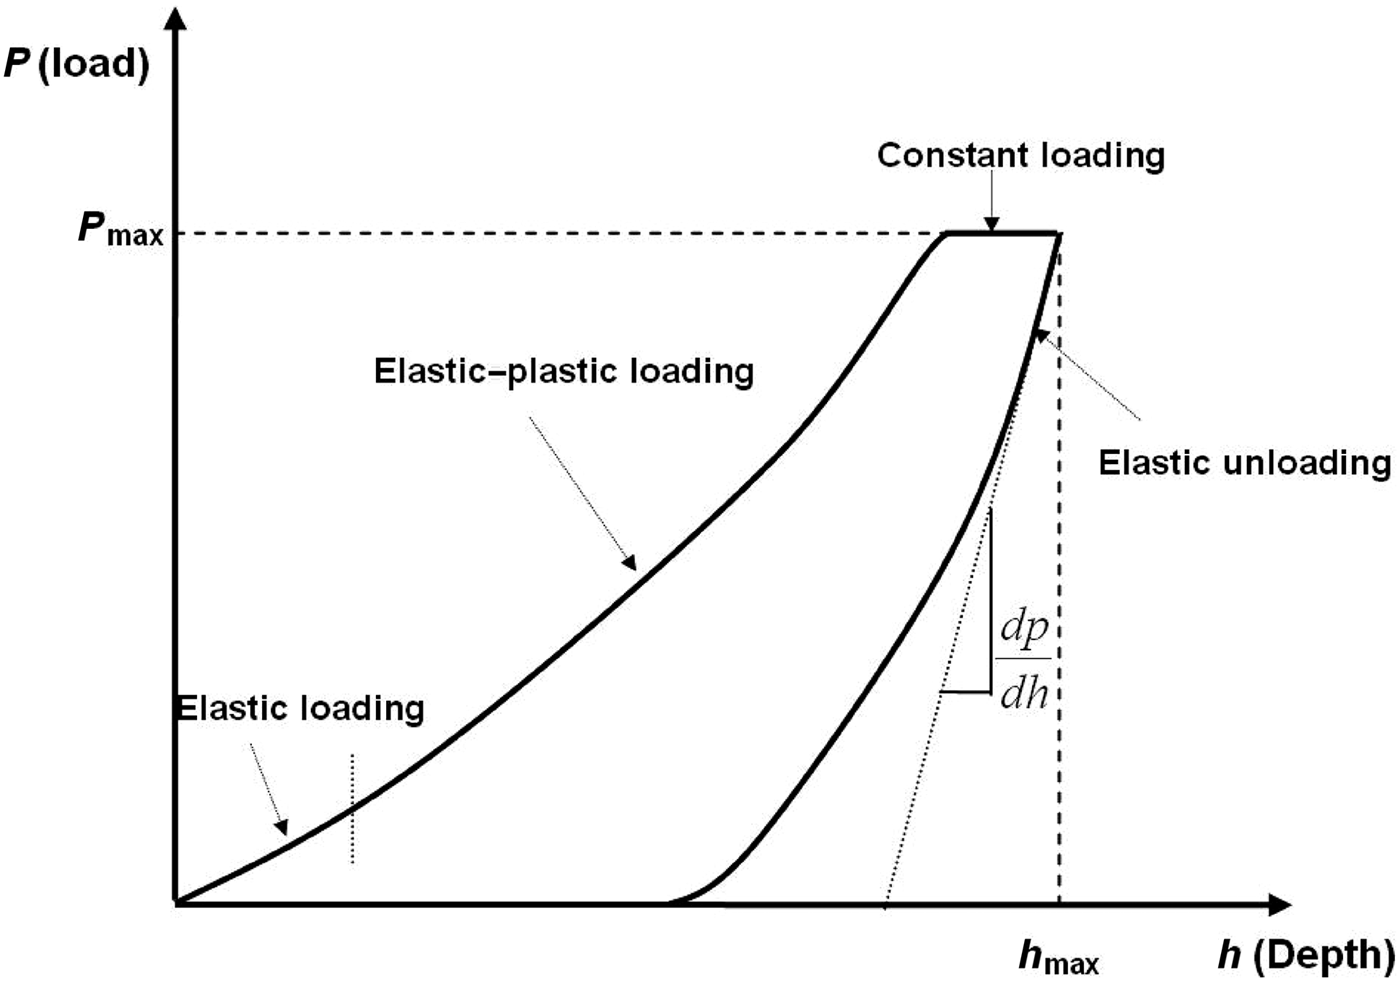
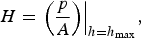
Instrumented nanoindentation equipped with a three-sided pyramid Berkovich tip was used to investigate the microstructural mechanical properties of the specimens. After nanoindentation was calibrated on standard material (fused quartz), a large number of tests were performed on the polished surface of the specimens. The maximum load used in this study is 2 mN and generates a maximum depth for hydration phases of about 300 nm. The principle of nanoindentation is to push a very sharp tip into the surface of a material and investigate the behavior of the material from the response of indentation tip. Figure 1 shows a typical load–depth curve of nanoindentation test on C–S–H gel, which was generated from the loading history with an initial constantly increasing loading, followed by constant holding and then constantly decreasing loading. Two mechanical parameters can be simultaneously obtained from the initial slope of the elastic unloading in the load–depth curve.[Reference Pharr and Bolshakov14] The first one is indentation modulus, M, and the second one is hardness, H, as defined below:
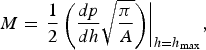 $$M={\left. {\displaystyle{1 \over 2}\left({\displaystyle{{dp} \over {dh}}\sqrt {\displaystyle{\pi \over A}} } \right)} \right\vert _{h={h_{\max }}}}\comma \; $$
 $$H={\left. {\left({\displaystyle{p \over A}} \right)} \right\vert _{h={h_{\max }}}}\comma \; $$
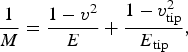
where p is the indentation load, h is the indentation depth, and h max is the maximum indentation depth. A is the projected contact area and can be extrapolated from the indentation depth h through Oliver and Pharr's method.[Reference Oliver and Pharr15] The indentation modulus, M, is related to the elastic modulus, E, and Poisson's ratio, v, of the local material through:
 $$\displaystyle{1 \over M}=\displaystyle{{1 - {v^2}} \over E}+\displaystyle{{1 - v_{{\rm tip}}^2 } \over {{E_{{\rm tip}}}}}\comma \; $$
where E tip is the elastic modulus of the indenter tip, and v tip is Poisson's ratio of the indenter tip. For the diamond tip used in this study, E tip and v tip have values 1141 GPa and 0.07, respectively. The hardness is related to the yield strength of the local material, whereas the hardness to yield strength ratio depends on the material type.[Reference Cheng and Cheng16] For example, for rigid cohesive plastic solids, Tabor suggested that the hardness-to-yield strength ratio, H/Y = 3.[Reference Tabor17] In the work of Cariou et al.,[Reference Cariou, Ulm and Dormieux18] for the cohesive-frictional porous materials, the relationship between hardness and yield strength was investigated through the micromechanical approach, where the limit analysis was used to achieve the relationship of the normalized hardness versus the packing density.
A typical load–depth curve of nanoindentation test.

Results and discussion
As an example, a grid of 400 indent impressions on the w/c = 0.40 hardened cement paste specimen is marked by triangles (enlarged in size for visibility) in the scanning electron microscope–backscattered electron (SEM–BSE) image, as shown in Fig. 2. The residual cement clinker, calcium hydroxide, inner product, and outer product are also indicated in Fig. 2.
SEM–BSE image of a typical zone showing a grid of N = 400 indent impressions (triangles, enlarged in size for visibility) in the w/c = 0.40 hardened cement paste.
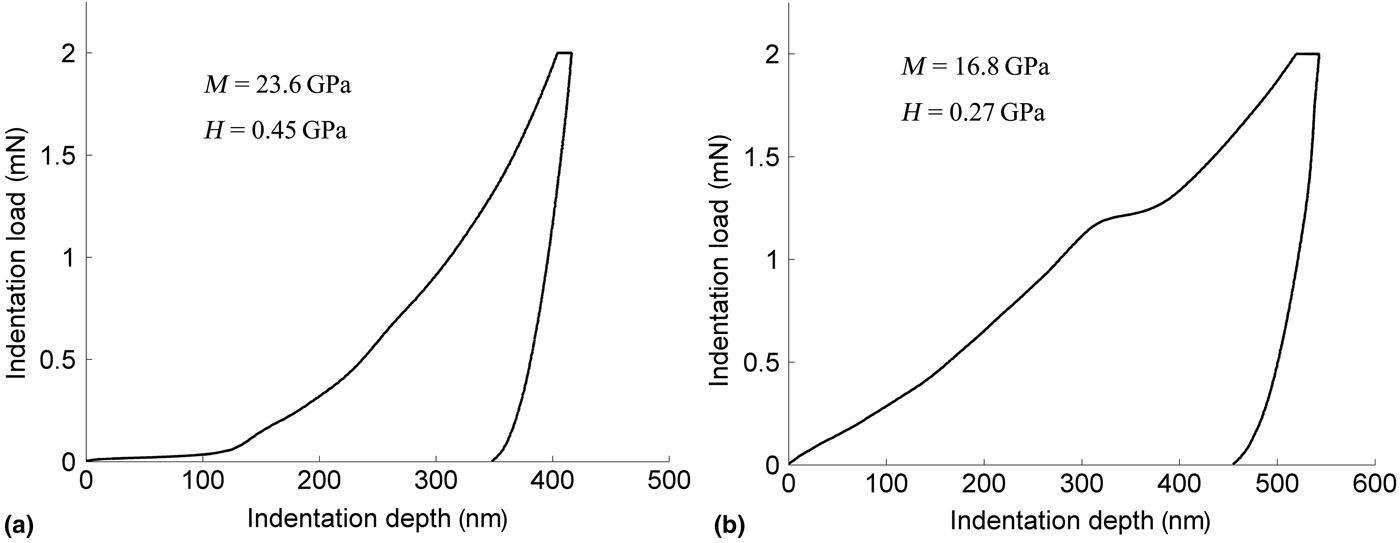
Before the analysis of nanoindentation data, the physically meaningless data stemming from the irregular indentation curves shown in Fig. 3 were eliminated. For instance, Fig. 3(a) shows a flat region at the beginning of the load–depth curve, which was caused by instable contact between the tip and the material surface at the initial loading process, that was a type of irregular appearance. Figure 3(b) shows another irregular appearance, a shoulder appearance (sudden jump or pop-in due to the fracture and collapse of surrounding solids) on the load–depth curve. Physically, the data produced by such irregular curves are meaningless and do not belong to any material phases.
Irregular load–depth curve representatives due to (a) instable contact between the tip and the material surface at the initial loading process, and (b) displacement sudden jump or pop-in.
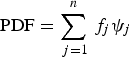
To obtain the microstructural mechanical information from grid dataset free of irregular curves, statistical analysis was used to analyze the nanoindentation data. The idea of statistical analysis is briefly introduced here. A large number of nanoindentation tests (i = 1,…,N) were performed on the microstructures of multiphase material composed of n material phases, where each phase occupied a volume fraction, f j (j = 1,…,n). The basic assumption is that the distribution of the in situ assessed mechanical parameters of each phase can be approximated by the normal distribution or Gaussian distribution, ψ j, specified with the mean value and SD. The theoretical probability density function (PDF) of nanoindentation data is formulated as:
 $$\hbox{PDF}=\sum\limits_{\,j=1}^n {{\,f_j}{\psi _j}} $$
and the volume fractions are constrained by:
 $$\sum\limits_{\,j=1}^n {{\,f_j}=1} .$$
Based on the finite Gaussian mixture model, the unknowns were estimated by maximum likelihood estimation through the application of expectation maximization algorithm,[Reference Dempster, Laird and Rubin19] and Bayes information criterion (BIC) was used to determine the number of components or phases.[Reference Schwarz20] The unknown parameters can be estimated by searching for parameters that maximize the likelihood function, or equivalently, log-likelihood function. BIC was calculated with the prescribed number of phases, n. The larger BIC indicated the stronger the evidence for the existence of material phases in the sample. In this study, the global optimization was searched for by running an iteration procedure for multiple trials with random starting values. Using such analysis method, for the w/c = 0.40 hardened cement paste, the dataset was classified into several groups according to the statistical analysis results. The scatter of indentation modulus and hardness was shown in Fig. 4(a). Accordingly, the map of the identified phases with location of irregular curves is shown in Fig. 4(b). By comparing the map of the identified phases in Fig. 4(b) and the SEM–BSE image in Fig. 2, it was noted that the interfaces of residual cement clinkers were classified into the group of calcium hydroxide. The third phase corresponds to calcium hydroxide or interface of cement clinker, rather than ultra-high-density phase. Thus, for the w/c = 0.40 hardened cement paste, the identified phases were recognized as outer product, inner product, calcium hydroxide (or interface of residual cement clinkers), and residual cement clinkers.
Grid nanoindentation on the w/c = 0.40 hardened cement paste: (a) deconvolution of the grid dataset free of irregular curves, (b) map of the identified phases with location of irregular curves.
For the cement paste at low water-to-cement ratio of 0.23, the nanoindentation results are shown in Fig. 5. As indicated in Fig. 5, for the low water-to-cement ratio = 0.23 hardened cement paste, the third phase is mainly the interface of residual cement clinkers rather than ultra-high-density phase.
Grid nanoindentation on the w/c = 0.23 hardened cement paste: (a) deconvolution of the grid dataset free of irregular curves, (b) map of the identified phases with location of irregular curves.
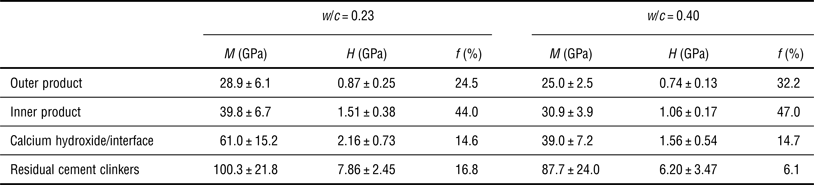
Finally, for the hardened cement pastes at the different water-to-cement ratios, the nanoindentation results of active individual phases are summarized in Table 1. From Table 1, it was noted that the mechanical properties of the outer product and the inner product present in w/c = 0.23 cement paste are different with those present in w/c = 0.40 cement paste. The previous study using nanoindentation implied that the mechanical properties of C–S–H do not depend on the mix proportions and curing condition, based on which a lot of multi-scale models were proposed to predict the macroscopic engineering performance of concrete and other cementitious materials.[Reference Constantinides and Ulm1, Reference Jiang, Zhang, Hu and Li21] However, as compared in Table 1, the nanoindentation results of this study showed the mechanical properties of hydration products, including outer product and inner product largely depended on the water-to-cement ratio. Meanwhile, it was noted that the average indentation modulus and hardness of residual cement clinkers present in the w/c = 0.40 cement paste are lower than those present in the w/c = 0.23 cement paste, and much lower than those of synthetic cement clinkers reported in Velez et al.[Reference Velez, Maximilien, Damidot, Fantozzi and Sorrentino22] The difference can be explained by the effect of porosity, as the similar phenomenon was also noted by Velez et al.[Reference Velez, Maximilien, Damidot, Fantozzi and Sorrentino22] using nanoindentation to study the mechanical properties of synthetic cement clinkers.
The average nanoindentation modulus M, hardness H (mean ± SD) and volume fraction f of active phases involved in hardened cement pastes
Concluding remarks
Through this study, the mechanical properties of active phases involved in hardened cement pastes at different water-to-cement mass ratios were measured and mapped through the application of grid nanoindentation and statistical analysis. The results obtained from this work suggested that nanoindentation can be used as an effective tool to measure and map mechanical properties of cement paste and can identify the phases include outer product, inner product, calcium hydroxide (or interface of residual cement clinkers), and residual cement clinkers. Meanwhile, the results showed that the mechanical properties of hydration products largely depended on the water-to-cement ratio.
Acknowledgments
The financial supports from Hong Kong Research Grant Council under Grant 615412 and China Ministry of Science and Technology under Grant 2015CB655100 are gratefully acknowledged.