


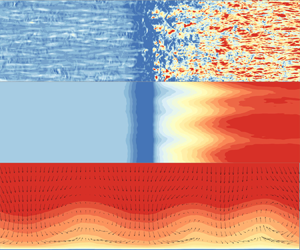



1. Introduction
Shock wave/turbulent boundary layer interactions (SWTBLIs) occur widely in supersonic/hypersonic internal and external flows, and have received a considerable amount of research attention in the past few decades due to their practical importance in the aeronautical and aerospace industries. Shock wave/turbulent boundary layer interactions are capable of inducing complex flow phenomena (such as unsteady shock motions, turbulence amplification, severe wall skin friction and heat flux), which may result in increased flight drag as well as thermal and structural failure of high-speed flight vehicles. In consequence, it is of importance, in order to alleviate these detrimental effects, to achieve a comprehensive understanding of these flow features and underlying mechanisms.
Wall skin friction  $C_f$ can have a significant impact on the flight drag and aerodynamic performance. When a supersonic/hypersonic turbulent boundary layer encounters the impinging shock or compression ramp,
 $C_f$ tends to first drop at high speed caused by the negative pressure gradient arising from the shock wave and then appears to increase in the reattached boundary layer. Pasquariello, Hickel & Adams (Reference Pasquariello, Hickel and Adams2017) conducted large-eddy simulation (LES) of supersonic impinging SWTBLI flows, and the results revealed that
 $C_f$ downstream of the reattachment point exhibited a rapid increase, exceeding two times that in the upstream undisturbed turbulent boundary layer. Compared with supersonic SWTBLIs, the amplification of
 $C_f$ in hypersonic (here referring to flows with a Mach number no less than 6.0) SWTBLIs appears to be much more severe. Guo et al. (Reference Guo, Zhang, Tong and Li2023) conducted direct numerical simulation (DNS) of a turbulent boundary layer over a
 $30^{\circ }$ compression ramp at Mach 6.0. With the streamwise evolution,
 $C_f$ on the compression ramp tended to increase at a high speed and the maximum
 $C_f$ was more than 6 times that in the flat-plate turbulent boundary layer. Helm & Martín (Reference Helm and Martín2022) carried out LES of a turbulent boundary layer over a
 $24^{\circ }$ compression ramp at Mach 10. They found that the amplification of
 $C_f$ was up to 11.0, while at the same compression ramp angle at Mach 2.9, the amplification factor was around 2.0. Their simulation results also revealed that the root mean square of
 $C_f$ presented a significant increment with the amplification factor, exceeding 21.0. Generally, the existing studies focusing on
 $C_f$ in hypersonic SWTBLIs are still limited, and most of them solely show its streamwise distribution. The underlying mechanism for the amplification of
 $C_f$ and its rapid increase in the interaction region remains unclear, and this provides the motivation for the present work. In addition, the impact of the typical flow features such as the detached shear layer, turbulence amplification and Görtler-like vortices on
 $C_f$ will be investigated.
To explore the physical mechanisms of drag generation, a large amount of research work has been performed to establish an explicit relation between  $C_f$ (commonly obtained via an integration of the surface shear stress) and the spatial distributions of the flow statistics (Fukagata, Iwamoto & Kasagi Reference Fukagata, Iwamoto and Kasagi2002; Renard & Deck Reference Renard and Deck2016; Li et al. Reference Li, Fan, Modesti and Cheng2019; Tong, Sun & Li Reference Tong, Sun and Li2021; Guo et al. Reference Guo, Fang, Zhong and Moulinec2022; Xu, Wang & Chen Reference Xu, Wang and Chen2022; Xu, Ricco & Duan Reference Xu, Ricco and Duan2023a) through appropriate integration of the Navier–Stokes equation. Fukagata et al. (Reference Fukagata, Iwamoto and Kasagi2002) proposed a momentum-based drag decomposition method (denoted as the FIK method hereafter), which established an explicit expression between the drag coefficient and the spatial distributions of the Reynolds shear stresses and could be used to quantify the contribution arising from the Reynolds stress to
 $C_f$. This approach is capable of providing some new insights into the physical mechanisms of drag generation, and has been applied in wall-bounded turbulence analysis and flow control, such as uniform wall blowing/suction (Kametani & Fukagata Reference Kametani and Fukagata2011), spanwise wall oscillation (Yao, Chen & Hussain Reference Yao, Chen and Hussain2019) etc. One drawback of the FIK method is that there is no physics-informed explanation for the three successive integrations and the resultant linearly weighted Reynolds shear stress. To improve this drawback, Wenzel, Gibis & Kloker (Reference Wenzel, Gibis and Kloker2022) and Xu et al. (Reference Xu, Wang and Chen2022) suggested applying twofold repeated integrations instead of triple integrals, where the first integration presented the force balance between the wall surface and any wall-normal stations in the fluid domain and the second one denoted its average along the wall-normal direction. The resultant Reynolds shear stress is no longer related to the distance away from the wall, but unfortunately, the linearly weighted mean-convection and spatial-development terms are included. Based on the modified FIK method, Xu et al. (Reference Xu, Wang and Chen2022) analysed
 $C_f$ in hypersonic transitional and turbulent boundary layers. They found that the overshoot of
 $C_f$ was dominated by the sharp change of the mean velocity profiles, especially the strong negative streamwise gradient of the mean streamwise velocity far from the wall.
Another promising drag decomposition method is derived based on the incompressible mean streamwise kinetic energy budget by Renard & Deck (Reference Renard and Deck2016) (denoted as the RD method hereafter). They decomposed  $C_f$ into contributions from mean molecular viscous dissipation, production of turbulent kinetic energy (TKE) and spatial growth of the flow. This energy-based method is physically appealing, and gives an improved physical interpretation for each component of
 $C_f$. Renard & Deck (Reference Renard and Deck2016) employed this method in the turbulent boundary layer to explore the impact of Reynolds number on the generation of
 $C_f$. Li et al. (Reference Li, Fan, Modesti and Cheng2019) extended this method to compressible flow and investigated the influence of density and viscosity on the skin friction of the supersonic turbulent channel and zero-pressure-gradient turbulent boundary layers (Fan, Li & Pirozzoli Reference Fan, Li and Pirozzoli2019). Yu et al. (Reference Yu, Dong, Liu, Tang, Yuan and Xu2023) performed DNS of impinging SWTBLIs at Mach 2.28 and applied the RD method to analyse the generation mechanism of
 $C_f$. Their results indicated that, in the upstream boundary layer,
 $C_f$ was mainly contributed by mean viscous dissipation and TKE production; as the flow entered the interaction zone, the contribution from the advection term was also significantly enhanced. Duan et al. (Reference Duan, Tong, Li and Liu2023) applied the extended RD method in impinging SWTBLI flows with two different incident angles of
 $33.2^{\circ }$ and
 $28^{\circ }$ at Mach 2.25. The decomposition results indicated that, for the
 $33.2^{\circ }$ case, the contribution from mean viscous dissipation is significantly decreased in the interaction region, owing to the flow separation. By contrast, the contribution from TKE production was strengthened in both cases, which is consistent with the turbulence amplification reported in the interaction region (Dupont, Piponniau & Dussauge Reference Dupont, Piponniau and Dussauge2019; Fang et al. Reference Fang, Zheltovodov, Yao, Moulinec and Emerson2020; Guo et al. Reference Guo, Zhang, Tong and Li2023).
The existence of streamwise Görtler-type vortices on compression ramps has been reported (Loginov, Adams & Zheltovodov Reference Loginov, Adams and Zheltovodov2006; Grilli, Hickel & Adams Reference Grilli, Hickel and Adams2013; Roghelia et al. Reference Roghelia, Olivier, Egorov and Chuvakhov2017; Cao, Klioutchnikov & Olivier Reference Cao, Klioutchnikov and Olivier2019), caused by the curvature of the streamlines and the resultant centrifugal instability. It is known that Görtler-type vortices can produce spanwise periodic variation of the flow field and hence the wall heat flux (Roghelia et al. Reference Roghelia, Olivier, Egorov and Chuvakhov2017; Cao et al. Reference Cao, Klioutchnikov and Olivier2019) and skin friction (Loginov et al. Reference Loginov, Adams and Zheltovodov2006). Loginov et al. (Reference Loginov, Adams and Zheltovodov2006) carried out LES of a turbulent boundary layer over a  $25^{\circ }$ compression ramp at Mach 2.95. Their simulation results showed that
 $C_f$ on the ramp wall had spanwise variations of up to 50 % with respect to the spanwise-averaged value. Therefore, it is of importance to consider the spanwise non-homogeneity when studying the skin friction on the compression ramp.
In this paper, a hypersonic SWTBLI over a  $24^{\circ }$ compression ramp at Mach 6.0 is studied using DNS. The objectives of this present study are: (i) to explore the underlying mechanism for the amplification of
 $C_f$ and its rapid increase on the compression ramp; (ii) to provide an insight with regard to the spanwise non-homogeneity of wall skin friction and its fluctuation on the compression ramp. To address these issues, the RD method will be applied, which enables us to find out the prominent flow features (such as the detached shear layer, turbulence amplification, Görtler-type vortices, flow compression and negative pressure gradient) that contribute to the amplification of
 $C_f$ and its spanwise non-homogeneity on the compression ramp. Note that Renard & Deck (Reference Renard and Deck2016) and Li et al. (Reference Li, Fan, Modesti and Cheng2019) decomposed the skin friction based on a two-dimensional Reynolds-averaged momentum equation under the hypothesis that the flow field is spanwise uniform. Therefore, it is not rigorous to apply the existing RD method to analyse
 $C_f$ on the compression ramp. To enable it to be used in three-dimensional spanwise periodic flow (i.e. flow on the compression ramp), we propose to extend the RD method to include the effects of spanwise non-homogeneity by employing the three-dimensional Reynolds-averaged momentum equation.
The rest of this paper is organized in the following way. In § 2, the computational domain, numerical schemes and validation of the results are described. Section 3 presents the results and discussions, including the basic flow phenomena in SWTBLIs, distribution of wall skin friction and its premultiplied spanwise energy spectrum and skin friction decomposition. Conclusions are drawn in § 4.
2. Methodology
2.1. Computational domain and set-up
The present study is undertaken in a hypersonic turbulent boundary layer over a  $24^{\circ }$ compression ramp, as seen in figure 1. The coordinate system adopted is shown with its origin located at the compression corner. The streamwise, vertical and spanwise directions are denoted by
 $x$,
 $y$ and
 $z$, respectively. The corresponding velocity components are
 $u$,
 $v$ and
 $w$, respectively. The streamwise length and vertical height of the computational domain are
 $L=96\delta _{ref}$ and
 $H=5.5\delta _{ref}$, where
 $\delta _{ref}=10$ mm is the flat-plate turbulent boundary layer thickness at
 $x=-3\delta _{ref}$ and is used as the reference length in this paper. The spanwise width
 $W$ is
 $3.0\delta _{ref}$, or
 $6.0\delta _{ref}$ depending on the case, and will be described later. Apart from the coordinate system (
 $x, y, z$), an additional coordinate (
 $x_*, y_*, z$) is also introduced, where
 $x_*$ is along the wall and
 $y_*$ is perpendicular to the wall surface pointing away from the wall. Throughout this paper, the Reynolds and Favre averages for a general variable
 $\psi$ are denoted by
 $\bar {\psi }$ and
 $\tilde {\psi }$, and the corresponding fluctuating components are
 $\psi '=\psi -\bar {\psi }$ and
 $\psi ''=\psi -\tilde {\psi }$, respectively.
Sketch of the computational domain with its size. Here,  $\delta _{ref}$ is the flat-plate turbulent boundary layer thickness at
 $x=-3\delta _{ref}$. Mesh distribution in the
 $x\unicode{x2013}y$ plane is presented, where the grid point is plotted every 20th grid line in each direction.

The incoming Mach number  $Ma_{\infty } = 6.0$, temperature
 $T_{\infty } = 110.0\ {\rm K}$ and Reynolds number with unit length
 $Re_{\infty }=\rho _{\infty }U_{\infty }/\mu _{\infty }=20\,000\ {\rm {mm}}^{-1}$, where
 $\rho _{\infty }$,
 $U_{\infty }$ and
 $\mu _{\infty }$ are the incoming density, velocity and dynamic viscosity, respectively. The Reynolds number
 $Re_\theta$ at
 $x=-3\delta _{ref}$ based on the momentum thickness
 $\theta$ (
 $\theta /\delta _{ref}=0.041$) of the turbulent boundary layer is 8200. The corresponding friction Reynolds number
 $Re_{\tau }=\bar {\rho }_w \bar {u}_{\tau } \delta _{ref}/\bar {\mu }_w=470$, where
 $\bar {\rho }_w$,
 $\bar {u}_{\tau }$ and
 $\bar {\mu }_w$ denote the mean density, friction velocity and dynamic viscosity at the wall. The length quantity non-dimensionalized with
 $\bar {u}_{\tau }$ and the viscous length scale (
 $\delta _{v}=\bar {\mu }_w/(\bar {\rho }_w \bar {u}_{\tau })=\bar {\mu }_w/\sqrt {\bar {\rho }_w \bar {\tau }_w}$) are denoted with the superscript
 $+$. As such,
 $Re_{\tau }$ represents the ratio of outer to viscous length scales, namely
 $Re_{\tau }=\delta _{ref}/\delta _{v}$.
With regard to the boundary condition of the computational domain, a supersonic outflow boundary is specified at the upper far-field surface and outlet, combined with a progressively coarsened grid size. The no-slip and isothermal boundary condition is employed at the wall with  $T_w/T_{\infty }=5.6$, approximately 0.75 times the adiabatic wall recovery temperature. In the spanwise direction periodicity is specified. A steady laminar compressible boundary layer profile is imposed at the inlet, calculated by the auxiliary simulation of a laminar boundary layer with the same incoming conditions and wall temperature. To trigger the laminar–turbulent transition, wall blowing and suction perturbations (Pirozzoli, Grasso & Gatski Reference Pirozzoli, Grasso and Gatski2004) are applied in the region from
 ${x_A=-84.5\delta _{ref}}$ to
 $x_B=-76.5\delta _{ref}$ (see the orange colour in figure 1). The formula of the wall blowing and suction is expressed as
 \begin{equation} v_{bs}=A_{bs}\,f_{bs}(x)g_{bs}(z)h_{bs}(t), \end{equation}
where  $A_{bs}$ represents the perturbation intensity, and
 $A_{bs}=0.05U_{\infty }$;
 $f_{bs}(x)$,
 $g_{bs}(z)$ and
 $h_{bs}(t)$ define the variations with regard to the streamwise direction, spanwise direction and time, respectively, and their expressions are given as
 \begin{equation} \left.\begin{gathered} f_{bs}(x)=4 \sin(\theta)[1-\cos(\theta)]/\sqrt{27},\quad\theta=10{\rm \pi}(x-x_A)/(x-x_B) \\ g_{bs}(z)=\sum_{n=1}^{13}Z_n \sin[2{\rm \pi} n(z/W+\phi_n)],\quad\sum_{n=1}^{13}Z_n=1,\ Z_n=1.25Z_{n+1} \\ h_{bs}(t)=\sum_{m=1}^{4}T_m \sin[2{\rm \pi} m(\beta t+\psi_m)],\quad\sum_{m=1}^{4}T_m=1,\ T_m=1.25T_{m+1}, \end{gathered}\right\} \end{equation}
where  $\phi _n$ and
 $\psi _m$ are random numbers ranging from 0 to 1,
 $\beta$ denotes the basic frequency and
 $\beta =0.35U_{\infty }/\delta _{ref}$. The wall fluctuations have thirteen spatial modes in the spanwise direction and four temporal modes.
Three DNS cases are conducted in the present study, as shown in table 1, where the latter two cases are performed for the grid- and domain-sensitivity study to assess the grid resolution and the domain extent in the spanwise direction. The mesh distribution for the baseline case in the  $x{-}y$ plane is shown in figure 1, where the mesh is plotted every 20th grid line in each direction for the convenience of visualization. The grid resolution in the streamwise direction is also included in the main sections of the domain, and the superscript ‘
 $+$’ indicates the inner scale, calculated by the wall units at
 $x/\delta _{ref}=-3$. In the spanwise direction the mesh spacing is constant, while along the wall-normal direction, the grid size tends to increase with a constant ratio.
Domain width and mesh information for DNS cases. Here,  $\Delta x^+$ reveals the grid size of the three streamwise sections in figure 1.

2.2. Numerical scheme
In the present DNS, an in-house high-order finite difference code (OpenCFD-SC) (Duan et al. Reference Duan, Li, Li and Liu2021; Dang et al. Reference Dang, Liu, Guo, Duan and Li2022; Xu, Wang & Chen Reference Xu, Wang and Chen2023b) is applied, and it has been used successfully in many supersonic/hypersonic SWTBLI studies (Zhu et al. Reference Zhu, Yu, Tong and Li2017; Duan et al. Reference Duan, Li, Li and Liu2021; Tong et al. Reference Tong, Duan, Lai, Sun and Yuan2023). The DNS code solves the three-dimensional unsteady compressible Navier–Stokes equations in a generalized coordinate system via the high-order finite difference method. The inviscid fluxes are discretized by a hybrid difference scheme, and the pressure-based shock sensor by Jameson, Schmidt & Turkel (Reference Jameson, Schmidt and Turkel1981) is deployed to distinguish the smooth and non-smooth flow fields. For the smooth continuously varying flow field, seventh-order upwind discretization is used to ensure the resolving accuracy. In contrast, the seventh/fifth-order weighted essentially non-oscillatory scheme is applied around the region with high pressure gradient, e.g. the shock wave, to preserve the high robustness. For the viscous fluxes, the eighth-order central difference scheme is used, and for the time marching, the third-order total-variation-diminishing Runge–Kutta scheme is applied.
2.3. Validation of the numerical method
The profile of the mean van Driest transformed streamwise velocity at the reference station  $x/\delta _{ref}=-3$ is presented in figure 2(a). It is clear that the present result compares well with the DNS data by Zhang, Duan & Choudhari (Reference Zhang, Duan and Choudhari2018), and is consistent with the classic law of the wall in the logarithmic region of
 $30< y^+ <100$, indicating that the flow has reached the fully developed turbulence. Figure 2(b) presents the profiles of the mean van Driest transformed Reynolds stress at
 $x/\delta _{ref}=-3$. One can see that the present results reveal a high consistency with those from Zhang et al. (Reference Zhang, Duan and Choudhari2018) and Wu & Moin (Reference Wu and Moin2009), verifying that the present computational method is adequate.
Profiles of (a) the mean van Driest transformed streamwise velocity and (b) the density-scaled Reynolds stress profiles at the reference station  $x/\delta _{ref}=-3$. Here,
 $y^+= y\bar {u}_{\tau }/\bar {\nu }_w$;
 $\bar {u}_{vd}^+={1}/{\bar {u}_{\tau }} \int _{0}^{\bar {u}}\sqrt {\bar {\rho }/\bar {\rho }_w} \,\textrm {d}\bar {u}$.

To assess the mesh resolution and the spanwise domain extent, figure 3 compares the streamwise distribution of the mean wall shear stress  $\bar {\tau }_w$ and pressure
 $\bar {p}_w$ as well as the root-mean-square (r.m.s.) of the wall shear stress
 ${\bar {\tau }}_{w,rms}=\sqrt {\overline {{\tau '}_w^2}}$ and
 $\overline {{p'}_w{p'}_w}$ in the vicinity of the compression ramp. Among the three cases, it is clear that no distinguishable differences exist apart from
 $\bar {\tau }_w$ and
 ${\bar {\tau }}_{w,rms}$ downstream of the compression corner, where the relative maximum errors are less than 6 % and 7 %, respectively. In consequence, the grid size and spanwise domain extent of the baseline case are considered to be sufficient for resolving the flow field with great accuracy.
Streamwise distribution of the wall shear stress and pressure around the compression corner.(a) The mean wall shear stress  ${\bar {\tau }}_w$ and
 ${\bar {\tau }}_{w,rms}=\sqrt {\overline {{\tau '}_w^2}}$; (b) the mean wall pressure
 ${\bar {p}}_w$ and
 $\overline {p'_wp'_w}$.

3. Results and discussion
3.1. Instantaneous and mean flow characteristics
In this section, the flow field in the SWTBLI zone is examined to obtain a first impression of the flow characteristics. The contour of the instantaneous numerical schlieren  ${DS=0.8}\exp [-10(|\boldsymbol {\nabla }\rho |)/|\boldsymbol {\nabla }\rho |_{max}]$ (Priebe & Martín Reference Priebe and Martín2021) in the
 $x$–
 $y$ section at
 $z/\delta _{ref}=1.0$ and
 $z/\delta _{ref}=2.0$ is shown in figure 4. The region with darker colour indicates that the local fluid density gradient is higher. Downstream of the compression corner, the shock wave can be clearly observed. Owing to the high free-stream Mach number, the shock angle appears to be small so that the shock around the compression corner is embedded in the turbulent boundary layer. As a result, the shock front nearby appears to be distorted by the turbulent structures.
Contour of the instantaneous numerical schlieren in the  $x$–
 $y$ section at (a)
 $z/\delta _{ref}=1.0$ and(b)
 $z/\delta _{ref}=2.0$.

Figure 5(a) shows the instantaneous turbulent structures using the iso-surfaces of the second invariant of the velocity gradient tensor  ${Q\equiv 0.2}$, coloured by the streamwise vorticity
 $\omega _x={\partial w}/{\partial y}-{\partial v}/{\partial z}$. In the flat-plate turbulent boundary layer, the turbulent structures appear as streamwise vortices, and behave like the leg of horseshoe vortices. They are randomly distributed close to the wall's surface (Humble, Scarano & Van Oudheusden Reference Humble, Scarano and Van Oudheusden2009; Fang et al. Reference Fang, Zheltovodov, Yao, Moulinec and Emerson2020), and their rotation direction can be obtained via the sign of
 $\omega _x$. As the flow approaches the interaction region, abundant vortical structures are produced with larger length scales, arising from the mixing layer (Fang et al. Reference Fang, Zheltovodov, Yao, Moulinec and Emerson2020). The instantaneous iso-surface of
 $Q\equiv 0.6$ is shown in figure 5(b) to focus on the coherent structures downstream of the compression corner. One can see that as the flow develops downstream away from the interaction region from
 $x/\delta _{ref}=2.0$, the enhancement of the turbulent vortical structures caused by the SWTBLIs decreases gradually.
Instantaneous turbulent coherent structures visualized using the iso-surfaces of (a)  $Q\equiv 0.2$ and(b)
 $Q\equiv 0.6$. The iso-surfaces are coloured by the instantaneous streamwise vorticity
 $\omega _x$.

The contours of the spanwise-averaged mean streamwise velocity in the  $x{-}y$ plane around the compression ramp is shown in figure 6. The blue line reveals the wall-normal location where the mean pressure gradient
 $|\boldsymbol {\nabla }\bar {p}|$ achieves the maximum value at each streamwise point, denoting the shock wave position. As the flow approaches the compression ramp, the streamwise velocity in the near-wall region tends to decrease significantly, caused by the negative pressure gradient. The pink line near the compression corner is the iso-line of
 $\bar {u}/ U_{\infty}= 0$, and the mean reverse flow occurs below this line, resulting in a small and thin separation region. With the further evolution of the flow, the streamwise velocity tends to increase at a high speed.
Contours of the spanwise-averaged mean streamwise velocity superimposed with the streamlines in the  $x$–
 $y$ plane. The pink line denotes the iso-line of
 $\bar {u}/ U_{\infty}= 0$; the blue line denotes the local peak of mean pressure gradient
 $|\boldsymbol {\nabla }\bar {p}|$ along the
 $y$ direction at each streamwise point.

3.2. Spanwise-averaged wall shear stress
From figure 3(a), one can see that, as the flow approaches the interaction zone, the spanwise-averaged mean wall shear stress  $\bar {\tau }_w$ appears to decrease sharply, caused by the adverse pressure gradient (figure 3b). The separation point (
 $x_s$) and reattachment point (
 $x_r$) are defined as the left and right streamwise locations of zero
 $\bar {\tau }_w$, and they are located at
 $x=-0.5\delta _{ref}$ and
 $x=0.1\delta _{ref}$, respectively. The length of the separation zone
 $L_s$ is the streamwise length between
 $x_s$ and
 $x_r$, and
 $L_s=x_r-x_s=0.6\delta _{ref}$. Downstream of this compression corner, the value of
 $\bar {\tau }_w$ appears to increase until
 $x/\delta _{ref}=5.0$, and then tends to decrease gradually. It is noteworthy that the peak value of
 $\bar {\tau }_w$ at
 $x/\delta _{ref}=5.0$ exceeds by 5.2 times that of the flat-plate turbulent boundary layer at
 $x/\delta _{ref}=-3.0$.
The root-mean-square value of wall shear stress fluctuation,  $\bar {\tau }_{w,rms}$, is presented in figure 7(a). The dashed lines denote the streamwise position of the separation and reattachment points. As the flow enters the interaction region, the intensity of
 $\bar {\tau }_{w,rms}$ is significantly increased, and the maximum value is obtained at
 $x/\delta _{ref}=3.0$, approximately 6.0 times that at
 $x/\delta _{ref}=-3.0$. Apart from the global maximum point of
 $\bar {\tau }_{w,rms}$, there exist two other local peaks, located around the separation and reattachment points. These local peaks have been reported in the study of the wall pressure fluctuations (Dolling Reference Dolling1993; Loginov et al. Reference Loginov, Adams and Zheltovodov2006; Wu & Martin Reference Wu and Martin2007; Pasquariello et al. Reference Pasquariello, Hickel and Adams2017). The former local peak is a consequence of the unsteady shock-foot motion (Dolling Reference Dolling1993; Loginov et al. Reference Loginov, Adams and Zheltovodov2006). In the present paper, the separation length (0.6
 $\delta _{ref}$) is small and the resultant shock-foot motion is expected to be weak. Consequently, only a very small peak of
 $\tau _{w,rms}$ is observed near the separation point. As the separation bubble expands and contracts, the instantaneous reattachment point moves up and down along the ramp surface, contributing to the large fluctuations of the flow field and hence the local peak of the
 $\tau _{w,rms}$ and wall pressure fluctuations (Dolling Reference Dolling1993).
Streamwise distribution of the root-mean-square value of the shear stress fluctuation normalized by (a)  $\rho _{\infty } U_{\infty }^2$ and (b)
 $\bar {\tau }_w$. The vertical dashed lines denote the streamwise position of the separation and reattachment points.

The streamwise distribution of  $\bar {\tau }_{w,rms}$ normalized by the local
 $\bar {\tau }_w$ is plotted in figure 7(b). In the undisturbed turbulent boundary layer,
 $\bar {\tau }_{w,rms}/\bar {\tau }_w=0.41$. This is consistent with the experimental result (Willert Reference Willert2015) and DNS data (Diaz-Daniel, Laizet & Vassilicos Reference Diaz-Daniel, Laizet and Vassilicos2017; Yu et al. Reference Yu, Liu, Fu, Tang and Yuan2022). As the flow develops in the streamwise direction,
 $\bar {\tau }_{w,rms}/\bar {\tau }_w$ tends to increase sharply, owing to increased
 $\bar {\tau }_{w,rms}$ and decreased wall skin friction. In the region between the separation and reattachment points,
 $\bar {\tau }_{w,rms}/\bar {\tau }_w$ is negative and is not shown in this figure. Downstream of the reattachment point,
 $\bar {\tau }_{w,rms}/\bar {\tau }_w$ tends to decrease from a very large value, and gradually approaches the value observed in the upstream flat-plate turbulent boundary layer.
Schlatter & Örlü (Reference Schlatter and Örlü2010) proposed that  $\bar {\tau }_{w,rms}$ followed a logarithmic–linear law with
 $Re_{\tau }$, i.e.
 $\bar {\tau }_{w,rms}/\bar {\tau }_w=0.298+0.018 \ln Re_{\tau }$, which has been widely accepted in turbulent boundary flows (Mathis et al. Reference Mathis, Marusic, Chernyshenko and Hutchins2013; Willert Reference Willert2015; Diaz-Daniel et al. Reference Diaz-Daniel, Laizet and Vassilicos2017; Huang, Duan & Choudhari Reference Huang, Duan and Choudhari2022; Yu et al. Reference Yu, Liu, Fu, Tang and Yuan2022). The solid circle symbol in figure 7(b) denotes the results calculated by the empirical formula. One can see that the present DNS data in the undisturbed turbulent boundary layer agree well with the empirical correlations. In contrast, the resulting comparison shows an obvious difference on the compression ramp, indicating that the empirical formula is not suitable in the interaction region.
3.3. Spanwise heterogeneity of wall shear stress
Figure 8(a) shows the instantaneous wall shear stress. Upstream of the interaction region,  $\tau _{w}$ appears to be organized as streamwise elongated streaky structures, caused by the near-wall quasi-streamwise vortices that lead to the spanwise alternating high- and low-momentum regions. This is consistent with the turbulent structures visualized in figure 5(a). As the flow approaches the interaction region, the streamwise streaky structures are destroyed and instead
 $\tau _{w}$ behaves like the footprint of three-dimensional structures. It appears that the high
 $\tau _{w}$ accumulates at some spanwise positions, leading to spanwise heterogeneity with a spanwise length of approximately
 $\delta _{ref}$. This flow phenomenon may result from Görtler vortices caused by the concave curvature streamlines over the corner. With the further development from
 $x/\delta _{ref}=3$, the streamwise elongated streaky structures regenerate and gradually begin to dominate the flow field. Compared with the upstream flat-plate boundary layer,
 $\bar {\rho }_w$ and
 $\bar {\tau }_w$ downstream of the compression corner are significantly increased, and hence the viscous length (
 $\delta _{v}=\bar {\mu }_w/\sqrt {\bar {\rho }_w \bar {\tau }_w}$) is expected to have an apparent decrease. Consequently, the characteristic spanwise length of
 $\tau _{w}$ normalized by the outer scale
 $\delta _{ref}$ is much smaller than that in the undisturbed turbulent boundary layer.
Contour of the (a) instantaneous and (b) mean wall shear stress. The blue dashed and dash-dotted lines denote the spanwise station for the maximum and minimum  $\bar {\tau }_w$.

The mean wall shear stress is presented in figure 8(b), and the spanwise statistically homogeneous  $\bar {\tau }_w$ is observed in the undisturbed boundary layer. In comparison, an obvious spanwise heterogeneity of
 $\bar {\tau }_w$ scaled with
 $\delta _{ref}$ can be seen on the compression ramp, caused by the upwash/downwash of the large-scale streamwise vortex structures, arising from the Görtler-like vortices. This large-scale spanwise non-homogeneity has also been observed in the interaction region in the earlier studies (Loginov et al. Reference Loginov, Adams and Zheltovodov2006; Grilli et al. Reference Grilli, Hickel and Adams2013; Roghelia et al. Reference Roghelia, Olivier, Egorov and Chuvakhov2017; Cao et al. Reference Cao, Klioutchnikov and Olivier2019).
Further evidence of the presence of Görtler-like structures is shown in figure 9, which gives the contour of  $\bar {u}_*$ superimposed with in-plane velocity vectors (
 $\bar {v}_*, \bar {w}$) in the
 $y_*{-}z$ plane that is perpendicular to the ramp wall at
 $x/\delta _{ref}=4$. It is clear that the secondary flow motions characterized by streamwise rotating vortices are generated, where the solid dot symbol indicates the centre of the vortex. The downwelling motions are capable of transporting the high-momentum fluid toward the wall, coinciding with high shear stress regions (dashed blue lines in figure 8b). Conversely, relatively low
 $\bar {\tau }_w$ regions are found where the upwelling motions are induced. A similar phenomenon has also been found for the surface patterns with spanwise heterogeneity, e.g. alternating roughness strips (Wangsawijaya et al. Reference Wangsawijaya, Baidya, Chung, Marusic and Hutchins2020), variation in wall shear (Chung, Monty & Hutchins Reference Chung, Monty and Hutchins2018), periodically elevated elements (Medjnoun, Vanderwel & Ganapathisubramani Reference Medjnoun, Vanderwel and Ganapathisubramani2018) etc.
Contours of streamwise velocity superimposed with in-plane velocity vectors in the  $y_*{-}z$ plane at
 $x/\delta _{ref}=4$. The dot symbol indicates the vortex centre; the blue dashed and dash-dotted lines denote the spanwise station for the maximum and minimum
 $\bar {\tau }_w$.

To reveal the streamwise evolution of the intensity of the Görtler-like vortices, the streak amplitude  $A_u$, following the definition by Andersson et al. (Reference Andersson, Brandt, Bottaro and Henningson2001) and Ren & Fu (Reference Ren and Fu2015), is introduced and expressed as
 \begin{align} A_{u}(x)=\frac{1}{2U_{\infty}} \max_{y_*}[\Delta \tilde{u}_*(y_*)],\quad\mbox{where}\ \Delta \tilde{u}_*(y_*)=\max_{z}[\tilde{u}_*(y_*,z)]- \min_{z}[ \tilde{u}_*(y_*,z)]. \end{align}
One can see that  $A_u$ is related to the maximum streamwise velocity difference across the spanwise direction, arising from the upwash/downwash of the Görtler-like vortices. Figure 10 shows the streamwise evolution of the streak amplitude
 $A_u$ normalized by
 $U_{\infty }$. On the compression ramp wall, the amplitude
 $A_u$ appears to increase first and reaches a maximum value of 0.084 at
 $x/\delta _{ref}=0.75$. Such a large amplitude contributes to an apparent spanwise variation of the mean wall shear stress
 $\bar {\tau }_w$, as seen in figure 8(b). Then,
 $A_u$ tends to decease gradually and the value decreases to 0.022 at
 $x/\delta _{ref}=6.0$, where the spanwise heterogeneity of
 $\bar {\tau }_w$ is much less compared with that at
 $x/\delta _{ref}=0.75$.
Streamwise evolution of the streak amplitude  $A_u$ normalized by
 $U_{\infty }$.

3.4. Spectra of the wall shear stress
To analyse how the wall shear stress fluctuation is distributed across the spanwise wavenumber ( $\kappa _z$), the premultiplied spanwise energy spectrum of
 $\tau '_{w}$,
 ${\kappa _z E_{\tau '_w \tau '_w}}/{\bar {\tau }^2_{w,rms}}$, is presented in figure 11 as a function of the streamwise coordinate and spanwise wavelength (
 $\lambda _z=1/\kappa _z$). The profiles of
 ${\kappa _z E_{\tau '_w \tau '_w}}/{\bar {\tau }^2_{w,rms}}$ at several streamwise positions are also given in figure 12 for quantitative comparison.
Contours of the premultiplied spanwise energy spectra of  $\tau '_{w}$,
 ${\kappa _z E_{\tau '_w \tau '_w}}/{\bar {\tau }^2_{w,rms}}$, in the vicinity of the interaction region.

Profiles of  ${\kappa _z E_{\tau '_w \tau '_w}}/{\bar {\tau }^2_{w,rms}}$ at several streamwise positions.

In the undisturbed flat-plate region,  ${\kappa _z E_{\tau '_w \tau '_w}}/{\bar {\tau }^2_{w,rms}}$ peaks at
 $\lambda _z=0.2\delta _{ref}$, and the corresponding inner scale is
 $\lambda _z^+ \approx 100$, the characteristic length scale of streak spacing in canonical wall-bounded turbulence. By observing the spanwise scales of the streamwise elongated streaky structures in figure 8(a), one can infer that it is the near-wall streak structures that dominate the most energetic wavelength of
 ${\kappa _z E_{\tau '_w \tau '_w}}/{\bar {\tau }^2_{w,rms}}$. As the flow enters the interaction region, the wavelength
 $\lambda _z$ in the outer scale (
 $\delta _{ref}$) where
 ${\kappa _z E_{\tau '_w \tau '_w}}/{\bar {\tau }^2_{w,rms}}$ achieves the maximum value and experiences a rapid increase. At
 ${x/\delta _{ref}=1}$,
 $\lambda _z$ is
 $0.52\delta _{ref}$, and the value increases to
 $0.68\delta _{ref}$ at
 $x/\delta _{ref}=2$. Meanwhile, the near-wall structures of
 $\tau _w$ (figure 8a) in the range from
 $x/\delta _{ref}=0$ to
 ${x/\delta _{ref}=3}$ reveal an apparent large-scale spanwise heterogeneity along with three high
 $\tau _w$ regions. This indicates that the energetic wavelength
 $\lambda _z$ corresponds to the large-scale spanwise heterogeneity of
 $\tau _w$ which is associated with the Görtler-like structures. This is essentially different from that in the upstream flat-plate boundary layer, and may be the reason that
 $\bar {\tau }_{w,rms}$ nearby does not follow the logarithmic–linear law (
 $\bar {\tau }_{w,rms}/\bar {\tau }_w=0.298+0.018 \ln Re_{\tau }$), as shown in figure 7(b). It is also noteworthy that, as the flow develops from
 $x/\delta _{ref}=1$, the intensity of
 ${\kappa _z E_{\tau '_w \tau '_w}}/{\bar {\tau }^2_{w,rms}}$ at the large spanwise wavelength decreases gradually, which is consistent with the gradually decreased large-scale spanwise heterogeneity of
 $\tau _w$ (see figure 8a,b). This results from the reduced intensity of Görtler-like structures (see figure 10). As the flow moves further downstream from
 $x/\delta _{ref}=3.0$, the peak around
 $\lambda _z=0.68\delta _{ref}$ tends to disappear, and instead another peak at a much smaller wavelength (
 $\lambda _z\approx 0.08\delta _{ref}$) is obtained. This, on one hand, is owing to the reduced intensity of Görtler-like structures (see figure 10) that results in the decreased large-scale spanwise heterogeneity of
 $\tau _w$ and, on the other hand, results from the regeneration of the near-wall elongated streaky structures (figure 8a). At
 $x/\delta _{ref}=3.0$, there exist two peak wavelengths of
 ${\kappa _z E_{\tau '_w \tau '_w}}/{\bar {\tau }^2_{w,rms}}$ that correspond to the above two vortical structures, and it is interesting to find that the intensity of
 $\bar {\tau }_{w,rms}$ also peaks at
 $x/\delta _{ref}=3.0$. Along with further streamwise growth of the flow, the most energetic wavelength tends to gradually decease with increased peak intensity. Nevertheless, the inner scale of the peak is still around 300 at
 $x/\delta _{ref}=6$, far exceeding that in the undisturbed flat plate.
3.5. Skin friction decomposition along with the spanwise inhomogeneity
The drag decomposition method has been found to be helpful to explore the physical mechanisms of drag generation by establishing an explicit relation between the skin friction and spatial distributions of the flow statistics. Based on the conservation law of mean kinetic energy, Renard & Deck (Reference Renard and Deck2016) and Li et al. (Reference Li, Fan, Modesti and Cheng2019) decomposed the skin friction for two-dimensional incompressible and compressible wall-bounded flows into the contributions of molecular viscous dissipation, TKE production and spatial growth of the flow. The above derivations are under the hypothesis that the flow field is spanwise uniform. It has been found that there exists spanwise inhomogeneity in the present flow field, especially on the compression ramp ranging from  $x/\delta _{ref}=0$ to
 $x/\delta _{ref}=4$ (figure 8). Thus, the existing decomposition method cannot be adopted directly in the present paper. To include the effects of spanwise heterogeneity, we derive the decomposition method by employing the three-dimensional Reynolds-averaged momentum equation in the streamwise (
 $x_*$) direction. The detailed derivation process is given in Appendix C, and the skin friction coefficient,
 $C_f={2\bar {\tau }_w}/{(\rho _{\infty }U_{\infty }^2)}$, can be expressed as
 \begin{align} C_f&=\underbrace{
\frac{2}{\rho_{\infty}U_{\infty}^2U_{b}} \int_{0}^{\infty}
\bar{\tau}_{y_*x_*} \frac{\partial \tilde{u}_*}{\partial
y_*}{\rm d}y_*
}_{C_{f,v}:~\textit{molecular~viscous~dissipation~term}}
+\underbrace{ \frac{2}{\rho_{\infty}U_{\infty}^2U_{b}}
\int_{0}^{\infty} -\bar{\rho } \widetilde{u_*''v_*''}
\frac{\partial \tilde{u}_*}{\partial y_*}{\rm d}y_*
}_{C_{f,T}:~\textit{TKE~production~term}}
\nonumber\\ &\quad +\underbrace{
\frac{2}{\rho_{\infty}U_{\infty}^2U_{b}} \int_{0}^{\infty}
(\tilde{u}_*-U_{b}) \bar{\rho} \tilde{v}_* \frac{\partial
\tilde{u}_*}{\partial y_*}{\rm d}y_*
}_{C_{f,C}:~\textit{wall-normal~mean-convection~term}}\nonumber\\
&\quad +\underbrace{
\frac{2}{\rho_{\infty}U_{\infty}^2U_{b}} \int_{0}^{\infty}
(\tilde{u}_*-U_{b}) \left\{ -\frac{\partial
\bar{\tau}_{x_*x_*}}{\partial x_*} +\frac{\partial
\bar{\rho} \widetilde{ u_*''u_*''}}{\partial x_*}
+\bar{\rho} \tilde{u}_* \frac{\partial
\tilde{u}_*}{\partial x_*} +\frac{\partial
\bar{p}}{\partial x_*}\right\} {\rm d}y_*
}_{C_{f,x_*}:~\textit{streamwise~heterogeneity~term}}\nonumber\\
&\quad +\underbrace{
\frac{2}{\rho_{\infty}U_{\infty}^2U_{b}} \int_{0}^{\infty}
(\tilde{u}_*-U_{b}) \left\{\bar{\rho} \tilde{w}
\frac{\partial \tilde{u}_*}{\partial z} +\frac{\partial
\bar{\rho} \widetilde{ u_*''w''}} {\partial z}
-\frac{\partial \bar{\tau}_{zx_*}} {\partial z}
\right\}{\rm d}y_*
}_{C_{f,z}:~\textit{spanwise~heterogeneity~term}},
\end{align}
where  $\bar {\tau }_{x_*x_*}$,
 $\bar {\tau }_{y_*x_*}$ and
 $\bar {\tau }_{zx_*}$ are the viscous normal or shear stress in the
 $x_*$-direction;
 $C_{f,v}$ is associated with the molecular viscous dissipation;
 $C_{f,T}$ denotes the power converted into TKE production that is ultimately dissipated into internal energy via turbulent dissipation;
 $C_{f,C}$ represents the wall-normal mean convection;
 $C_{f,x_*}$ and
 $C_{f,z}$ are generated owing to the streamwise and spanwise heterogeneity, respectively;
 $U_{b}$ is the projection component of
 $U_\infty$ on the
 $x_*$ axis, i.e.
 \begin{equation} U_{b}=\left\{\!\!\begin{array}{ll} U_\infty, & x\leqslant0\ (\text{upstream of the compression corner})\\ U_\infty \cos(24^{{\circ}}), & x>0\ (\text{downstream of the compression corner}). \end{array}\right. \end{equation}
The spanwise-averaged  $C_f$ calculated by the conventional method with
 $C_f={2\bar {\tau }_w}/{(\rho _{\infty }U_{\infty }^2)}$ and (3.2) is shown in figure 13. In the upstream turbulent boundary layer,
 $C_f$ based on the above two methods exhibits no distinguishable difference; in the interaction region, a comparison shows an error of less than 2.0 %, demonstrating the high accuracy of the proposed drag decomposition method.
Streamwise distribution of the spanwise-averaged  $C_f$ and its components: (a)
 $C_f$ based on the conventional method with
 $C_f={2\bar {\tau }_w}/{(\rho _{\infty }U_{\infty }^2)}$ and drag decomposition method expressed in (3.2); (b)
 $C_f$ and its components upstream of the compression corner; (c)
 $C_f$ and its components downstream of the compression corner. Panel (d) is a close-up view of figure (c).

The streamwise distribution of  $C_f$ and its components upstream of the compression corner is shown in figure 13(b). In the undisturbed flat plate, the sum of
 $C_{f,v}$ and
 $C_{f,T}$ contributes more than 89 % of
 $C_{f}$, indicating that the molecular viscous dissipation and TKE production dominate the drag generation. The parameter
 $C_{f,x_*}$ is another strong drag augmentation factor, counting for around 15 % of
 $C_{f}$. A further analysis reveals that the predominant source of
 $C_{f,x_*}$ comes from the streamwise mean-convection effect, i.e.
 $(\tilde {u}_*-U_{b})\bar {\rho } \tilde {u}_* {\partial \tilde {u}_*}/{\partial x_*}$ (not presented here for the sake of brevity). The contribution from the wall-normal mean convection (i.e.
 $C_{f,C}$) acts to reduce
 $C_{f}$. This is because the spatially developing boundary layer works to induce a positive wall-normal velocity, which tends to decrease the near-wall momentum. In fact, it has been found that increasing the vertical velocity by wall blowing is an efficient way of reducing the friction drag (Kametani & Fukagata Reference Kametani and Fukagata2011). In comparison, the contribution from
 $C_{f,z}$ related to the spanwise heterogeneity is negligible. As the flow enters the interaction region,
 $C_{f,T}$ tends to increase significantly, owing to the turbulence amplification (Guo et al. Reference Guo, Zhang, Tong and Li2023). In comparison,
 $C_{f,C}$ experiences an opposite variation trend but at a faster speed, leading to the decrease of
 $C_{f}$. The rapid drop of
 $C_{f,C}$ is not surprising since the flow deceleration caused by the negative pressure gradient leads to an apparent increase of the wall-normal velocity.
Figure 13(c) presents the spanwise-averaged  $C_f$ and its components downstream of the compression corner. A first impression of this figure is that the absolute value of some components is far larger than the total drag
 $C_{f}$. While the components
 $C_{f,T}$ and
 $C_{f,C}$ make dominant positive contributions,
 $C_{f,x_*}$ brings a large negative contribution. Another noteworthy phenomenon is that the value of
 $C_{f,z}$ is up to 20 % of
 $C_f$ around
 $x/\delta _{ref}=2.0$ (figure 13d), indicating that it is necessary to include the influence of spanwise heterogeneity when performing the drag decomposition on the compression ramp.
3.6. Analysis of  $C_f$ and its components on the compression ramp

In this section, each component of spanwise-averaged  $C_f$ on the compression ramp will be analysed in detail to explore the underlying mechanism for the rapid increase of
 $C_f$. From figure 13(d), one can see that, along with the streamwise evolution, the value of
 $C_{f,v}$ shows an increasing trend until
 $x/\delta _{ref}\approx 5.0$, and then it tends to level off. According to (3.2),
 $C_{f,v}$ is closely related to the velocity gradient
 ${\partial \tilde {u}_*}/{\partial y_*}$. Figure 14(a) shows the wall-normal distribution of
 ${\partial \tilde {u}_*}/{\partial y_*}$ at several streamwise locations. It is clear that, downstream of the compression corner, there exist two local peaks of
 ${\partial \tilde {u}_*}/{\partial y_*}$ in the region away from the wall. One peak is located around
 $y_*/\delta _{ref}=0.25$ owing to the establishment of the detached shear layer (Helm, Martín & Williams Reference Helm, Martín and Williams2021), and the other is caused by the shock wave. It is noteworthy that the value of
 ${\partial \tilde {u}_*}/{\partial y_*}$ around the detached shear layer and the shock wave is two orders lower than that at the wall. Figure 15(a) shows the wall-normal profile of the integrand of
 $C_{f,v}$ in (3.2) at several streamwise locations and the result at the reference station
 $x/\delta _{ref}=-3$ is also given for comparison. The value of the integrand around the detached shear layer and the shock wave is four orders lower than that in the near-wall area, and consequently plays a negligible role in the generation of
 $C_{f,v}$. The dominant contribution of
 $C_{f,v}$ lies in the near-wall area where the large velocity gradient occurs (see figure 14a). Since the skin friction
 $C_{f}$ is in direct proportion to the velocity gradient at the wall, it is not surprising that
 $C_{f}$ and
 $C_{f,v}$ follow a similar trend as the flow develops along the streamwise direction.
Wall-normal distribution of (a)  ${\partial \tilde {u}_*}/{\partial y_*}$, (b)
 $-\widetilde {u''_*v''_*}$, (c)
 $\bar {\rho }$, (d)
 $\bar{v}_*$ and
 $\tilde {v}_*$, (e)
 $\tilde {u}_*$ and (f)
 ${\partial \bar {p}}/{\partial x_*}$ at several streamwise locations.

Integrands of each term in (3.2) at several streamwise locations for (a)  $C_{f,v}$, (b)
 $C_{f,T}$, (c)
 $C_{f,C}$,(d)
 $C_{f,x_*}$, (e)
 $C_{f,z}$ and (f) their sum
 $C_{f}$ normalized by
 $\rho _{\infty }U_{\infty }^2U_{b}/\delta _{ref}$.

The parameter  $C_{f,T}$ is associated with the TKE production, being the product of
 ${\partial \tilde {u}_*}/{\partial y_*}$,
 $-\widetilde {u''_*v''_*}$ and
 $\bar {\rho }$. Owing to the detached shear layer and the resultant Kelvin–Helmholtz instability, the intensity of
 $-\widetilde {u''_*v''_*}$ around
 $y_*/\delta _{ref}=0.2$ is significantly amplified compared with that at
 $x/\delta _{ref}=-3$ (figure 14b). In addition, there exists another local maximum peak of
 $-\widetilde {u''_*v''_*}$ around the shock wave. The profiles of the integrand of
 $C_{f,T}$ at several streamwise locations are presented in figure 15(b). In the near-wall area below
 $y_*/\delta _{ref}<0.05$, the integrand achieves the largest value, owing to the extremely high
 ${\partial \tilde {u}_*}/{\partial y_*}$. Nevertheless, the high integrand is confined to a very thin region so that it occupies only a small fraction of
 $C_{f,T}$ in the interaction region. The main contribution of
 $C_{f,T}$ is obtained around the detached layer. In addition, the shock wave also makes a positive contribution to
 $C_{f,T}$. As the flow develops from
 $x/\delta _{ref}=0$ to
 $x/\delta _{ref}=3$, the fluid density appears to increase, while the intensities of
 $-\widetilde {u''_*v''_*}$ and
 ${\partial \tilde {u}_*}/{\partial y_*}$ around the detached shear layer reveal an apparent decrease. The comprehensive result is that
 $C_{f,T}$ remains at a high value with no obvious streamwise variation. As the flow moves further downstream,
 $C_{f,T}$ and its integrand around the detached shear layer tend to decrease, resulting from the gradually decreased
 $-\widetilde {u''_*v''_*}$ and
 ${\partial \tilde {u}_*}/{\partial y_*}$.
The generation of  $C_{f,C}$ is closely related to the wall-normal mean convection, being the product of
 $\tilde {u}_*-U_{b}$,
 $\bar {\rho }$,
 $\tilde {v}_*$ and
 ${\partial \tilde {u}_*}/{\partial y_*}$. Figure 16 shows the contour of the angle,
 $\bar {\varphi }=\arctan (\bar {v}/\bar {u})$, between the local velocity direction and the free-stream flow (
 $x$-axis). If the flow is inviscid, the oblique shock wave arises from the compression corner, and the corresponding
 $\bar {\varphi }$ downstream of the shock wave is expected to be
 $24^{\circ }$, parallel to the ramp wall. When the fluid viscosity is included, a quite different phenomenon is observed, as seen in figure 16. In the near-wall region, the fluid velocity and the local Mach number (figure 16) are significantly decreased compared with the free stream, and hence the intensity of the shock wave is not as strong as that in the region far from the wall, which can also be confirmed by the iso-lines of the pressure gradient in figure 16. The consequence is that
 $\bar {\varphi }$ is much smaller than the compression ramp angle (
 $24^{\circ }$), especially near the corner. The small
 $\bar {\varphi }$ means that the high-velocity fluid will tend to move towards the ramp surface, acting like a jet that enhances the near-wall velocity on the compression ramp. The quantitative comparison of the downwash at several streamwise locations is presented in figure 14(d). One can see that a strong downward motion is obtained on the compression ramp. Another noteworthy phenomenon is that the magnitudes of
 $\tilde {v}_*$ and
 $\bar {v}_*$ have an apparent difference, which is obviously owing to the flow compressibility that causes large variation of the fluid density along the wall-normal direction (figure 14c). Downstream of the corner, the absolute value of
 $\tilde {v}_*$ is larger than
 $\bar {v}_*$. Considering that it is
 $\tilde {v}_*$ that is associated with
 $C_{f,C}$, it can be concluded that the density variation along the wall-normal direction caused by the flow compressibility has a positive effect on the generation of
 $C_{f,C}$.
Contours of the spanwise-averaged  $\bar {\varphi }=\arctan (\bar {v}/\bar {u})$ in the
 $x{-}y$ plane. The blue lines denote the iso-lines of
 $|\boldsymbol {\nabla }\bar {p}|\delta /{p}_{\infty }= 5, 30, 55$ and 80; the green lines present the iso-lines of
 $\overline{Ma}=1$ and 2.

According to the profiles of the integrand of  $C_{f,C}$ in figure 15(c), it is clear that the generation of
 $C_{f,C}$ on the compression ramp mainly occurs around the detached shear layer, where high intensity of
 ${\partial \tilde {u}_*}/{\partial y_*}$ is obtained. Moreover, the fluid density nearby is significantly increased, caused by the shock wave, and this also contributes to the increase of
 $C_{f,C}$ when combined with the downward motion. As the flow develops further downstream, the streamwise velocity tends to increase as the boundary layer recovers gradually, and this contributes to the decrease of the absolute value of
 $\tilde {u}_*-U_{b}$ (figure 14e). In addition, the intensity of
 $\bar {v}_*$ also shows a decreasing trend, consistent with the gradually increased
 $\bar {\varphi }$. The consequence is that the integrand of
 $C_{f,C}$ decreases gradually, leading to the decrease of
 $C_{f,C}$. Apart from the region of the detached shear layer, the shock wave itself also makes a positive contribution to
 $C_{f,C}$, and the intensity appears to increase with the streamwise evolution since the intensity of the shock wave nearby tends to increase (figure 16). In comparison, the wall-normal velocity in the undisturbed boundary layer is positive, leading to the negative
 $C_{f,C}$ with a far smaller value.
The component  $C_{f,x_*}$ arises from the streamwise heterogeneity, and according to (3.2), it is composed of four sub-components, denoted by
 $C_{f,x_*,v}$,
 $C_{f,x_*,T}$,
 $C_{f,x_*,C}$ and
 $C_{f,x_*,P}$. Figure 17(a) shows the streamwise distribution of the four terms downstream of the compression corner, and one can see that
 $C_{f,x_*,v}$ plays a negligible role. The term
 $C_{f,x_*,T}$ makes a considerable negative contribution to
 $C_f$ downstream of the compression corner but with gradually decreased absolute value, and a small positive value is observed from
 $x/\delta _{ref}=2.5$. Around
 $x/\delta _{ref}=0$, the turbulent fluctuations are significantly increased, and tend to decrease as the flow develops further downstream (figure 18a). Owing to the increase of fluid density (figure 14c), the intensity of
 $\bar {\rho }\widetilde {u''_*u''_*}$ shows an increasing trend from
 $x/\delta _{ref}=0$ to
 $x/\delta _{ref}=2.5$, before it tends to decrease, leading to the sign change of
 ${\partial \bar {\rho }\widetilde {u''_*u''_*}}/{\partial x_*}$ around
 $x/\delta _{ref}=2.5$ (figure 18b) and consequently
 $C_{f,x_*,T}$.
Streamwise distribution of (a) the spanwise-averaged  $C_{f,x_*}$ and its components as well as (b)
 $C_{f,z}$ and its components normalized by
 $C_{f}$.

Contours of the spanwise-averaged (a)  $\widetilde {u''_*u''_*}$ and (b)
 $\bar {\rho }\widetilde {u''_*u''_*}$ in the
 $x{-}y$ plane.

The term  $C_{f,x_*,C}$ represents the contribution from the streamwise mean convection. As the flow moves downstream from the compression corner, the fluid density (figure 14c) and the streamwise velocity below
 $y_*/\delta _{ref}=0.3$ (figure 14e) show an increasing trend, indicating that the streamwise mean convection conveys lower-momentum fluid from the upstream region toward the downstream area. As a result, the integrand of
 $C_{f,x_*,C}$ below
 $y_*/\delta _{ref}=0.3$ is negative (figure 19a). At
 $x/\delta _{ref}=1$, 2 and 3, the integrand below
 $y_*/\delta _{ref}=0.3$ plays a dominant role in the generation of
 $C_{f,x_*,C}$, and the consequence is that
 $C_{f,x_*,C}$ is negative. As the flow moves further downstream, the absolute value of
 $C_{f,x_*,C}$ and its integrand in the near-wall region reveal a decreasing trend. Downstream of
 $x/\delta _{ref}=3$, the integrand around the shock wave plays a non-negligible role in the generation of
 $C_{f,x_*,C}$ but with a positive value, and dominates the generation of
 $C_{f,x_*,C}$ at
 $x/\delta _{ref}=6$, contributing to a positive
 $C_{f,x_*,C}$.
Integrands of (a)  $C_{f,x_*,C}$ and (b)
 $C_{f,x_*,P}$ normalized by
 $\rho _{\infty }U_{\infty }^2U_{b}/\delta _{ref}$ at several streamwise locations.

The value of  $C_{f,x_*,P}$ is consistent with the pressure variation along the
 $x_*$ direction. Downstream of the compression corner, a large positive pressure derivative with respect to
 $x_*$ is obtained (figure 14f), leading to negative
 $C_{f,x_*,P}$ with large absolute value. Further downstream, the pressure derivative below
 $y_*/\delta _{ref}=0.3$ gradually decreases, and when combined with the increased
 $\tilde {u}$ (i.e. decreased absolute value of
 $\tilde {u}_*-U_{b}$), the absolute value of the integrand of
 $C_{f,x_*,P}$ tends to decrease at a high speed and approaches zero at
 $x/\delta _{ref}=6.0$ (figure 19b), indicating that the interaction tends to play a negligible role in the generation of
 $C_{f,x_*,P}$. By contrast, the intensity of the shock wave appears to increase, leading to the increased absolute value of the integrand (figure 19b). It can be inferred that, as the flow moves further away from the interaction region, the intensity of the shock wave will remain unchanged, being irrelevant to SWTBLIs. The consequence is that the integrand of
 $C_{f,x_*,P}$ will become constant around the shock wave and
 $C_{f,x_*,P}$ tends to level off with a non-zero constant (figure 17a).
Ther term  $C_{f,z}$ originates from the spanwise heterogeneity, and according to (3.2), it is composed of three sub-components, denoted by
 $C_{f,z,v}$,
 $C_{f,z,T}$ and
 $C_{f,z,C}$. Figure 13(d) shows the streamwise distribution of
 $C_{f,z}$. It is shown that, compared with
 $C_{f,z}$ in the undisturbed turbulent boundary layer,
 $C_{f,z}$ in the interaction region has an apparent increase, with the maximum value exceeding 60 times that in the undisturbed boundary layer. From figure 17(b), one can see that
 $C_{f,z}$ in the undisturbed turbulent boundary layer contributes only 1 % of
 $C_{f}$. This is reasonable since the flow is statistically two-dimensional, i.e. spanwise homogeneous. In comparison, the contribution of
 $C_{f,z}$ is up to 20.7 % on the compression ramp, owing to the spanwise heterogeneity caused by Görtler-type streamwise vortex. Among the three sub-components,
 $C_{f,z,C}$ contributes the largest to
 $C_{f,z}$, followed by
 $C_{f,z,T}$, while the contribution from
 $C_{f,z,v}$ can be ignored. The integrand of
 $C_{f,z}$ at several streamwise locations is presented in figure 15(e). It is clear that the main contribution of
 $C_{f,z}$ is obtained below
 $y_*/\delta _{ref}=0.4$, which is consistent with the height of the Görtler-type vortex. The sign of the integrand changes around
 $y_*/\delta _{ref}\approx 0.2$, which is consistent with the centre of the streamwise vortex where the spanwise velocity is relatively small, further confirming that
 $C_{f,z}$ is caused by the Görtler-type vortices. In comparison, the shock wave makes no contribution to the generation of
 $C_{f,z}$.
The integrand of  $C_{f}$ at several streamwise locations is presented in figure 15(f). It is clear that the drag contribution in the near-wall region below
 $y_*/\delta _{ref}<0.01$ is dominated by
 $C_{f,v}$ and
 $C_{f,T}$, owing to the extremely high velocity gradient caused by the no-slip wall surface. By contrast, the drag integrand in the range
 $0.01< y_*/\delta _{ref}<0.15$ is negative and dominated by
 $C_{f,x_*}$, which is relevant to the streamwise heterogeneity mainly resulting from the increase of the streamwise velocity (
 ${\partial \tilde {u}_*}/{\partial x_*}>0$) and pressure (
 ${\partial \bar {p}}/{\partial x_*}>0$). At
 $0.15< y_*/\delta _{ref}<0.4$, the drag generation arises from
 $C_{f,T}$ and
 $C_{f,C}$. While the former is closely correlated to the turbulence amplification caused by the detached shear layer, the latter is owing to the strong downwash. Moreover, the density increase caused by the shock wave contributes to both
 $C_{f,T}$ and
 $C_{f,C}$. With a closer examination, it seems that the negative and positive parts of the integrand of
 $C_{f}$ around the shock wave approximatively cancel out, and the overall contribution on
 $C_{f}$ is much less.
According to the above analysis, the main flow features that contribute positively to the amplification of  $C_{f}$ and its rapid increase on the compression ramp include the extremely high velocity gradient in the near-wall region (
 $C_{f,v}$), the density increase across the shock wave (
 $C_{f,T}$ and
 $C_{f,C}$), the turbulence amplification around the detached shear layer (
 $C_{f,T}$) and the downwash that transports high-momentum fluid towards the ramp wall (
 $C_{f,C}$). It is the Favre-averaged downward velocity
 $\tilde {v}_*$ that contributes to the generation of
 $C_f$, and compared with
 $\bar {v}_*$, the intensity of downwash by
 $\tilde {v}_*$ is stronger, indicating that the density variation along the wall-normal direction caused by the flow compressibility has a positive effect on the generation of
 $C_{f,C}$ and then
 $C_f$. In addition, the streamwise variation of
 $\tilde {u}_*$ and
 $\bar {p}$ gradually slows down, leading to the decrease of the absolute value of
 $C_{f,x_*}$ that has a positive effect on the rapid increase of
 $C_{f}$. The drag contribution arising from the spanwise heterogeneity (
 $C_{f,z}$) is up to 20.7 % of
 $C_{f}$ of that on the compression ramp, caused by the Görtler-type streamwise rotating vortex.
3.7. Spanwise variation of $C_f$ and its components

Figure 20 shows contours of  $-\bar {\rho }\widetilde {u''_*v''_*}$ and
 $\bar {\rho }\widetilde {u''_*w''_*}$ in the
 $y_*{-}z$ plane at
 $x/\delta _{ref}=2$. The in-plane velocity vectors (
 $\bar {v}_*$,
 $\bar {w}$) are presented by subtracting the spanwise-averaged magnitude to highlight the large-scale streamwise vortices and the spanwise heterogeneity. One can clearly see that a pair of secondary rollers is developed, and a spanwise variation of the flow field is induced due to the large-scale streamwise vortices. A similar spanwise variation trend has also been observed in the incompressible boundary layer flow over the spanwise heterogeneous surfaces caused by large-scale streamwise vortices (Vanderwel et al. Reference Vanderwel, Stroh, Kriegseis, Frohnapfel and Ganapathisubramani2019). According to figure 8(b), the streamwise vortices contribute to an apparent spanwise variation of the wall shear stress in the interaction region. In comparison,
 $\bar {\tau }_w$ at
 $z_1$ exhibits a local maximum value along the spanwise direction caused by the downwash (figure 20), while
 $\bar {\tau }_w$ reveals a local minimum value at
 $z_2$ where the upwash occurs (figure 20).
Contours of (a)  $-\bar {\rho }\widetilde {u''_*v''_*}$ and (b)
 $\bar {\rho }\widetilde {u''_*w''_*}$ in the
 $y_*{-}z$ plane at
 $x/\delta _{ref}=2$. The dashed and dash-dotted lines denote the spanwise stations for maximum and minimum
 $\bar {\tau }_w$.

The quantitative comparison of  $C_{f}$ and its components at
 $x/\delta _{ref}=2$ for different spanwise stations is presented in figure 21. The value of the bars denotes the percentage of increment compared with the spanwise-averaged value, and one can see that
 $C_{f}$ at
 $z_1$ reveals a 17 % increment, while at
 $z_2$ it is reduced by 13 %.
Comparison of  $C_{f}$ and its components at
 $x/\delta _{ref}=2$ for different spanwise positions.

Figure 22(a) shows the profile of the integrand of  $C_{f,v}$ expressed in (3.2) at
 $x/\delta _{ref}=2$. One can see that the main contribution of
 $C_{f,v}$ is obtained in the near-wall area below
 $y_*/\delta _{ref}<0.01$ where the large velocity gradient occurs (see figure 23a). As expected, the value of the integrand at
 $z_1$ is larger, resulting from the stronger downwash induced by the streamwise vortex. It has been found that
 $C_{f,v}$ is mainly generated in the near wall, and the consequence is that
 $C_{f,v}$ at
 $z_1$ has a percentage increment of 23 % compared with the spanwise-averaged value. In comparison,
 $C_{f,v}$ at
 $z_2$ is reduced by 18 %, owing to the upwash of the streamwise vortex. Apart from the near-wall region, there exists another local peak of the integrand around
 $y_*/\delta _{ref}=0.25$ caused by the detached shear layer resulting from the SWTBLIs, and the value at
 $z_2$ is larger. Nonetheless, its contribution to
 $C_{f,v}$ is so small that its impact on the spanwise variation can be neglected.
The integrands of each term in (3.2) at  $x/\delta _{ref}=2$ for different spanwise positions. Panels show (a)
 $C_{f,v}$, (b)
 $C_{f,T}$, (c)
 $C_{f,C}$ and (d)
 $C_{f,x_*}$ normalized by
 $\rho _{\infty }U_{\infty }^2U_{b}/\delta _{ref}$.

Wall-normal distribution of (a)  ${\partial \tilde {u}_*}/{\partial y_*}$, (b)
 $-\widetilde {u''_*v''_*}$, (c)
 $\bar {\rho }$, (d)
 $\bar {v}_*$ and
 $\tilde {v}_*$, (e)
 $\tilde {u}_*$ and (f)
 ${\partial \bar {p}}/{\partial x_*}$ at
 $x/\delta _{ref}=2$ for different spanwise positions.

The parameter  $C_{f,T}$ is a main component of
 $C_{f}$, and from figure 21 it is clear that
 $C_{f,T}$ also makes an important contribution to the spanwise variation, with a 16 % reduction at
 $z_1$ and a 20 % increment at
 $z_2$. It is also noteworthy that the absolute difference of
 $C_{f,T}$ between
 $z_1$ and
 $z_2$ exceeds the magnitude of the spanwise-averaged
 $C_{f}$. In order to gain a further insight into the underlying flow mechanism, the wall-normal distribution of the integrand of
 $C_{f,T}$ at
 $x/\delta _{ref}=2$ is presented in figure 22(b). It is clear that the main difference between
 $z_1$ and
 $z_2$ is obtained around
 $y_*/\delta _{ref}=0.25$, where the detached shear layer occurs. In comparison, at
 $z_1$ with stronger downwash, the intensity of the Reynolds shear stress
 $-\widetilde {u''_*v''_*}$ is reduced (see figure 23b), while the opposite phenomenon occurs at
 $z_2$. It is understandable that the turbulence intensity is stronger at the spanwise location where the upward motion occurs. This can be attributed to the accumulation of near-wall turbulence-rich fluid caused by the spanwise motion that transports the near-wall fluid away from the region of downwelling toward the region of upwelling, and the upward motion which carries the turbulence-rich fluid away from the wall. Resulting from the detached shear layer, the wall-normal position at which
 ${\partial \tilde {u}_*}/{\partial y_*}$ (see figure 23a) peaks is similar to that of
 $-\widetilde {u''_*v''_*}$ (see figure 23b). Since
 $C_{f,T}$ is relevant to the product of
 ${\partial \tilde {u}_*}/{\partial y_*}$ and
 $-\widetilde {u''_*v''_*}$, the magnitude of the integrand of
 $C_{f,T}$ at
 $z_1$ is much larger than that at
 $z_2$, approaching two times larger. Thus, it can be inferred that the existence of the detached shear layer appears to broaden the spanwise variation of
 $C_{f,T}$. Apart from the detached shear layer region, there exists apparent spanwise variation of the integrand in the near-wall area below
 $y_*/\delta _{ref}<0.01$. Owing to the stronger mean shear stress (see figure 23a) and higher fluid density (see figure 23c) at
 $z_1$, the corresponding integrand value is higher. The opposite phenomenon is obtained at
 $z_2$ with a lower integrand. However, this region is confined below
 $y_*/\delta _{ref}<0.01$, and its contribution to
 $C_{f,T}$ is far less than that around the detached shear layer.
The parameter  $C_{f,C}$ is another main component of
 $C_{f}$, and from figure 21 one can see that, compared with the spanwise-averaged value,
 $C_{f,C}$ at
 $z_1$ is increased by 3.4 % while at
 $z_2$ it is decreased by 15 %. From the profile of the integrand of
 $C_{f,C}$ in figure 22(c), one can see that the integrand below
 $y_*/\delta _{ref}=0.2$ is larger at
 $z_1$, owing to the stronger downward motion (i.e.
 $-\tilde {v}_*$, see figure 23d). Above
 $y_*/\delta _{ref}=0.2$, the magnitude of the integrand at
 $z_1$ tends to be smaller than that at
 $z_2$, resulting from the weaker mean shear stress
 ${\partial \tilde {u}_*}/{\partial y_*}$ (see figure 23a) and lower fluid density (see figure 23c).
The term  $C_{f,x_*}$ arises from the streamwise heterogeneity and makes negative contributions to
 $C_{f}$. As the flow develops downstream of the compression corner, the streamwise variation of the flow field, i.e.
 $\tilde {u}_*$ (figure 14e) and
 $\bar {p}$ (figure 14f), reduces gradually. The consequence is that the absolute value of
 $C_{f,x_*}$ shows a decreasing trend. With a closer examination of figure 23(e,f), one can see that, at
 $z_1$, the velocity profile is fuller and the pressure derivative with respect to
 $x_*$ is smaller. This can be attributed to the stronger downwash that speeds up the recovery of the flow field so that the streamwise variation of the flow field at
 $z_1$ is smaller. As a result, the absolute magnitude of
 $C_{f,x_*}$ at
 $z_1$ is smaller compared with the spanwise-averaged value, and the opposite phenomenon occurs at
 $z_2$.
The term  $C_{f,z}$ originates from the spanwise heterogeneity, and hence it is not surprising that there exist significant differences at different spanwise locations with a 158 % reduction at
 $z_1$ and a 266 % increment at
 $z_2$. It is noteworthy that the absolute difference of
 $C_{f,z}$ at
 $z_1$ and
 $z_2$ exceeds four times the spanwise-averaged
 $C_{f,z}$ and 80 % of the spanwise-averaged
 $C_{f}$. A further comparison indicates that the difference is caused by the spanwise gradient of
 $\bar {\rho }\widetilde {u''_*w''}$ (figure 20b).
4. Conclusion
In this paper, DNS of a hypersonic turbulent boundary layer over a  $24^{\circ }$ compression ramp is performed at Mach 6.0 flow. The amplification of the wall skin friction and its spanwise heterogeneity on the compression ramp are analysed via the spectral analysis and drag decomposition method. The accuracy of the computational method is validated by comparing the velocity profile and turbulence intensity with the published data. The results of the grid- and domain-sensitivity study indicate that the mesh resolution and the spanwise domain extent are sufficient for the flow field of interest.
In the undisturbed turbulent boundary layer,  $\bar {\tau }_{w,rms}$ followed a logarithmic–linear law with
 $Re_{\tau }$, i.e.
 $\bar {\tau }_{w,rms}/\bar {\tau }_w=0.298+0.018 \ln Re_{\tau }$. The premultiplied spanwise energy spectrum of
 $\tau '_{w}$ peaks around
 $\lambda _z^+ \approx 100$, the characteristic length scale of streak spacing in canonical wall-bounded turbulence. This indicates that the near-wall streak structures dominate the wall shear stress fluctuations.
On the compression ramp, the premultiplied spanwise energy spectrum of  $\tau '_{w}$ reveals two energetic spanwise length scales. In the region from the compression corner to
 $x/\delta _{ref}=3.0$, the dominant length scale corresponds to that of the large-scale streamwise vortices, indicating that the fluctuation intensity of
 $\tau _{w}$ is mainly associated with the Görtler-type structures. This is essentially different from that in the upstream boundary layer, and may be the reason that
 $\bar {\tau }_{w,rms}$ nearby does not follow the above-mentioned logarithmic–linear law. Downstream of
 $x/\delta _{ref}=3.0$, the dominant length scale is consistent with the regenerated elongated streaky structures. It is interesting to find that
 $\bar {\tau }_{w,rms}$ peaks at
 $x/\delta _{ref}=3.0$, where both of the above energetic length scales are observed.
The existing drag decomposition method in compressible wall-bounded turbulent flow by Li et al. (Reference Li, Fan, Modesti and Cheng2019) is obtained under the hypothesis that the mean flow field is spanwise uniform. In the present study, we extend this method to include the effects of spanwise non-homogeneity so that it can be used on the compression ramp where the flow field and the mean skin friction  $C_f$ reveal an obvious spanwise heterogeneity, caused by the Görtler-type streamwise vortex structures. The results reveal that, in the upstream turbulent boundary layer, the drag contribution arising from the spanwise heterogeneity is less than 1 % of
 $C_f$, while this value on the compression ramp is up to 20.7 % of
 $C_f$.
With the aid of the proposed drag decomposition method, it is found that the main flow features that contribute positively to the amplification of  $C_f$ and its rapid increase on the compression ramp include: the density increase across the shock, the high mean shear stress and turbulence amplification around the detached shear layer and the downwash that transports high momentum fluid towards the ramp wall. It is
 $\tilde {v}_*$ instead of
 $\bar {v}_*$ that contributes to the generation of
 $C_{f,C}$, and compared with
 $\bar {v}_*$, the intensity of downwash by
 $\tilde {v}_*$ is stronger, indicating that the density variation along the wall-normal direction caused by the flow compressibility has a positive effect on the generation of
 $C_{f,C}$ and ultimately
 $C_f$.
The influence of the downwash (at  $z_1$) and upwash (at
 $z_2$) of the Görtler-type streamwise vortices on
 $C_f$ and its components is investigated at
 $x/\delta _{ref}=2.0$. Compared with the spanwise-averaged value,
 $C_{f}$ at
 $z_1$ reveals a 17 % increment, while at
 $z_2$ it is reduced by 13 %. Each component reveals a spanwise variation exceeding 10 %, and the term arising from the spanwise heterogeneity contributes to a 158 % reduction at
 $z_1$ and a 266 % increment at
 $z_2$, caused mainly by the spanwise variation of
 $\bar {\rho }\widetilde {u''_*w''}$.
Acknowledgements
The authors thank National Supercomputer Center in Tianjin (NSCC-TJ), and National Supercomputer Center in Guangzhou (NSCC-GZ) for providing computer time.
Funding
This work was supported by the National Key Research and Development Program of China (2019YFA0405300), NSFC Projects (12232018, 12072349, 12202457), the Strategic Priority Research Program of Chinese Academy of Science (XDB0500301) and the China Postdoctoral Science Foundation (2022M723232).
Declaration of interests
The authors report no conflict of interest.
Appendix A. Influence of the spanwise domain extent on the spanwise heterogeneity of the wall shear stress
The mean wall shear stress for the case with larger domain width ( $W=6.0\delta _{ref}$) is presented in figure 24, to address the effect of the spanwise domain extent on the spanwise non-homogeneity of
 $\bar {\tau }_w$. One can see that the maximum and minimum of
 $\bar {\tau }_w$ on the ramp wall face are observed in an alternative manner along the spanwise direction, which is the same as the case of
 $W=3.0\delta _{ref}$ (figure 8b). Moreover, when the spanwise domain width doubles from
 $W=3.0\delta _{ref}$ to
 $W=6.0\delta _{ref}$, the number of the maximum and minimum
 $\bar {\tau }_w$ stations across the spanwise domain extent also doubles. Therefore, the domain width
 $W=3.0\delta _{ref}$ is expected to provide accurate result for the spanwise heterogeneity of
 $\bar {\tau }_w$.
Contour of mean wall shear stress  $\bar {\tau }_w$ for the case with
 $W=6.0\delta _{ref}$. The blue dashed and dash-dotted lines denote the spanwise stations for the maximum and minimum
 $\bar {\tau }_w$.

Appendix B. Influence of the statistical time range for $C_f$ and its components

In the present study, the non-dimensional time step for the baseline case is  $0.0008\delta /U_{\infty }$. After the flow reaches the statistically steady state, the instantaneous flow field is sampled every 5 time steps. For the mean flow field in the above study, 375 000 samples of instantaneous flow field are collected, covering a 1500
 $\delta _{ref}/U_{\infty }$ time range. To ensure statistical convergence,
 $C_f$ and its components from three different statistical time ranges are compared in figure 25. One can see that the results reveal no distinguishable differences, indicating that the flow field has reached statistical convergence.
Influence of the statistical time range for  $C_f$ and its components expressed in (3.2) for the region (a) upstream and (b) downstream of the compression corner.

Appendix C. Derivation of the skin friction decomposition in the compressible boundary layer
The three-dimensional Reynolds-averaged momentum equation in the streamwise ( $x_*$) direction is expressed as
 \begin{equation} \frac{\partial \overline{\rho u_*}} {\partial {t}}+ \frac{\partial \overline{\rho u_*u_*} }{\partial {x_*}}+ \frac{\partial \overline{\rho u_*v_*} }{\partial {y_*}}+ \frac{\partial \overline{\rho u_*w} }{\partial {z}} ={-}\frac{\partial \bar{p}} {\partial {x_*}}+ \frac{\partial \bar{\tau}_{x_*x_*}} {\partial {x_*}}+ \frac{\partial \bar{\tau}_{y_*x_*}} {\partial {y_*}}+ \frac{\partial \bar{\tau}_{zx_*}} {\partial {z}}, \end{equation}
where the equation is expressed in ( $x_*,y_*,z$) coordinates (see figure 1);
 $\bar {\tau }_{x_*x_*}$,
 $\bar {\tau }_{y_*x_*}$ and
 $\bar {\tau }_{zx_*}$ are the viscous normal stress and shear stress in the
 $x_*$-direction.
Since the flow field is statistically steady,  ${\partial \overline {\rho u}_*}/{\partial {t}}$ is definitely zero. Multiplying (C1) by
 $(\tilde {u}_*-U_b)$(
 $U_b$ gives (3.2)), and integrating it along the wall-normal direction from
 $y_*=0$ to
 $\infty$, one can obtain
 \begin{align} &\int_{0}^{\infty}(\tilde{u}_*-U_b)\left[\frac{\partial \bar{\rho } \widetilde{u_*''u_*''}}{\partial {x_*}}+ \frac{\partial\bar{\rho}\tilde{u}_*\tilde{u}_*}{\partial {x_*}}+ \frac{\partial \bar{\rho } \widetilde{u_*''v_*''}}{\partial {y_*}}+ \frac{\partial\bar{\rho}\tilde{u}_*\tilde{v}_*}{\partial {y_*}}+ \frac{\partial \bar{\rho } \widetilde{u_*''w''}}{\partial {z}}+ \frac{\partial\bar{\rho}\tilde{u}_*\tilde{w}}{\partial {z}}\right]{\rm d}y_*\nonumber\\ &\quad =\int_{0}^{\infty}(\tilde{u}_*-U_b)\left[-\frac{\partial \bar{p}} {\partial {x_*}}+ \frac{\partial \bar{\tau}_{x_*x_*}} {\partial {x_*}}+ \frac{\partial \bar{\tau}_{y_*x_*}} {\partial {y_*}}+ \frac{\partial \bar{\tau}_{zx_*}} {\partial {z}}\right]{\rm d}y_*, \end{align}
where  $\overline {\rho u_*u_*}=\bar {\rho } \widetilde {u_*''u_*''}+ \bar {\rho }\tilde {u}_*\tilde {u}_*$;
 $\overline {\rho u_*v_*}=\bar {\rho } \widetilde {u_*''v_*''}+ \bar {\rho }\tilde {u}_*\tilde {v}_*$;
 $\overline {\rho u_*w}=\bar {\rho } \widetilde {u_*''w''}+ \bar {\rho }\tilde {u}_*\tilde {w}$.
The terms in (C2) can be transformed into
 \begin{equation} \left.\begin{gathered}
\int_{0}^{\infty}(\tilde{u}_*-U_b) \frac{\partial \bar{\rho
} \widetilde{u_*''v_*''}}{\partial {y_*}}{\rm d}y_*
=\int_{0}^{\infty} \frac{\partial \bar{\rho }
\widetilde{u_*''v_*''}(\tilde{u}_*-U_b)}{\partial
{y_*}}{\rm d}y_*- \int_{0}^{\infty} \bar{\rho }
\widetilde{u_*''v_*''} \frac{\partial \tilde{u}_*}{\partial
{y_*}}{\rm d}y_* \\ =\bar{\rho}
\widetilde{u_*''v_*''}(\tilde{u}_*-U_b)|_0^{\infty}-
\int_{0}^{\infty} \bar{\rho } \widetilde{u_*''v_*''}
\frac{\partial \tilde{u}_*}{\partial {y_*}}{\rm d}y_*={-}
\int_{0}^{\infty} \bar{\rho } \widetilde{u_*''v_*''}
\frac{\partial \tilde{u}_*}{\partial {y_*}}{\rm d}y_*, \\
\frac{\partial\bar{\rho}\tilde{u}_*\tilde{u}_*}{\partial
{x_*}}+
\frac{\partial\bar{\rho}\tilde{u}_*\tilde{v}_*}{\partial
{y_*}}+
\frac{\partial\bar{\rho}\tilde{u}_*\tilde{w}}{\partial {z}}
=\bar{\rho}\tilde{u}_*\frac{\partial\tilde{u}_*}{\partial
{x_*}}+
\bar{\rho}\tilde{v}_*\frac{\partial\tilde{u}_*}{\partial
{y_*}}+
\bar{\rho}\tilde{w}_*\frac{\partial\tilde{u}_*}{\partial
{z}}, \\ \int_{0}^{\infty}(\tilde{u}_*-U_b) \frac{\partial
\bar{\tau}_{y_*x_*}} {\partial {y_*}}{\rm d}y_*
=\int_{0}^{\infty} \frac{\partial
\bar{\tau}_{y_*x_*}(\tilde{u}_*-U_b)} {\partial
{y_*}}-\bar{\tau}_{y_*x_*}\frac{\partial\tilde{u}_*}{\partial
{x_*}}{\rm d}y_* \\
=\bar{\tau}_{y_*x_*}(\tilde{u}_*-U_b)|_0^{\infty}-\int_{0}^{\infty}\bar{\tau}_{y_*x_*}
\frac{\partial\tilde{u}_*}{\partial {x_*}}{\rm d}y_*
=U_b\bar{\tau}_{w}-\int_{0}^{\infty}\bar{\tau}_{y_*x_*}\frac{\partial\tilde{u}_*}{\partial
{x_*}}{\rm d}y_*,
\end{gathered}\right\}\end{equation}
where the Favre-averaged continuity equation ( ${\partial \overline {\rho u}_*}/{\partial {x_*}}+{\partial \overline {\rho v}_*}/{\partial {y_*}}+{\partial \bar {\rho w}}/{\partial {z}}=0$) is applied.
Substituting (C3) into (C2) yields
 \begin{align} U_b\bar{\tau}_{w}&=\int_{0}^{\infty} \bar{\tau}_{y_*x_*} \frac{\partial \tilde{u}_*}{\partial y_*}{\rm d}y_* + \int_{0}^{\infty} -\bar{\rho } \widetilde{u_*''v_*''} \frac{\partial \tilde{u}_*}{\partial y_*}{\rm d}y_* +\int_{0}^{\infty} (\tilde{u}_*-U_{b}) \bar{\rho} \tilde{v}_* \frac{\partial \tilde{u}_*}{\partial y_*}{\rm d}y_* \nonumber\\ &\quad +\int_{0}^{\infty} (\tilde{u}_*-U_{b}) \left\{ -\frac{\partial \bar{\tau}_{x_*x_*}}{\partial x_*} +\frac{\partial \bar{\rho} \widetilde{ u_*''u_*''}}{\partial x_*} +\bar{\rho} \tilde{u}_* \frac{\partial \tilde{u}_*}{\partial x_*} +\frac{\partial \bar{p}}{\partial x_*}\right\}{\rm d}y_* \nonumber\\ &\quad +\int_{0}^{\infty} (\tilde{u}_*-U_{b}) \left\{ \bar{\rho} \tilde{w} \frac{\partial \tilde{u}_*}{\partial z} +\frac{\partial \bar{\rho} \widetilde{ u_*''w''}} {\partial z} -\frac{\partial \bar{\tau}_{zx_*}} {\partial z}\right\}{\rm d}y_*. \end{align}
Since  $C_f={2\bar {\tau }_w}/{(\rho _{\infty }U_{\infty }^2)}$, (3.2) can be obtained by multiplying
 ${2}/{(\rho _{\infty }U_{\infty }^2)}U_b$ on both sides of (C4).



