

Introduction
Traditionally, the introduction and design of welfare policies have been explained with reference to power relations, institutions and structural factors but recent contributions forcefully argue that micro-level preferences matter for explaining both politics and policies (Cusack et al., Reference Cusack, Iversen and Rehm2006; Hacker et al., Reference Hacker, Rehm and Schlesinger2013). Consequently, the political economy and comparative social policy literatures have increasingly paid attention to individual-level support for welfare state policies, and our understanding of material and value-driven support for social policies has significantly improved in the last decades (Häusermann et al., Reference Häusermann, Kurer and Schwander2016; Iversen & Soskice, Reference Iversen and Soskice2001; Rehm, Reference Rehm2011; Schwander, Reference Schwander2020; Vlandas Reference Vlandas2019a).
By contrast, the study of universal basic income (UBI) has focused on the normative and economic desirability of such a scheme, not least because a UBI has not so far been introduced on a national scale. Instead, this article seeks to contribute to our understanding of the drivers of individual support for UBI, which should be of interest to scholars of political economy and comparative social policy. Indeed, given its different entitlement structure compared to traditional social benefits and the fact that a UBI at the national level does not yet exist, we do not know whether the usual factorsFootnote 1 driving individual support for a UBI are relevant in this case. As Vlandas (Reference Vlandas2020) argues in a recent contribution, UBI can therefore be considered a “hard case” for existing political economy and welfare state expectations about variation in individual preferences for social policies.
Our focus is part of a growing scholarly interest in explaining variation in individual attitudes towards UBI (eg. Chrisp & Martinelli, Reference Chrisp and Martinelli2018; Lee, Reference Lee2018; Roosma & van Oorschot, Reference Roosma and van Oorschot2018; Vlandas, Reference Vlandas2019b and Reference Vlandas2020). These studies represent a crucial addition to the more normative and economic literature that has so far dominated studies of UBI (see Van Parijs & Vanderborght, Reference Van Parijs and Vanderborght2017). Existing empirical analyses suggest that support for UBI is particularly high among individuals in economically vulnerable situations (low income, precarious employment) and among individuals that support the welfare state in general (see Parolin & Siöland, Reference Parolin and Siöland2020; Roosma & van Oorschot, Reference Roosma and van Oorschot2020; Vlandas, Reference Vlandas2020). Hence, in line with the broader literature on social policy preferences, material self-interest and ideology seem to be crucial drivers for this new policy vision too.
In this article, we add to this recent literature by focusing on the role of left ideology and its association with different patterns of left-wing individual support for UBI. We consider looking at the role of ideology in shaping support among the Left worthwhile for two reasons. First, without the support of the Left, it is unlikely that any government can successfully implement UBI. Here, the relevance of public opinion is particularly pertinent: much of UBI’s intellectual origins come from the Left and the scheme finds most but not all of its support among left-wing citizens, yet parts of the union movement are skeptical of UBI (Van Parijs & Vanderborght, Reference Van Parijs and Vanderborght2017). Hence, our findings are relevant to those interested in the political conditions necessary for the implementation of UBI, both for policy-making circles as well as in the academic welfare state literature.
A second reason relates to the large literature underscoring the importance of ideology for welfare state preferences (Bremer & Schwander, Reference Bremer and Schwander2019; Dimick et al., Reference Dimick, Rueda and Stegmueller2018; Jæger, Reference Jæger2006; Linos & West, Reference Linos and West2003). While valuable, previous literature has not systematically investigated the relevance of ideology for the case of UBI. Yet, ideology might a priori be especially relevant for the UBI as the scheme attracts not only support from both the political Left and Right but has also historically divided the Left (see also Chrisp and Martinelli (Reference Chrisp, Martinelli and Torry2019) and the contributions in Van Parijs, Reference Van Parijs2018a)).
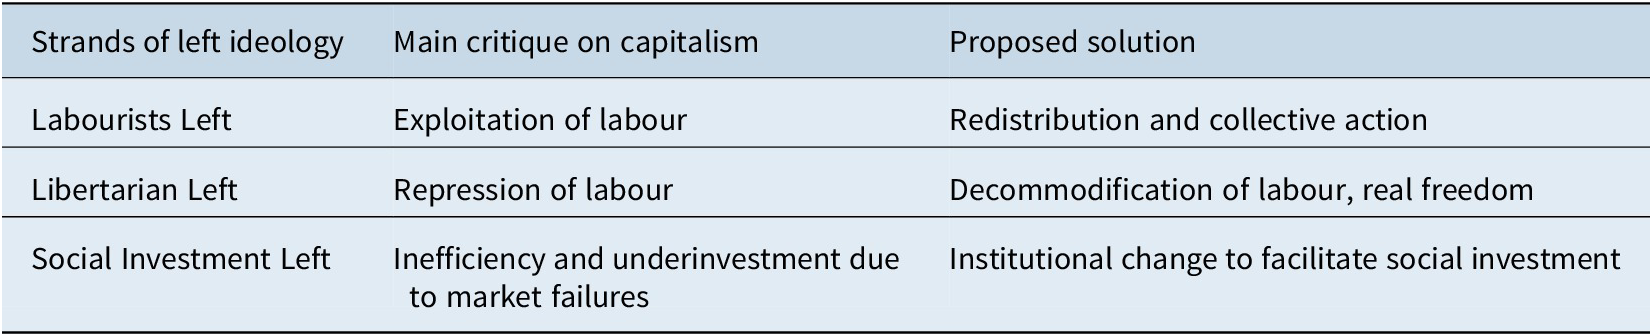
In sum, disentangling and explaining variation in support for UBI within the Left are the contributions of the article. We explore the question of variation in left-wing support for the UBI by focusing on the nature of the Left’s criticism about capitalism. The desire to change capitalism is the defining difference between the political Left and Right. We posit that the reasons why the Left wishes to change capitalism shape its attitudes towards UBI. To do so, we conceptualize three strands of left ideology: Labourist, Libertarian and Social Investment. The Labourist Left’s primary criticism of capitalism focuses on its exploitative nature, and it wishes to redress this issue primarily through collective action and redistribution. The Libertarian Left’s main issue is instead the repression of labour and its “unfreedom” in a capitalist system, and it sees labour’s decommodification as the solution. The Social Investment Left emphasizes that laissez-faire capitalism might be inefficient as it is prone to market failures so that intelligently designed welfare institutions can overcome these market failures to the benefit of the individual citizen.
Building on insights from political theory literature on UBI, we hypothesize that the Libertarian Left is most favourable towards UBI because it would decommodify citizens and therefore maximize individual freedom. By contrast, the Labourist Left should be skeptical towards UBI because it changes nothing to the underlying exploitative nature of capitalism. Drawing on the welfare state literature, we expect those who are favourable to social investment to support UBI.
After a brief review of the existing political economy literature on support for UBI in the next section, we develop our hypotheses about how different concerns with capitalism result in varying support for UBI within the Left. We then present and discuss our results in the empirical section: logistic regressions indicate that support for UBI does indeed vary within left-wing citizens. Consistent with expectations from the welfare state literature, left-wing respondents with efficiency concerns about the market are more supportive of UBI. However, and contrary to expectations from political theory literature on UBI, our results suggest that being concerned about the exploitation of labour is positively correlated with support for UBI, whereas repression concerns are negatively correlated with support.
Theoretical framework
The basic income and the three strands of left ideology
This article focuses on variation in support for the basic income among politically left-leaning individuals. While UBI is generally more popular among left-leaning citizens (Lee, Reference Lee2018; Parolin & Siöland, Reference Parolin and Siöland2020; Vlandas, Reference Vlandas2020), the reluctance of trade unionists to embrace UBI is prima facie puzzling, and the heated debate about the merits and dangers of a UBI within the Left calls for further investigation (see for instance the contributions in Van Parijs, Reference Van Parijs2018a). We start by defining what we mean by the political Left. Notwithstanding many ideological differences within the Left (see Kitschelt, Reference Kitschelt1994; March, Reference March2011; Przeworski & Sprague, Reference Przeworski and Sprague1986),left ideologies united around the goal of achieving social justice. The Left emphasizes equality of outcomes and opportunity and favours state intervention to achieve these goals. Hence, on the equality-freedom dimension, they side with equality, which goes along with skepticism about laissez-faire capitalism (Giddens, Reference Giddens1998; Rothstein, Reference Rothstein and Van Parijs2018). Another left criticism concerns the constraining effect of capitalist societies on individual autonomy (Kitschelt, Reference Kitschelt1988). The notion of social justice therefore goes beyond material equality but encompasses the positive individual freedom to live the life one chooses.Footnote 2
Our argument focuses on the most important source of criticism against laissez-faire capitalism voiced by different left ideologies. Our starting point is van Parijs’ (Reference Van Parijs and Van Parijs2018b, p. 2) differentiation between the Labourist and the Libertarian Left. Building on the welfare state literature, we add a newer third strand of Left ideology, the Social Investment Left (Giddens, Reference Giddens1998; Hemerijck, Reference Hemerijck2018; Jenson, Reference Jenson, Bonoli and Natali2012) because it is analytically distinct from both Labourist and Libertarian Left.
Labourist Left
The Labourist Left’s main criticism of capitalism is the exploitation of labour by capitalists, who appropriate parts of the profit that should rightfully belong to workers. As Werner Sombart notes, Labourists glorify the value of work (cited in Van Parijs & Vanderborght, Reference Van Parijs and Vanderborght2017, p. 193). In this view, the main solution to address the “moral entitlement” of workers to the fruits of their commodification is a massive redistribution of national income and wealth. This is also the main reason why Labourists remain reluctant to support UBI. Rather than “the right to income,” they prioritize the “right to work” (Van Parijs, Reference Van Parijs2018c). As UBI appears as a threat to the right to work (Michel, Reference Michel2000; Steinvorth, Reference Steinvorth2000), it also threatens individual recognition (Krebs, Reference Krebs2000; Michel, Reference Michel2000), merely compensating social and economic exclusion (Anderson, Reference Anderson2000; Hassel, Reference Hassel and Van Parijs2016) instead of addressing its root cause.
Labourists also contest that UBI would reduce unemployment (Steinvorth, Reference Steinvorth2000), poverty or income inequality (Navarro, Reference Navarro and Van Parijs2018). Historically, there has never been a close link between technological progress, productivity and the demand of labour questioning the necessity of a basic income (Navarro, Reference Navarro and Van Parijs2018). Rather, they identify political factors, specifically capital–labour relations, as the main channel through which productivity gains translate into additional available jobs and call for continuing the organized political struggle for better work conditions, fair remuneration and effective fiscal and redistributive policies to fight inequality and poverty (Navarro, Reference Navarro and Van Parijs2018).
Moreover, UBI could quickly assume the function of a subsidy to low-paid work or an open door to “mini-jobs” (Mestrum, Reference Mestrum and Van Parijs2018, p. 24), a concern Labourists have voiced in the past with respect to in-work and minimum income benefits as well (Vlandas, Reference Vlandas2013a and Reference Vlandas2013b). UBI might also challenge the established combination of work-related programmes and income transfers related to specific conditions.
Finally, Labourists also have strategic reasons to oppose a scheme unrelated to employment. Social democratic parties and trade unions, which often follow a Labourist logic have strong stakes in the social insurance systems that form the bulk of most of today’s welfare states. They were not only the initiators of such schemes but are still closely involved in the management of these schemes (Van Parijs, Reference Van Parijs2018c).
Libertarian Left
In contrast to Labourist Left, left Libertarians focus less on the exploitation of labour but are concerned with freedom as a requirement for a just society (Powell, Reference Powell2012; Van Parijs, Reference Van Parijs1995). In this perspective, capitalism is therefore seen as a repressive system that forces individuals to commodify themselves on the labour market. To quote Van Parijs (Reference Van Parijs and Vanderborght2017, p. 1): “many, despite being formally free, have no other real option than to sell their labour power to the owners of capital.”
The first step in Van Parijs’ argument posits that the promotion of real freedom is a requirement for real justice. In a free society, individuals ought not only to have the rights connected with self-ownership (“formal freedom”) but in addition, “each person [should have] the greatest possible opportunity to do whatever she might want to do” (Van Parijs, Reference Van Parijs1995, p. 25). At the core of libertarianism is the view that all adult members of a society have the absolute right to dispose as they wish of their own persons and of the goods they have legitimately acquired (Van Parijs & Vanderborght, Reference Van Parijs and Vanderborght2017, p. 119). In the question of how natural resources (as the source of all goods) can be legitimately appropriated lies the differences between right and left Libertarians: the first invoke a “first come, first served” principle, while the Libertarian Left believes that all natural resources are ultimately distributed equally between mankind (Van Parijs & Vanderborght, Reference Van Parijs and Vanderborght2017, p. 120). Crucially, leftLibertarians such as van Parijs consider access to good jobs as such a natural resource for which compensation has to be paid. In affluent societies with involuntary unemployment and “job envy,” good jobs undoubtedly represent attractive resources because they provide additional income, social standing, job satisfaction and so on. In turn, in these societies, the payment of the highest possible share of unearned external resources due to each equally entitled person would result in a substantial UBI.
The introduction of a significant UBI would clearly boost the real freedom of those with the least options. For instance, they would then be in a position to pursue education, child caring, surfing, writing, etc., without fear of starvation. They would also be free to engage in paid work even at a low-wage work without worrying that they will earn their way out of their basic income (Van Parijs, Reference Van Parijs1995, pp. 35–38). Today and even more so in times of a global pandemic, this argument has become more compelling: the possibility of a “future without work” justifies the need to substitute work with a basic income because there will simply not be sufficient work (Navarro, Reference Navarro and Van Parijs2018).
Moreover, a basic income would force employers to create more acceptable and less demeaning types of work because no one would be compelled to work. The elimination of routine forms of employment, which provides little enrichment, needing little intellectual or creative input, is highly desirable for left Libertarians. Individuals should be enabled to be (re)educated and (re)trained for more socially useful activities in caring services or more challenging and fulfilling tasks (cf. Zwolinski, Reference Zwolinski2013). A basic income frees individuals from being subjected to humiliating and/or demeaning income or means-testing procedures by public officials. From current discussions on old-age poverty in Germany, we know for instance that up to a third of those entitled to supplementary benefits do not take them, partly because they do not know about their existence, but also because they resent the humiliating means-testing process (Sueddeutsche Zeitung, 20th September 2019).
From a feminist perspective, UBI also liberates women from their dependence on the male breadwinner (Chrisp & Martinelli, Reference Chrisp, Martinelli and Torry2019) and contributes to a more equal sharing of domestic responsibilities (Wilson, Reference Wilson and Van Parijs2018, p. 62).Footnote 3 This speaks to the repression concerns that left Libertarians voice against laissez-faire capitalism and centralized bureaucracies that go beyond material equality. Socially progressive movements such as the women’s movement or the Pro-lesbian-gay-bisexual-trans-queer-persons (LGBTQ) movement were historically closely linked with left Libertarians (Kitschelt, Reference Kitschelt1988).
Social Investment Left
The main argument of the Social Investment LeftFootnote 4 for state intervention in capitalism is that the latter is prone to market failures, for instance, stemming from externalities, public goods, incomplete contracting and information problems of various kinds (Giddens, Reference Giddens1998; Keman, Reference Keman2011; Vandenbroucke, Reference Vandenbroucke and White2001). A pure market logic therefore does not incentivize sufficient long-term investments that yield to personal development and economic growth. The following examples illustrate this argument: although post-industrial economies need skilled and trained workforces, citizens will not always invest in – or just maintain – their human capital but instead often choose to forego training in favour of short-term income if they fear about making ends meet. Another example concerns imperfect capital markets, which prevent individuals from borrowing the individually and socially optimal amount for investments in human capital. Fear of losing basic security also results in short-term and short-sighted behaviours, whereas individuals with income security can develop long-term and, therefore, more stable, strategies. Indeed, “[t]here is more than money at stake in the poverty trap. The income poverty trap is also a security trap” (Haagh, Reference Haagh and Van Parijs2018, p. 82). Equally, insufficient child care provisions might prevent adequate investments in young children’s cognitive developments early in life with long-term adverse effects, in particular, regarding the intergenerational transmission of poverty and disadvantages (Hemerijck, Reference Hemerijck2017; Jenson, Reference Jenson, Bonoli and Natali2012).
What all these examples have in common is the idea that the state could increase the efficiency of markets through well-designed interventions (Giddens, Reference Giddens1998). Instead of promoting aggregate demand for labour via state investments to increase public or private consumption, such policies aim to increase workers’ employability by investing in their skills or increasing incentives to take up work and/or to break the intergenerational cycle of disadvantages (Hemerijck, Reference Hemerijck2018; Jenson, Reference Jenson, Bonoli and Natali2012).
The basic income creates an income floor which helps to motivate long-term investment strategies. UBI can for instance motivate a person to return to education and support long-term labour market integration. In line with the social investment ideology, a basic income, therefore, has a preventive and active function, in particular, as it does not reduce employment incentives but might motivate individuals to look for “better work.” In a life course perspective, social investment policies have the function to enable individuals to prevent and overcome difficult life events and life transitions without losing their capacity to support themselves economically (Kvist, Reference Kvist, Deeming and Smyth2017). UBI will fulfil precisely this function. The basic income is part of a systemic change of social rights in relation to welfare and work incentivizing individuals in a sustainable, long-term and preventive manner and helps to create, strengthen, maintain, re-establish and use individuals’ capabilities and skills (see Garritzmann et al., Reference Garritzmann, Häusermann and Palier2021, p. 6). We, therefore, expect that the Social Investment Left would support a basic income as it allows individuals to develop long-term personal strategies.Footnote 5 Table 1 summarizes the main differences of the three strands of left ideology.
Variation within the Left.

Data, methods and results
To test our expectations, we rely on the eighth wave of the European Social Survey (ESS) which includes the following question about support for UBI:
Some countries are currently talking about introducing a basic income scheme. Are you against or in favour of this scheme? A basic income scheme includes all of the following: (1) The government pays everyone a monthly income to cover essential living costs; (2) It replaces many other social benefits; (3) The purpose is to guarantee everyone a minimum standard of living; (4) Everyone receives the same amount regardless of whether or not they are working; (5) People also keep the money they earn from work or other sources; (6) This scheme is paid for by taxes.
Our dependent variable measures support for UBI by coding it 1 if respondents choose “in favour” or “strongly in favour” of the scheme and 0 otherwise. We use the Left–Right self-placement 11-points scale of the ESS to identify left-wing citizens by creating a dichotomous variable: 0–4 on the Left–Right scale is coded 1 to capture the Left, while other values are coded 0. Using this variable, we restrict our sample to left-wing respondents. The ESS does not include specific questions on concerns about capitalism, but it does include questions that allow us to create proxies of these concerns. Specifically, following our theoretical framework that distinguishes three types of concerns about capitalism, we identify a number of questions on attitudes toward redistribution, inequality, freedom and social investment to map out the different dimensions in the attitudes that left-wing individuals display in their criticisms of capitalism:
-
• Pro-redistribution We rename the ESS variable gincdif “pro-redistribution” because it captures whether respondents think that governments should reduce differences in income levels.
-
• Pro-equality. The second variable smdfslv, which we rename “pro-equality,” asks whether for “a fair society differences in standard of living should be small.”
-
• Equal opportunity and being free. The third and fourth variables ask respondents about whether it is important (1) that “people are treated equally and have equal opportunities” and (2) “to make own decisions and be free.”
-
• Pro-LGBTQ The fifth variable aims to capture cultural liberalism by the respondents’ agreement to the statement “Gays and lesbians free to live life as they wish.”
-
• Pro-childcare and pro-parents. The sixth and seventh variables are based on two questions in concerning childcare and work–life balance, both of which have been shown to be key to the social investment paradigm (Ansell & Gingrich, Reference Ansell, Gingrich, P., S., H. and H.P.2015; Hemerijck, Reference Hemerijck2017; Morel et al., Reference Morel, Palier and Palme2012). Respondents choose value from (1) to (4) about the preferred degree of government responsibility. We call this variable “pro-childcare.” The second variable is about whether there should be benefits for parents to combine work and family even if it means higher taxes. We call this variable “pro-parents.”
-
• Pro-unemployed education. Our eighth variable asks respondents whether they would spend more on education for unemployed at the cost of unemployment benefits.
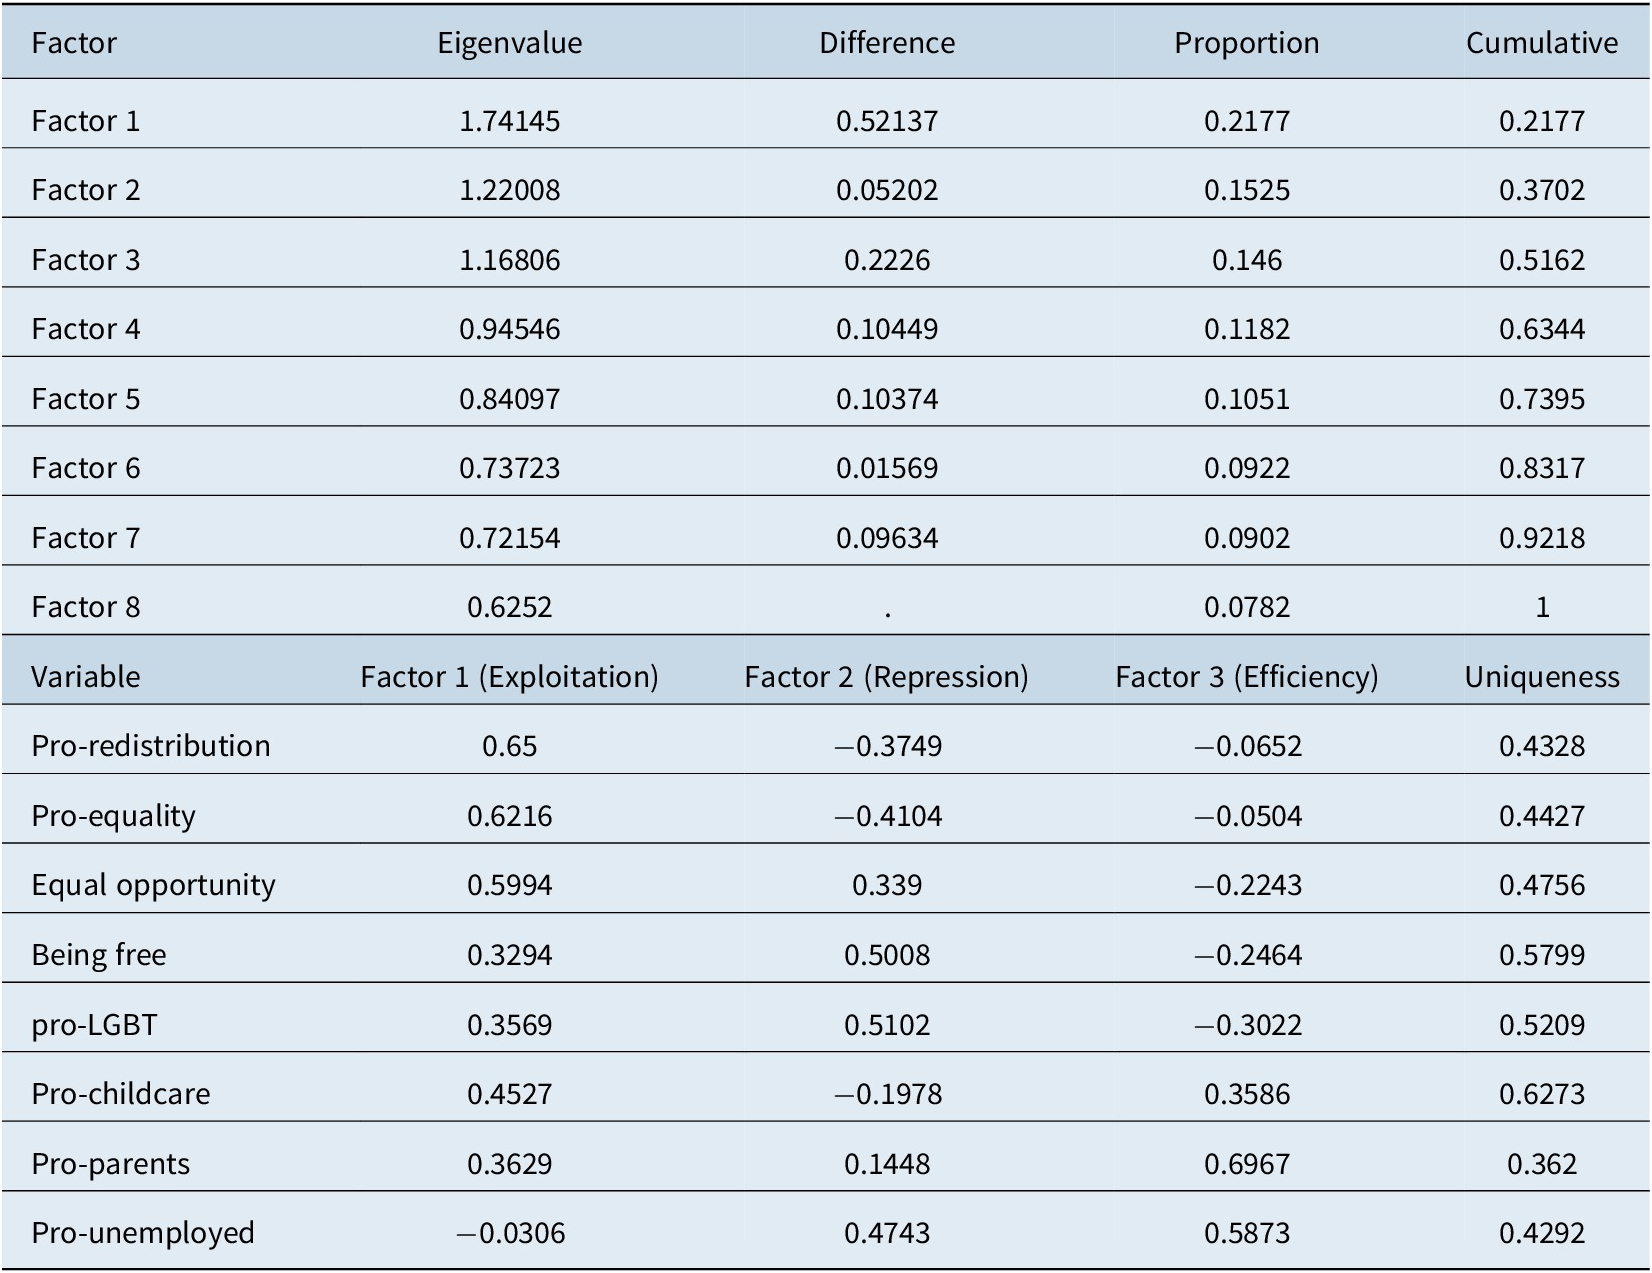
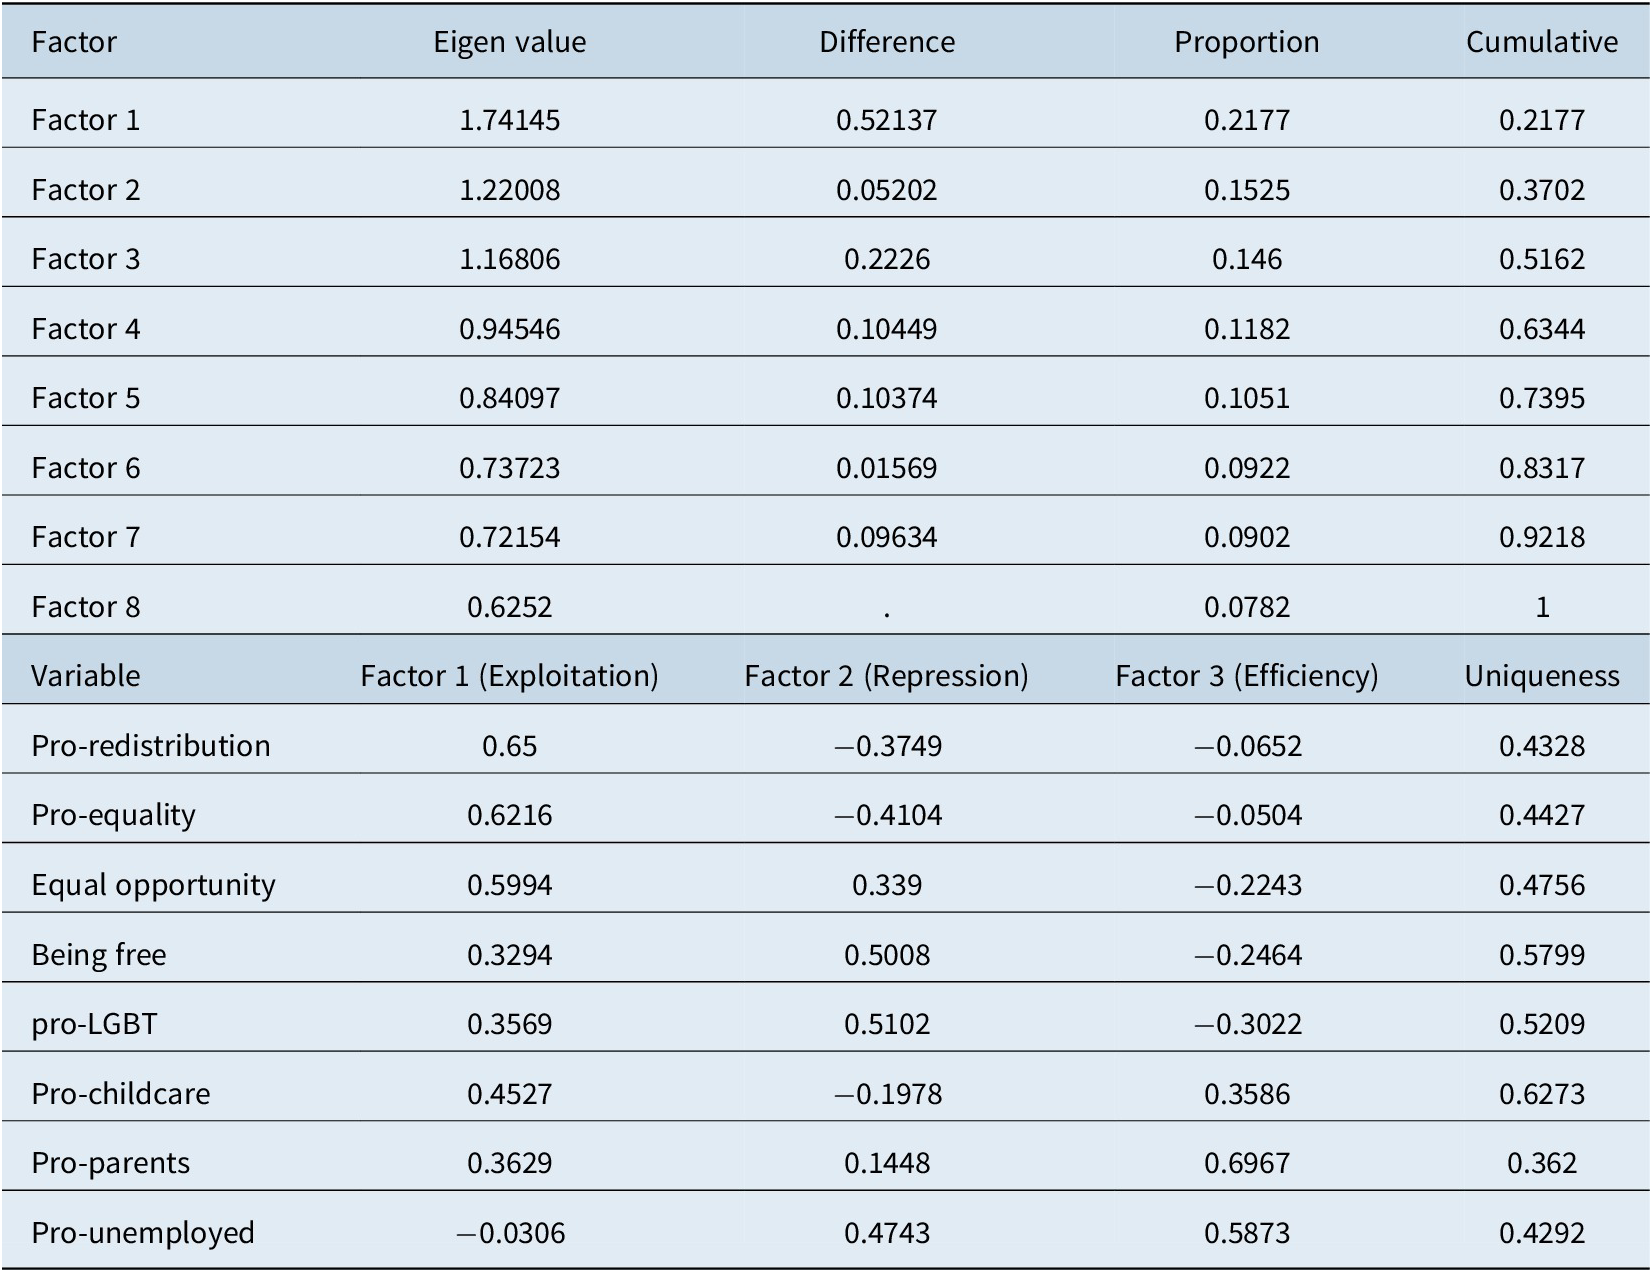
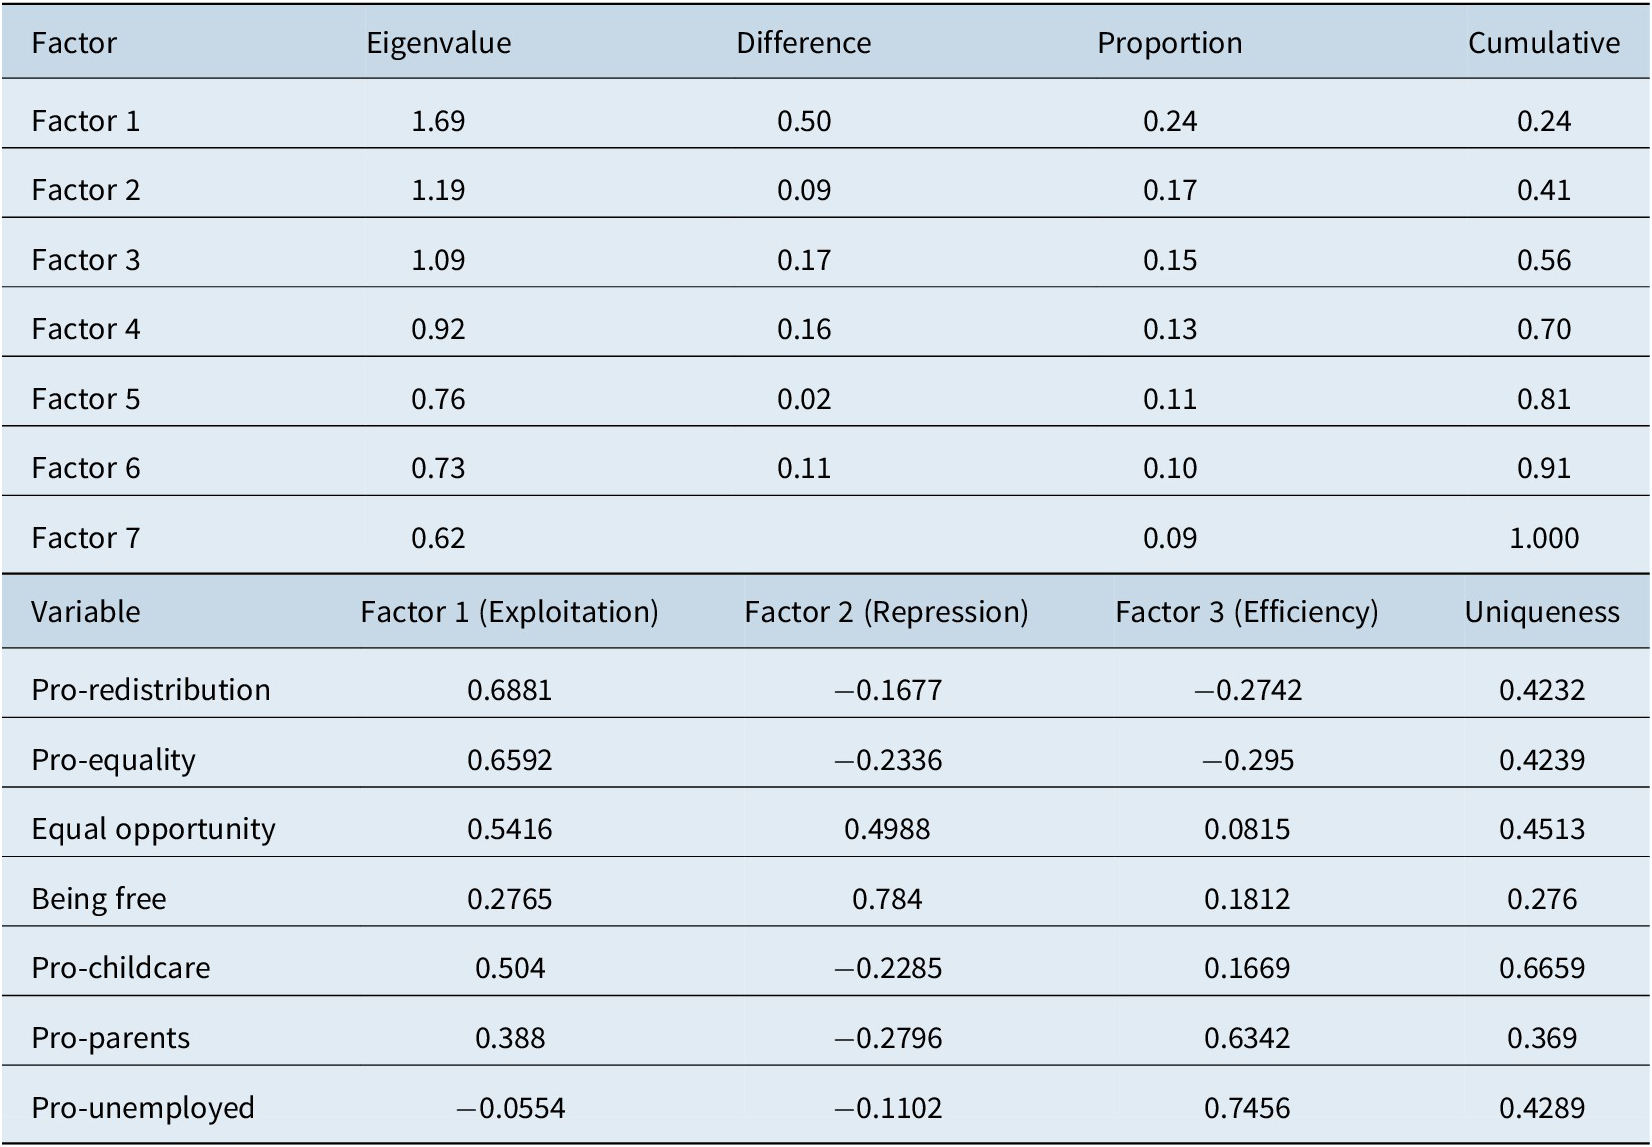
All variables are coded in a way that higher values mean stronger agreement. We run a factor analysis that inductively extracts factors from these different variables thereby allowing us to identify latent ideology dimensions within the Left. The factor analysis on these eight variables identifies three different factors (indicated by the three factors with eigenvalues above 1 in Table 2) which we associate with different left-wing ideologies.
Factor analysis on Left-wing respondents.

Not Factor analysis/correlation; Number of observations = 9,727. Method: principal-component factors; Retained factors = 3; Rotation: (unrotated) Number of parameters = 21; LR test: independent versus saturated: χ 2(28) = 4095.54, Prob>χ 2 = 0.0000.
Factor 1 loads positively on being favourable to redistribution, equality (of outcomes and opportunities), to a lesser extent on childcare, and the least on being favourable to provide more education to the unemployed at the expense of unemployment benefits. We call this factor the exploitation factor, which speaks to the concerns of the Labourists Left since it captures people with concerns about the exploitative aspects of capitalism.
By contrast, factor 2 loads most positively on opportunities, freedom and supporting LGBT rights, as well as providing education instead of benefits to unemployed, but negatively on redistribution and equality. We call this the repression factor, which speaks to the concerns of Libertarian Left, since it captures people with concerns about the repressive nature of capitalism.
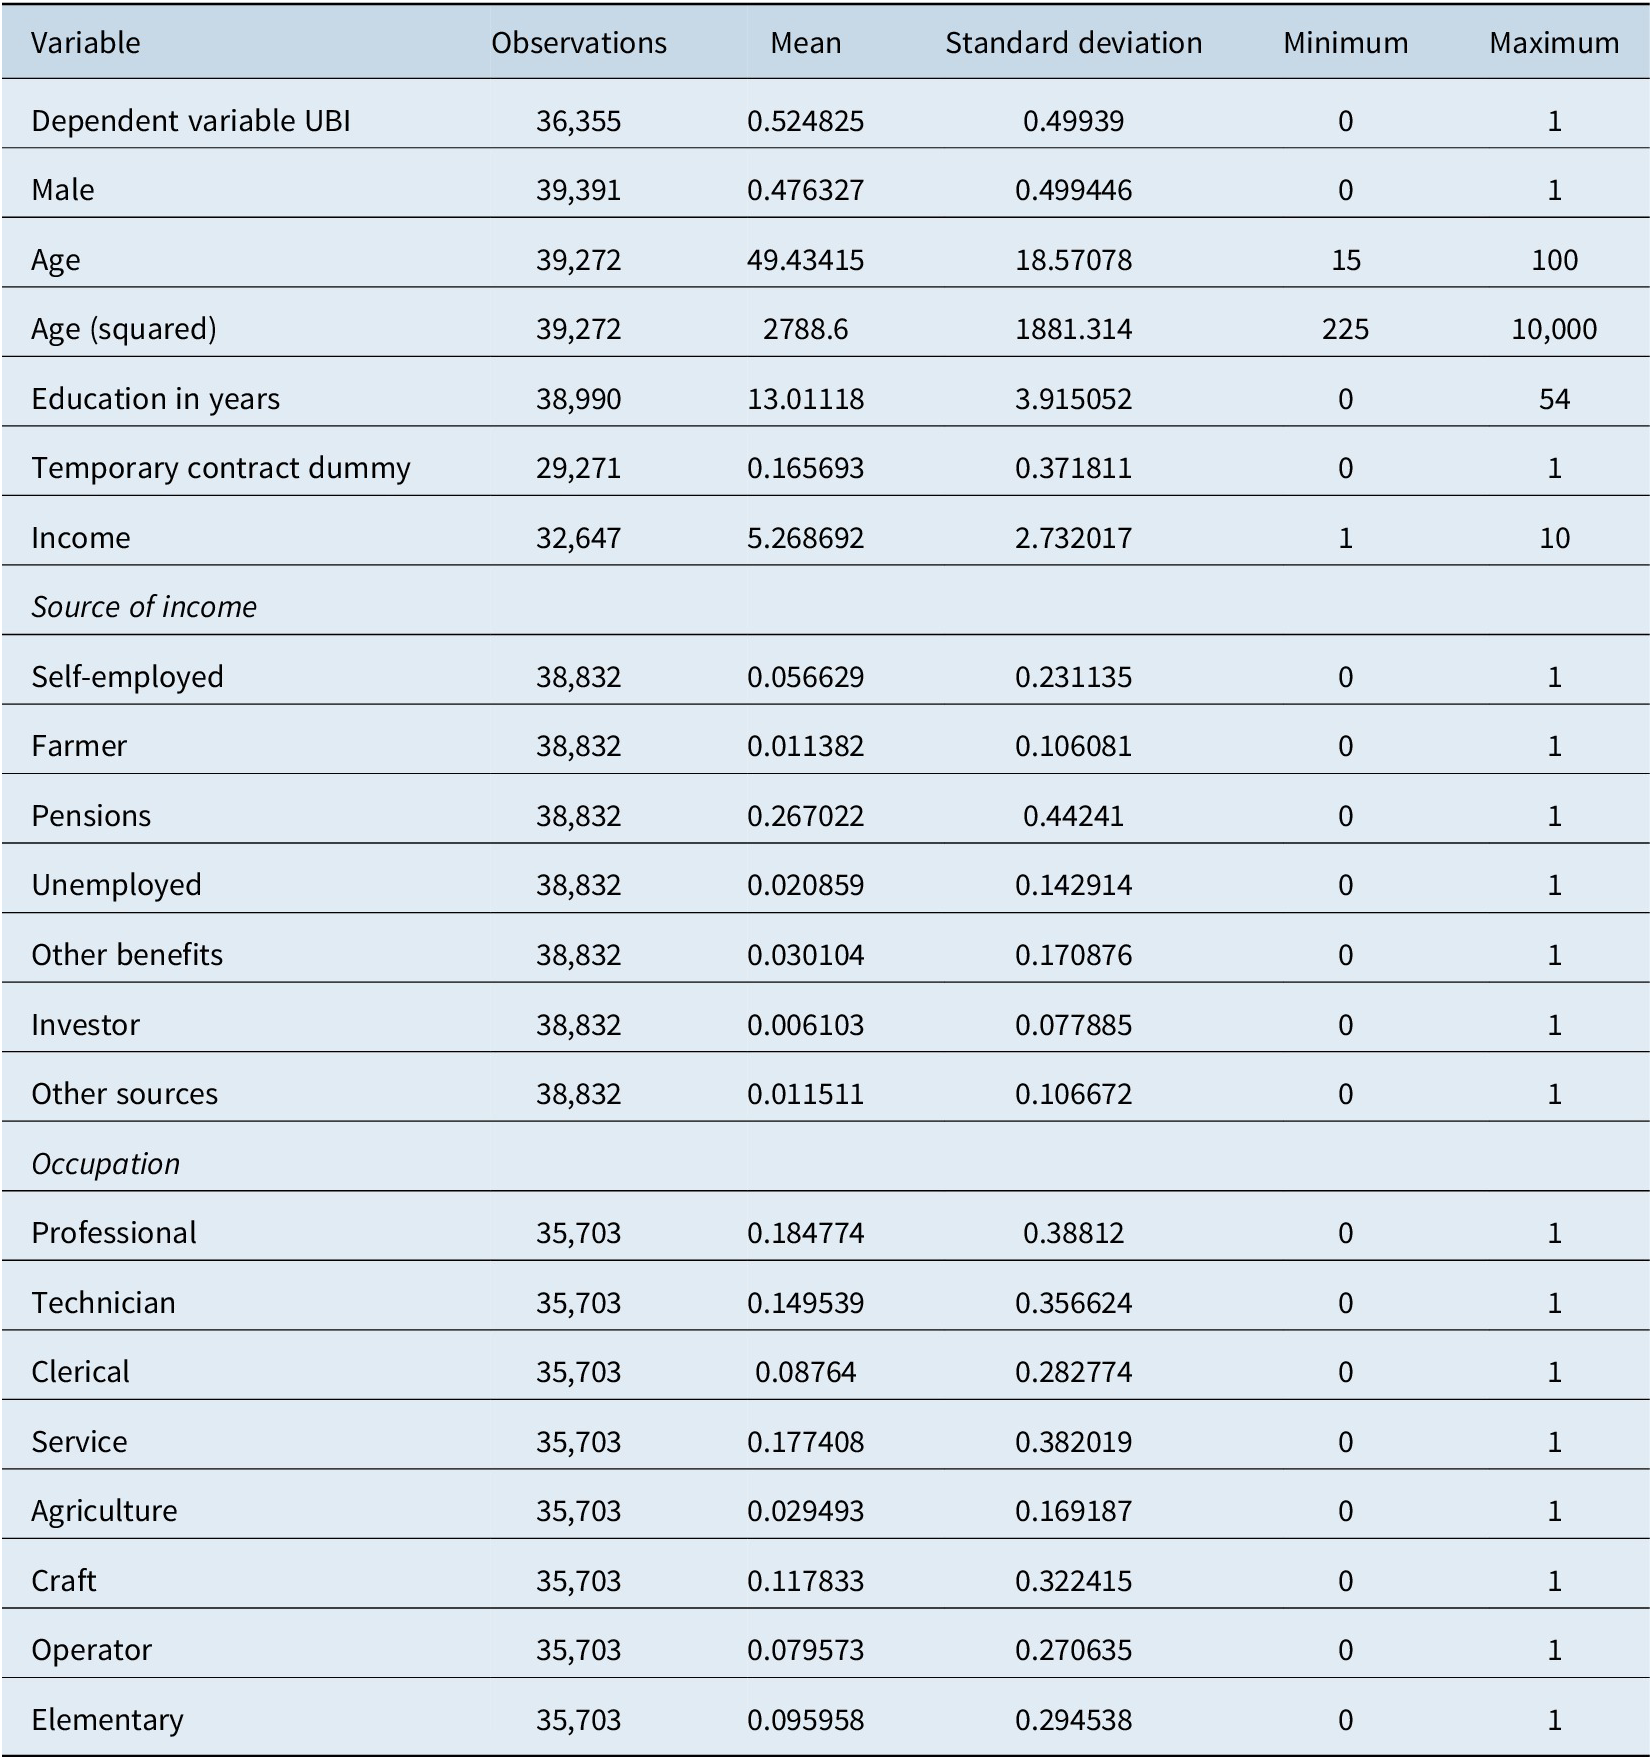
Finally, factor 3 attaches greater weight to childcare, benefits for parent and education for the unemployed at the cost of benefits but loads negatively on freedom, pro-LGBT and equal opportunity. There is also a weak negative loading with redistribution and equality. This captures pro-social investment attitudes. We call this the efficiency factor, which speaks to the concerns of the Social Investment Left. We provide summary statistics in Section A1.1 in the Appendix.
All our models include a standard set of control variables (Chrisp & Martinelli, Reference Chrisp and Martinelli2018; Lee, Reference Lee2018; Roosma & van Oorschot, Reference Roosma and van Oorschot2018): gender, age, education, income, source of income and occupations.Footnote 6 As our dependent variable is binary, we use logistic regressions but the results are robust to alternative estimation methods, see Section A3.4 in the Appendix. Since respondents are clustered in countries and there might be unobservable heterogeneity across countries, we include country-fixed effects and rely on robust errors clustered by country.
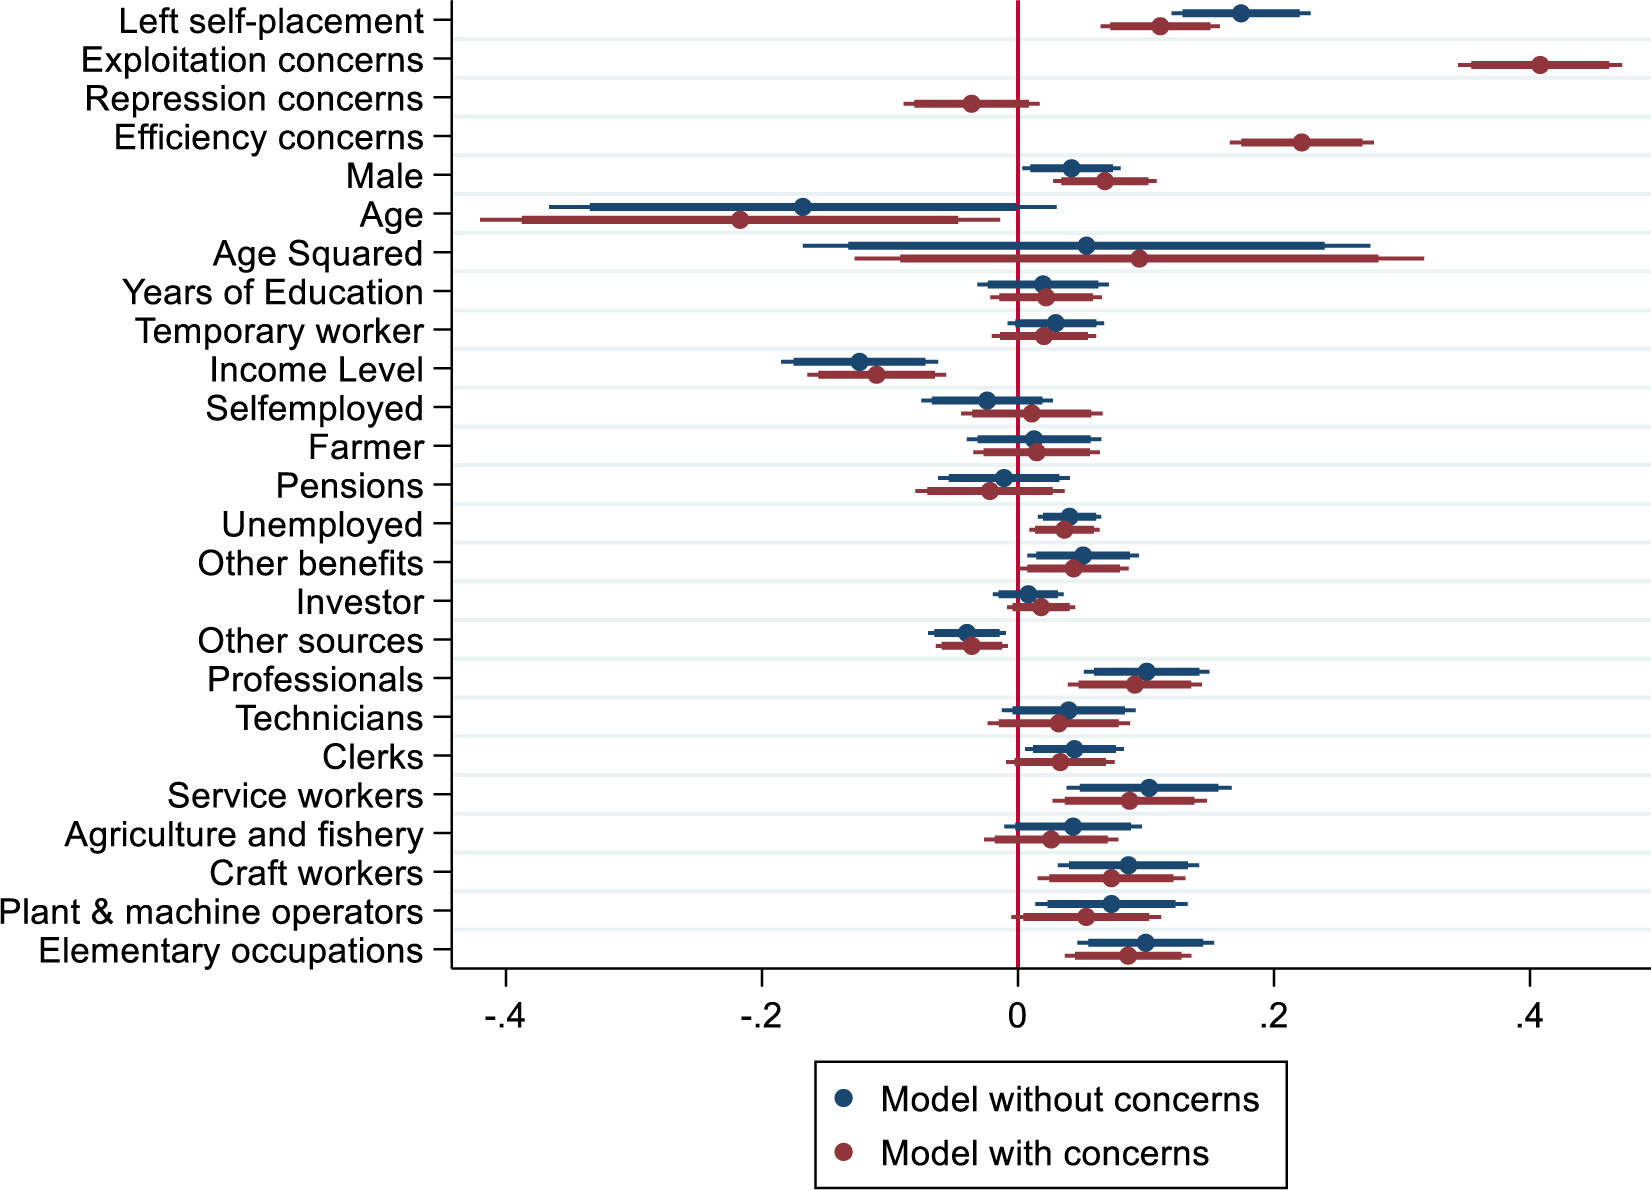
All controls in our analysis below are included but not shown (see Figure A2.2 in the Appendix for full results): male respondents are surprisingly more supportive, while low-income respondents, especially in elementary occupations, are more supportive of UBI than women and higher income earners. Age and being on a temporary work contract are not statistically significant, which is also the case for most occupational identifiers. Finally, education has a positive and statistically significant effect while most variables capturing sources of income are not statistically significant, except for the “other benefits” variable (see Table A2.3 in the Appendix).
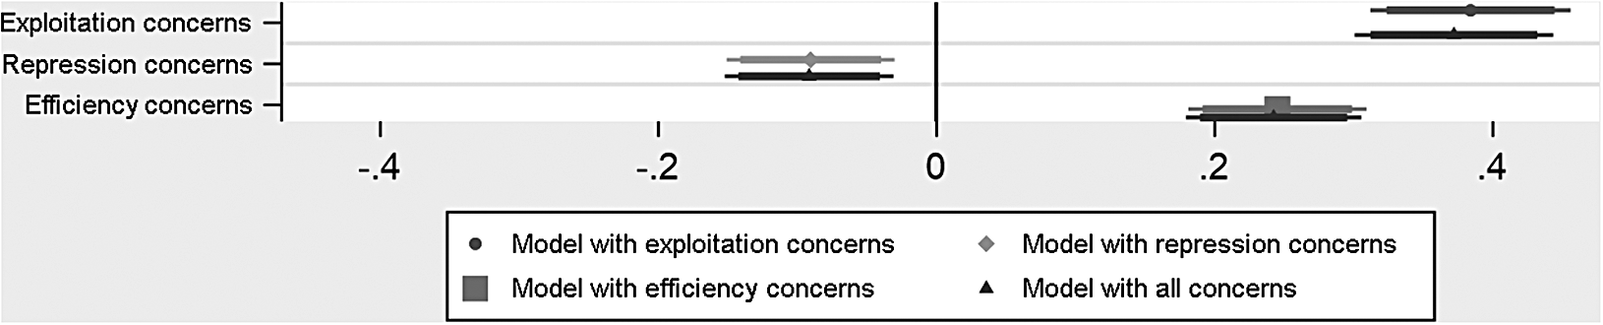
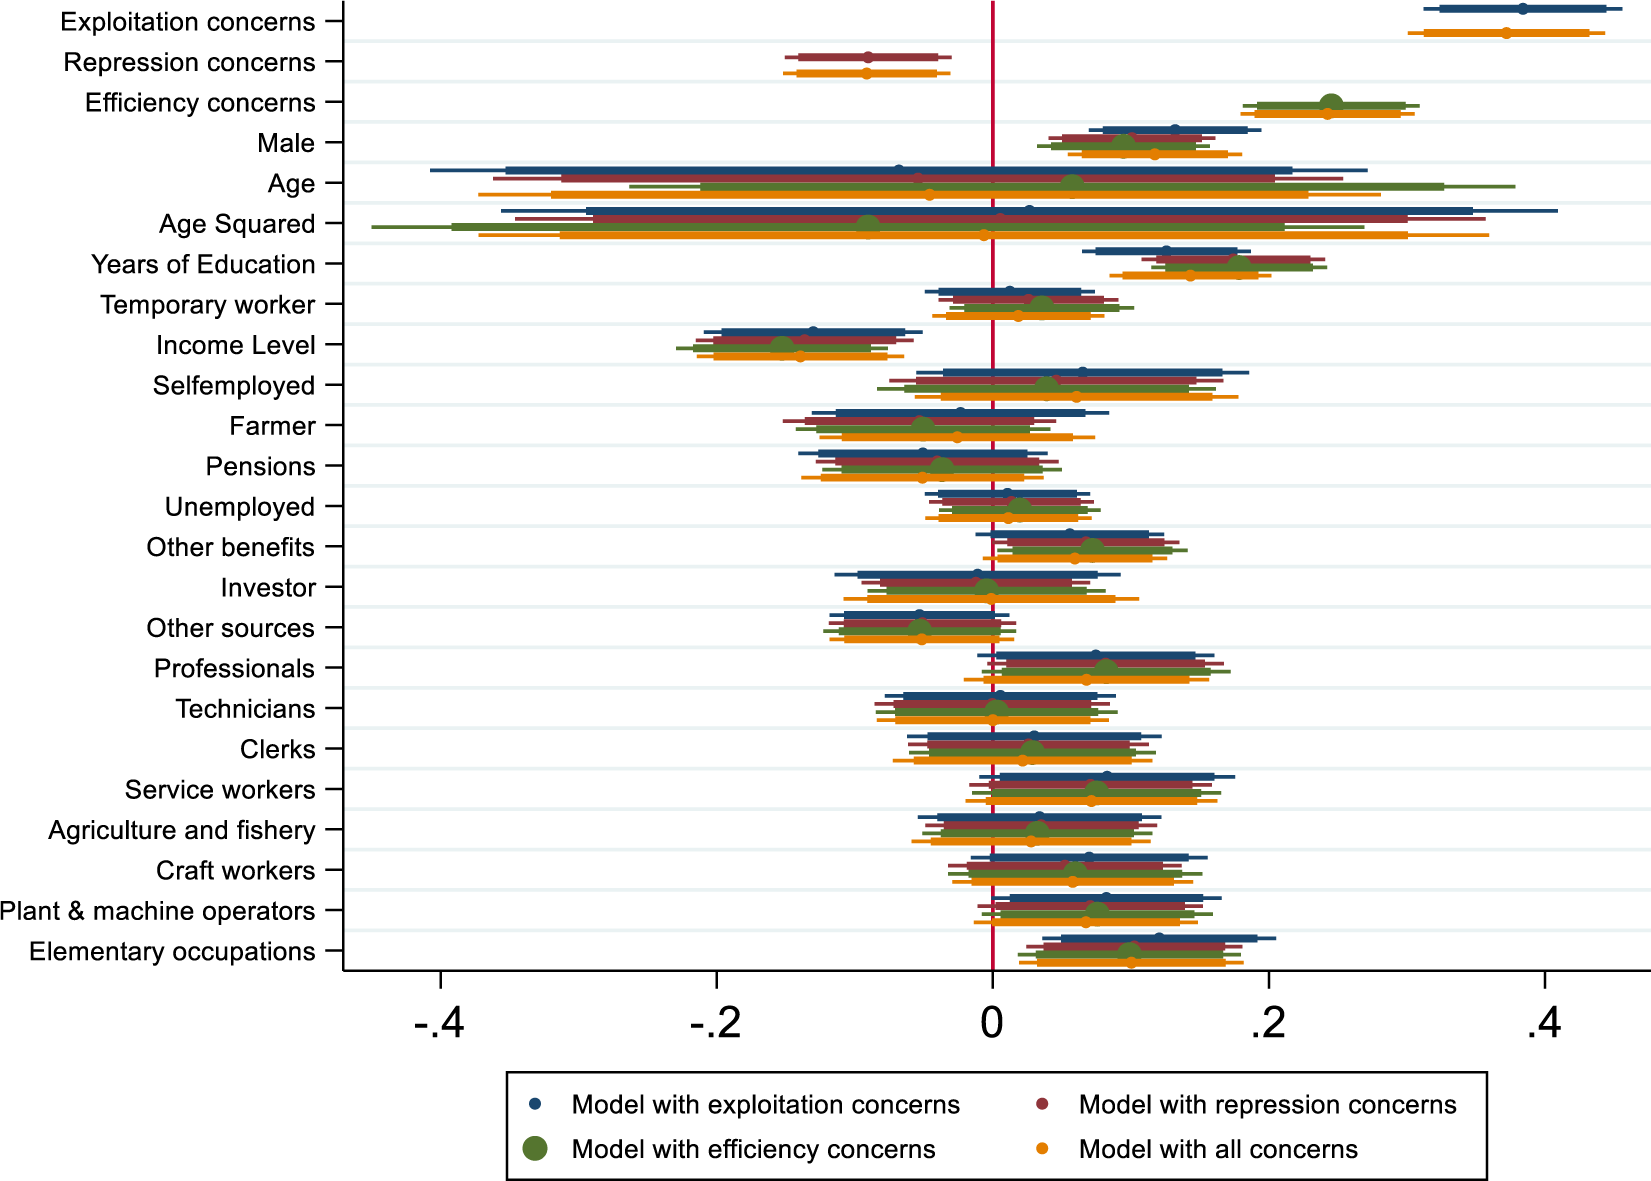
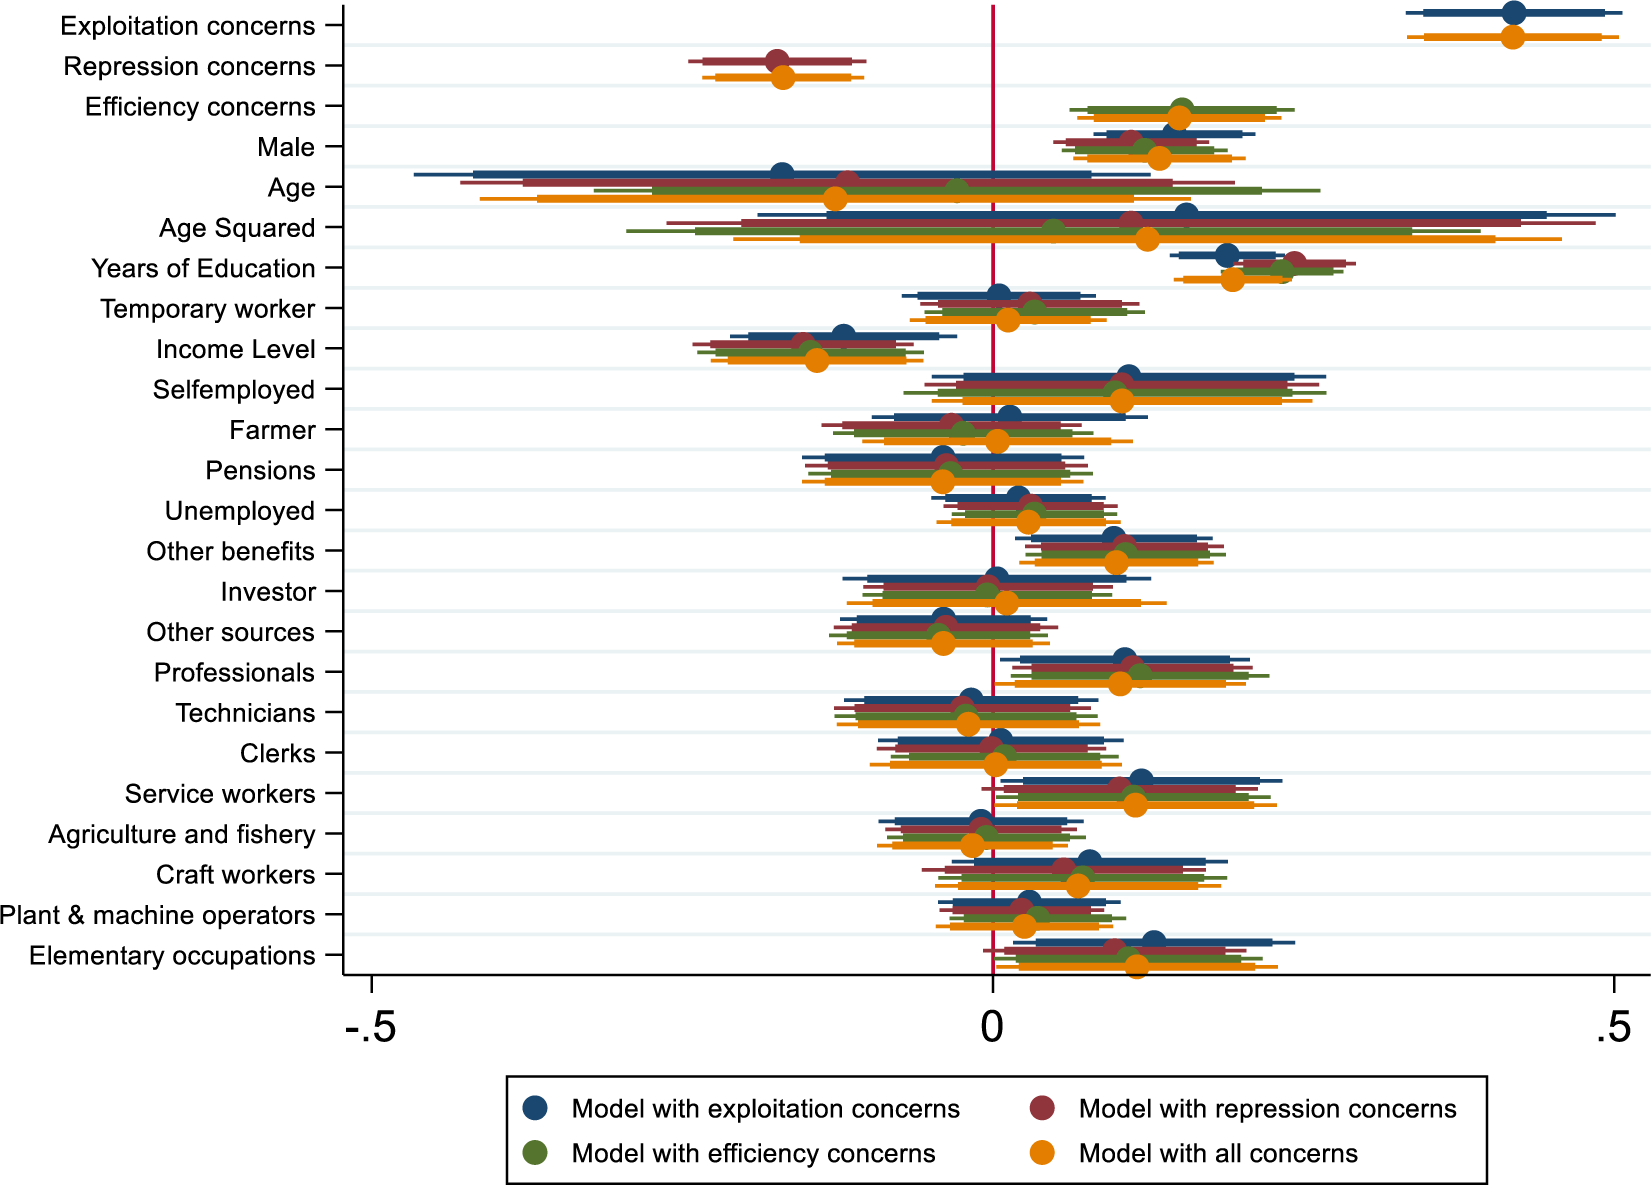
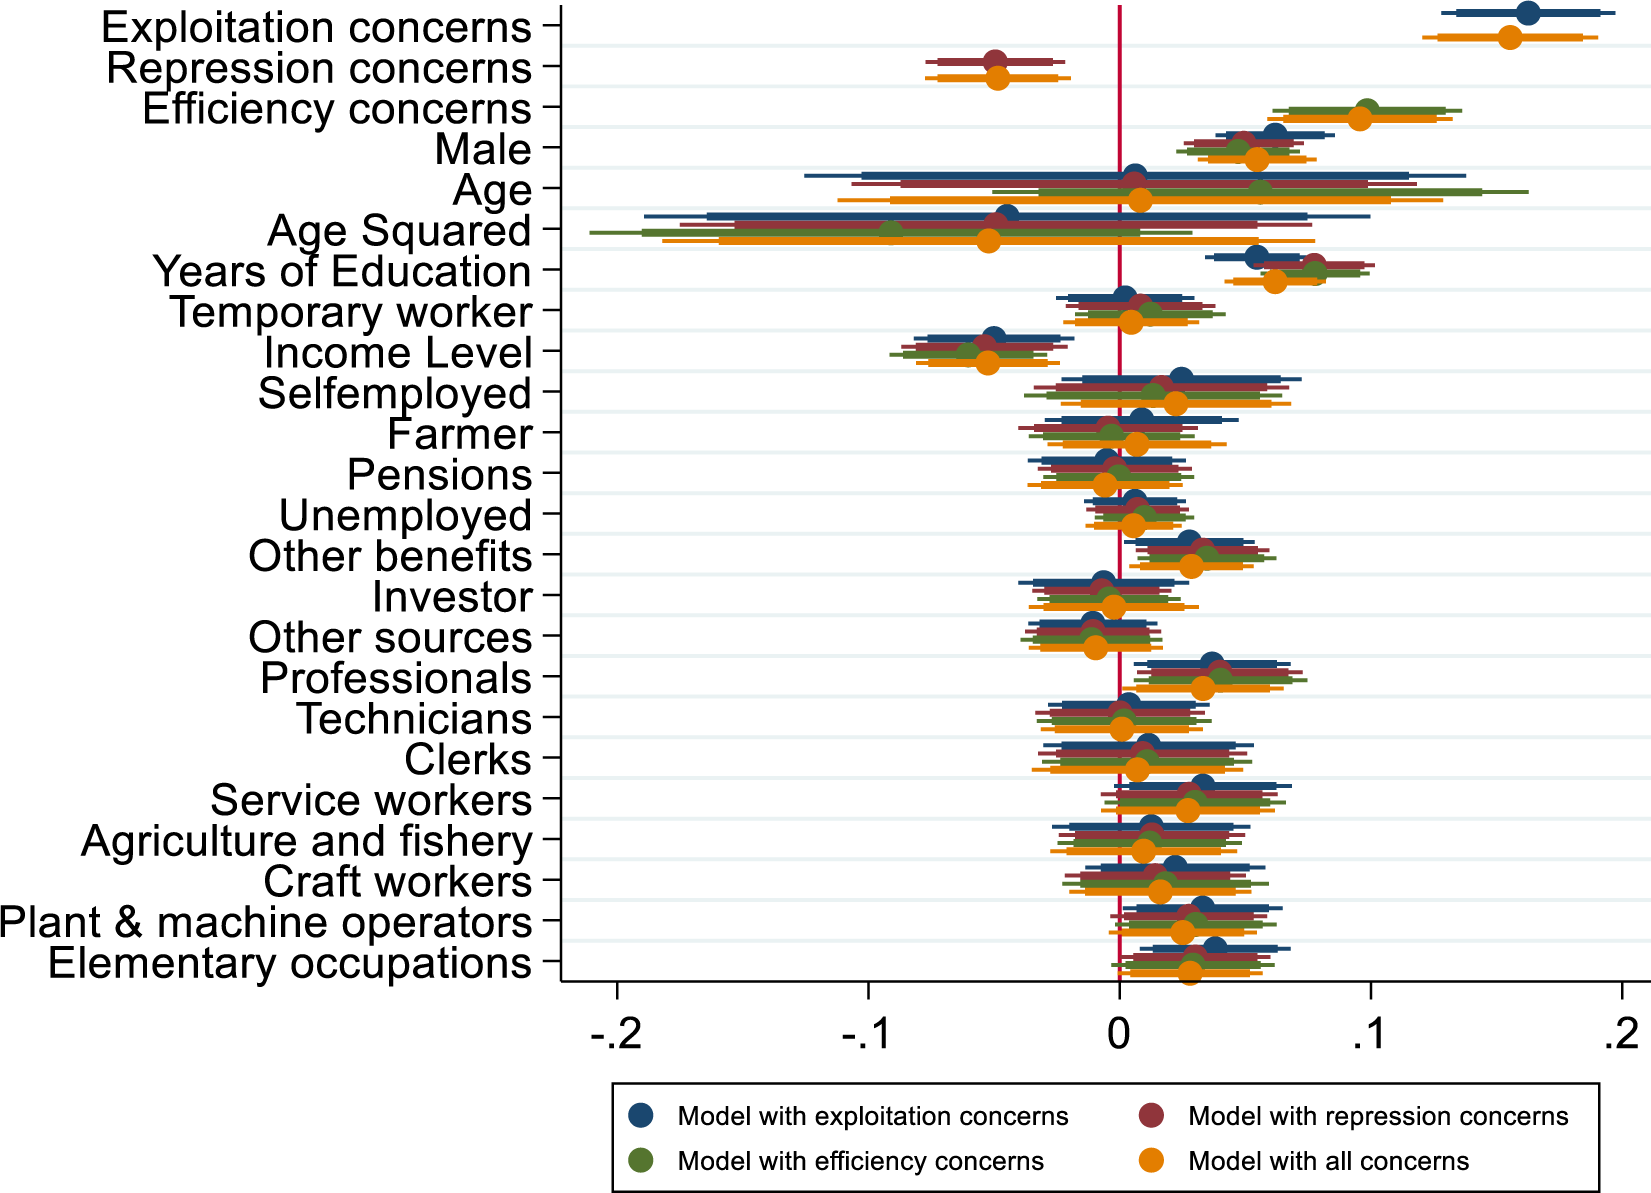
Figure 1 reports the results for four different models. The first model pertains only to exploitation concerns, the second, only to repression concerns, and the third, only to efficiency concerns, while the fourth model includes all three types of concerns together. For each model, we report the point estimate of the semi-standardized coefficients, which indicates the effect of one standard deviation change in the independent variable on the log odds of the dependent variable. Around each point estimate, we report 95% as well as the 90% confidence intervals. When these confidence intervals overlap with the vertical zero line, the variable under consideration has no statistically significant association with support for UBI.
Ideological dimensions and support for UBI among left-wing respondents. Note: The sample has been restricted to respondents who identify as left. This sample was then used to compute the factor analysis and run the above logistic regressions. Country-fixed effects are included, but not shown. Standard errors are clustered by country (90% and 95% confidence intervals), the constant is positive but not statistically significant, Log pseudolikelihood = −4,268. Countries included are as follow: Austria, Belgium, Czechia, Estonia, Finland, France, Germany, Hungary Iceland, Ireland, Italy, Lithuania, Netherlands, Norway, Poland, Portugal, Slovenia, Spain, Sweden, Switzerland and the United Kingdom. All independent variables are standardized so that they have a mean of 0 and a standard deviation of 1, which makes the magnitudes of different coefficients directly comparable. The following controls are included but not shown: age, gender, education, fixed-term contract, income level, source of income and occupation. Full results are shown in graphical form in Figure A2.2, while the full regression results in the tabular format are shown in Table A2.3, both in the Appendix.

The first model suggests that exploitation concerns among left-wing respondents have a positive and statistically significant association with support for UBI. The magnitude of the effect is large in relation to other determinants of UBI support. This finding is at odds with the expectations of political theory work on UBI which we discussed in the theoretical section (see van Parijs, Reference Van Parijs and Van Parijs2018b). Recall that exploitation concerns load strongly on pro-equality and pro-redistribution preferences, which suggest that respondents with these characteristics are more supportive of UBI and hence see this scheme as achieving these aims. This suggests that – unlike many proponents of traditional institutions of the welfare state, which tend to see these institutions as the best protection against exploitation and UBI as representing a minimalist safety net – left-wing individuals who care strongly about equality and exploitation tend to favour a UBI.Footnote 7
We suspect that this can be explained – paradoxically – by the universal and highly decommodifying character of the UBI. Given that a UBI would be paid to everyone and without conditions, it achieves a very high level of decommodification, which has been argued by power resource theorists to be necessary to reduce capitalist exploitation of labour, especially its poorest and most precarious members (Korpi, Reference Korpi2006). In a context where many social policies have been retrenched, made more conditional and recommodified (Knotz, Reference Knotz2015, Reference Knotz2018) and where dualization has especially undermined the protection of non-standard workers (Emmenegger et al., Reference P., S., B. and M.2012), the UBI’s universalist and fully decommodifying characteristics might be especially appealing. Indeed, those who are especially concerned about the exploitation of the poor also tend to be supportive, as shown by Roosma and van Oorschot (Reference Roosma and van Oorschot2020)’s finding that support for targeting benefits to the poor and for UBI is correlated.
The second model shows that repression concerns are negatively associated with support for UBI. The effect is statistically significant at the 95% level and – again – at odds with the expectations of the political theory literature on UBI. Recall that repression concerns, characteristic of the Libertarian Left, loads strongly on equal opportunity, being free and cultural liberalism but negatively on pro-redistribution and pro-equality. Given that redistribution preferences are often used as a proxy for general welfare state support, one might therefore speculate whether the two dimensions could also be interpreted as measuring a general pro-welfare state preference dimension, which loads positively with support for UBI (Parolin & Siöland, Reference Parolin and Siöland2020; Roosma & van Oorschot, Reference Roosma and van Oorschot2020; Vlandas, Reference Vlandas2020). This result suggests that those who favour equality of opportunities, equal rights for LGBT and freedom of action are largely opposed to the UBI.
One possible reason for this counterintuitive finding is that equality of opportunity may not be understood as necessitating state intervention. Another reason might be that libertarians’ dislike of state interventionism is stronger than their desire for equal opportunities. However, while this negative correlation can be observed within the Left (ie. between left-wing respondents), repression concerns are not negatively associated with UBI support once we extend our sample to the wider population to include both left- and right-leaning respondents. Indeed, Figure A4.6.1 in the Appendix clearly shows that the coefficient is no longer statistically significant once both left and right-wing individuals are included in the analysis. Thus, repression concerns are not per se associated with lower support for UBI; only left-wing respondents who have particularly high repression concerns seem less likely to support UBI compared to other left-wing respondents.
The third model shows a significant positive correlation between efficiency concerns and support for UBI. This suggests that in line with our expectation, the Social Investment Left is indeed positively related to UBI. In this view, the UBI is seen as the ideal way of promoting individuals’ ability to invest in their human capital. Roosma and van Oorschot (Reference Roosma and van Oorschot2020), whose study also finds a positive relationship between support for social investment attitudes and UBI, suggest that a UBI is perceived as a modern, innovative idea as an alternative for the current welfare state, just as social investment has been found to be perceived in other welfare state studies. The weak negative loading of this social investment factor with pro-redistribution and equality attitudes in our analysis reveals that it is possible for left-wing individuals to support UBI even if they do not care particularly strongly about egalitarianism. Note that this association holds when extending the sample to include all respondents, including both left- and right-leaning individuals (Figure A4.6.1 in the Appendix).
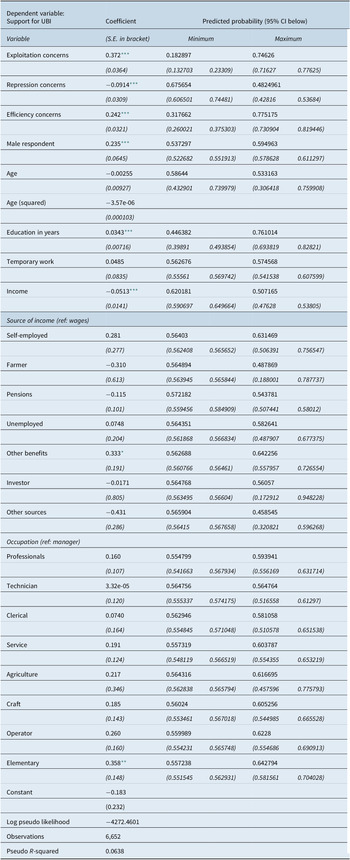
Finally, if we include all three types of concerns in the same model, the effects also remain the same. Note further that these three types of concerns have the same effect when included on their own without any controls and they have strong predictive power. Indeed, when running a logistic regression only with the three independent variables capturing left-wing traditions, the model correctly predicts almost 60% of cases correctly (count R 2 = 0.599). In Table A2.3 in the Appendix, we display the predicted probability of supporting a UBI when each independent variable is at its minimum versus maximum value. When exploitation concerns are held at their minimum value, this probability is 18% compared to 74% when it is held at its maximum value. For efficiency concerns, these numbers are 32% compared to 77%. For repression concerns, the effect is negative so that when these concerns are at their minimum value, the predicted probability is 67% compared to 48% when these concerns are at their maximum value.
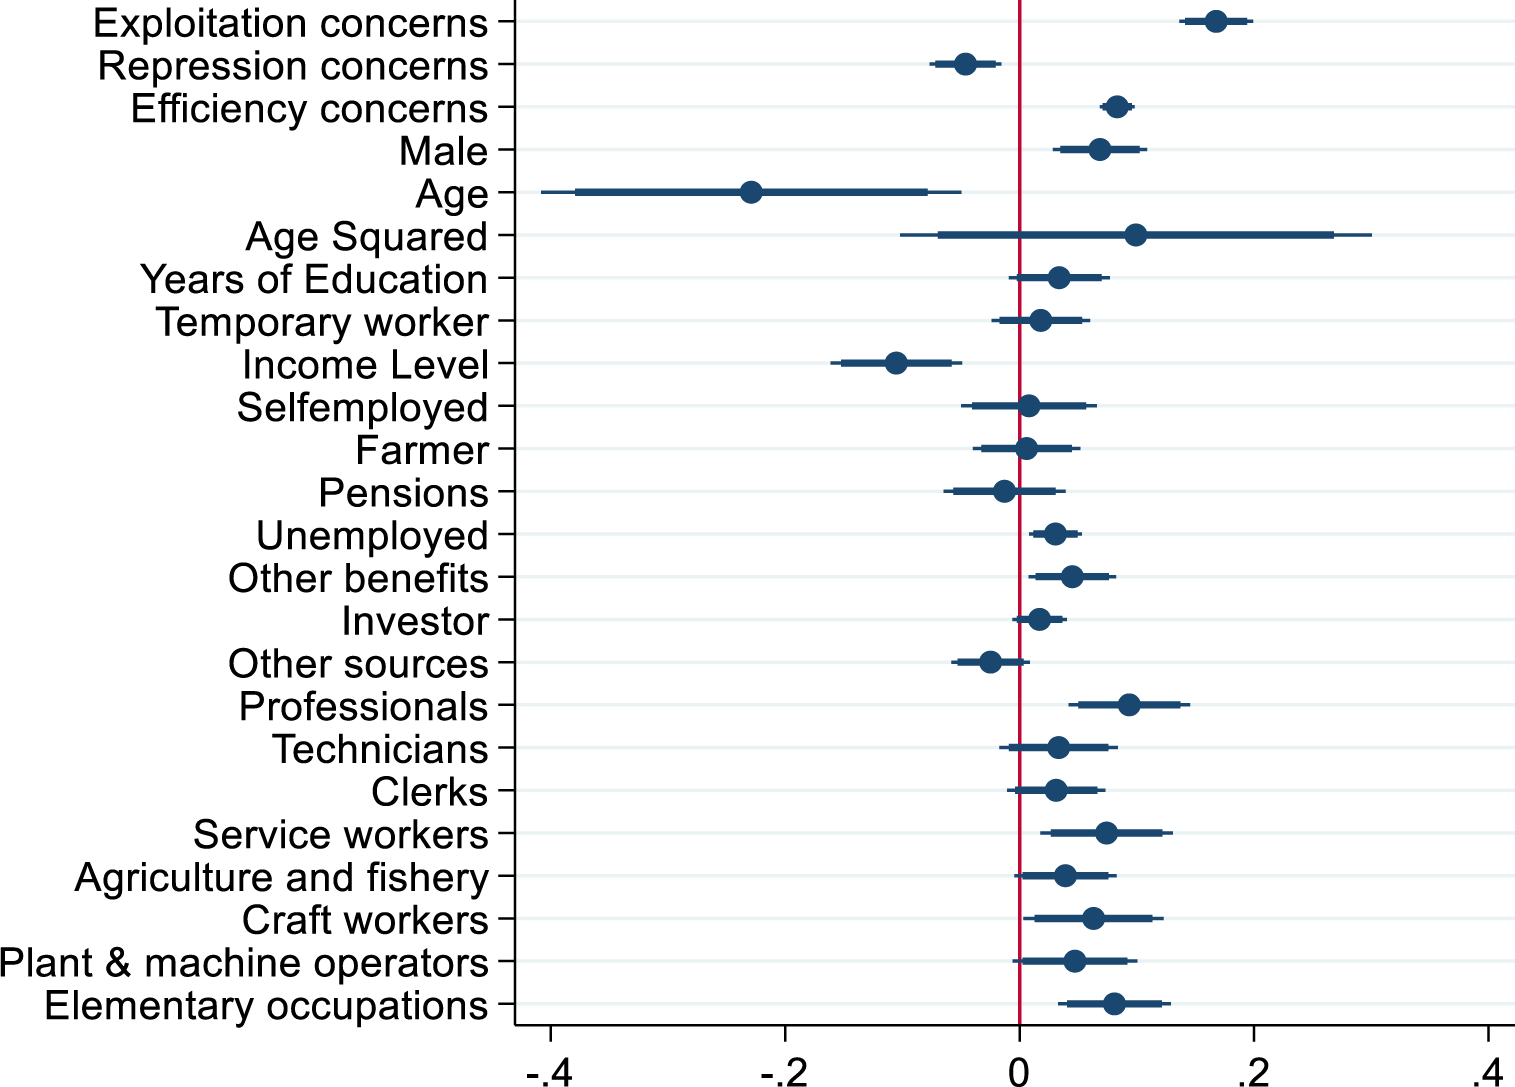
We carry out a number of robustness checks. First, we rerun our analysis without including LGBTQ rights in our factor analysis. While we strongly believe that attitudes toward LGBTQ are a core part of the Left’s political ideology, we want to provide an analysis with purely economic variables. The results, shown in Section A3.1 in the Appendix, suggest our results are robust to this alternative specification. We find the same three factors, and their effects shown in Figure A3.1.2 are the same.
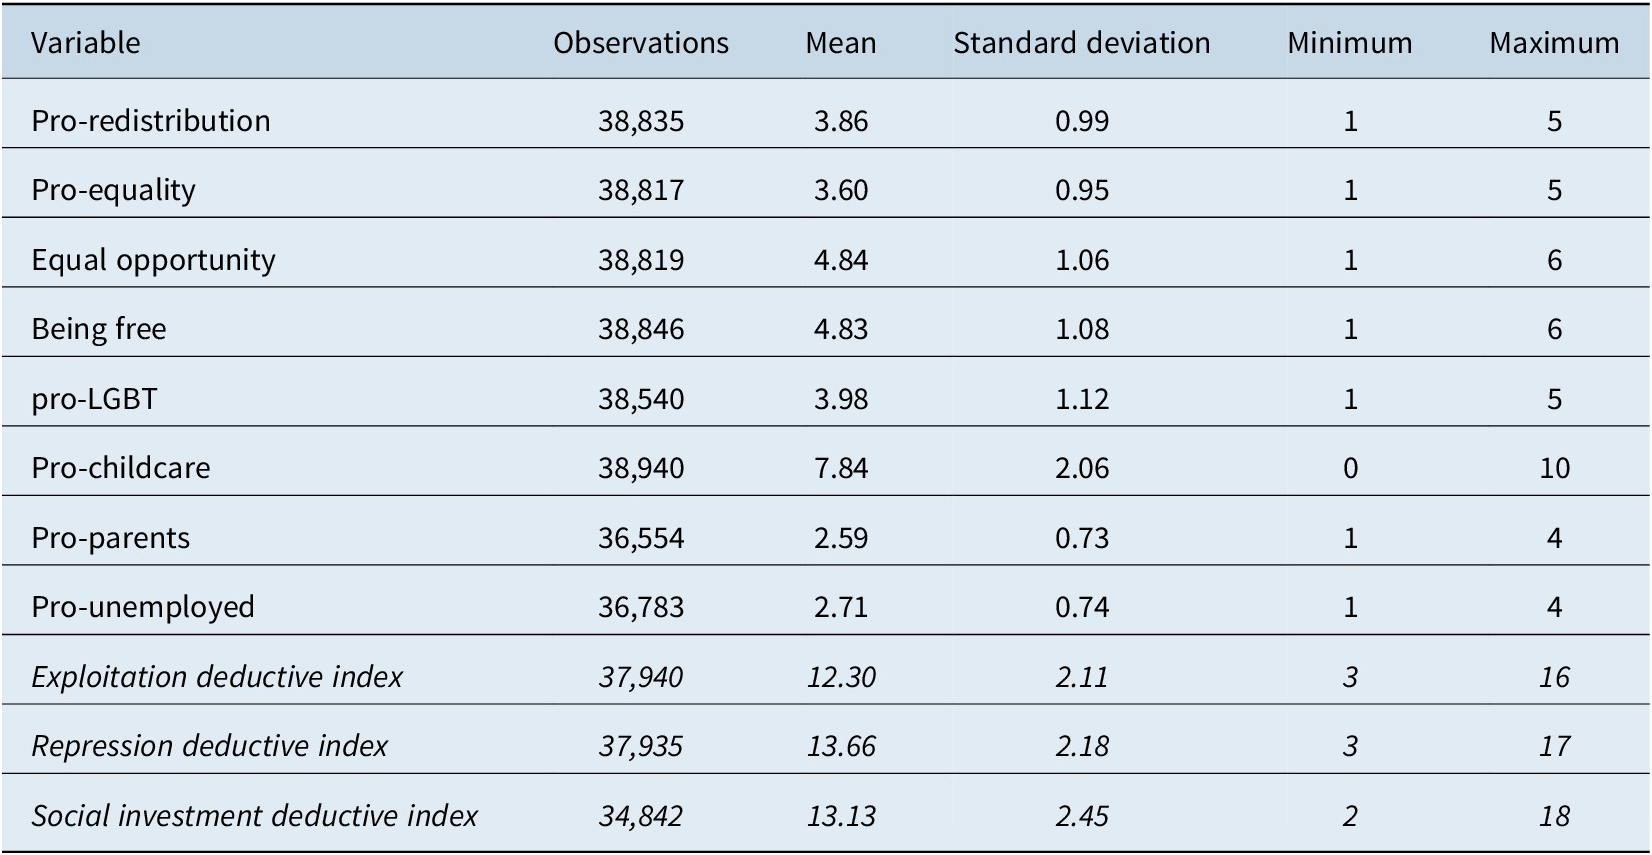
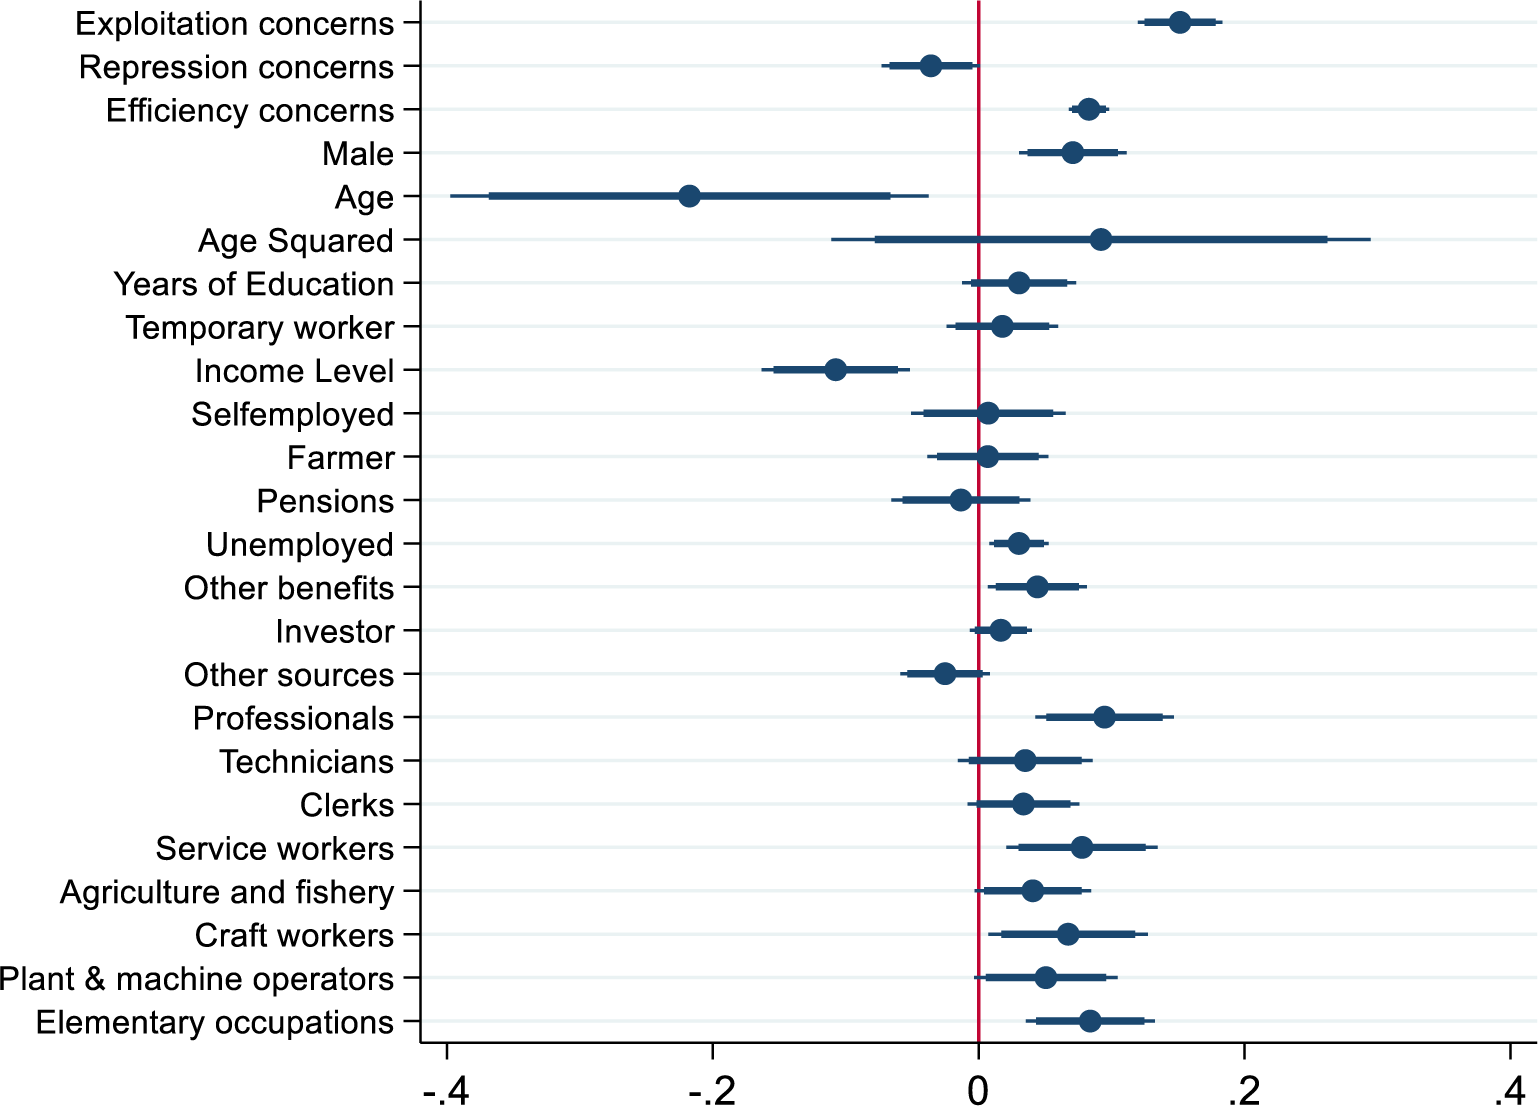
Second, we reproduce our empirical analysis twice using two distinct deductive operationalizations of our three traditions. Indeed, as we now note in the Appendix, we believe the more inductive logic underpinning our factor analysis represents a more transparent approach to capturing the different traditions. This approach also allows us to test the presence of different traditions in our survey data. However, one could nevertheless question the clarity of the factor analysis, especially since many variables load on the first factor (except pro-unemployed education). We therefore rerun the analysis with a deductive approach. Our deductive index of exploitation is a sum of the pro-redistribution, pro-equality and equal opportunity variables. Our deductive index of repression is a sum of equal opportunity variables, being free and pro-LGBT variables. Our deductive index of social investment approach is a sum of pro-childcare, pro-family benefits and pro-unemployed variables. As can be seen, the three resulting indices have similar means and standard deviations. When regressing our dependent variable on these three new deductive indices while keeping the same controls as before, our key results are unchanged (see Figure A3.2.4 in the Appendix). Note that equal opportunity is included in both the exploitation and repression indices because it seems important to both. However, we can also reproduce the same analysis while keeping this variable only in the exploitation index and excluding it from repression concerns index. The results in Figure A3.2.5 show that the findings for the three intellectual traditions of the Left remain similar.
Third, we consider it most important for our theoretical argument how respondents view themselves rather than how they vote, including whether they vote for left parties which can mean very different things across political and party systems. That being said, we reproduce our analysis using past vote for left-wing parties as an alternative to self-identification. To minimize concerns about comparability, we focus on Western European countries only. A simple cross-tabulation reveals that more than 90% that identified as substantially left-leaning (8, 9 and 10) on the Left–Right self-placement scale voted for a left party. Restricting our sample to left-wing voters in Western Europe, our factor analysis reveals the same three intellectual traditions of the Left: those with exploitation concerns score highly on pro-redistribution, pro-equality and equality of opportunities; those with efficiency concerns score most highly on childcare, family benefits and favouring education while those with repression concerns score highly on being free, pro-LGBT rights and equal opportunities. Rerunning our empirical analysis with the same estimation method and controls yields the same results as before (see Figure A3.5.1 in the Appendix).
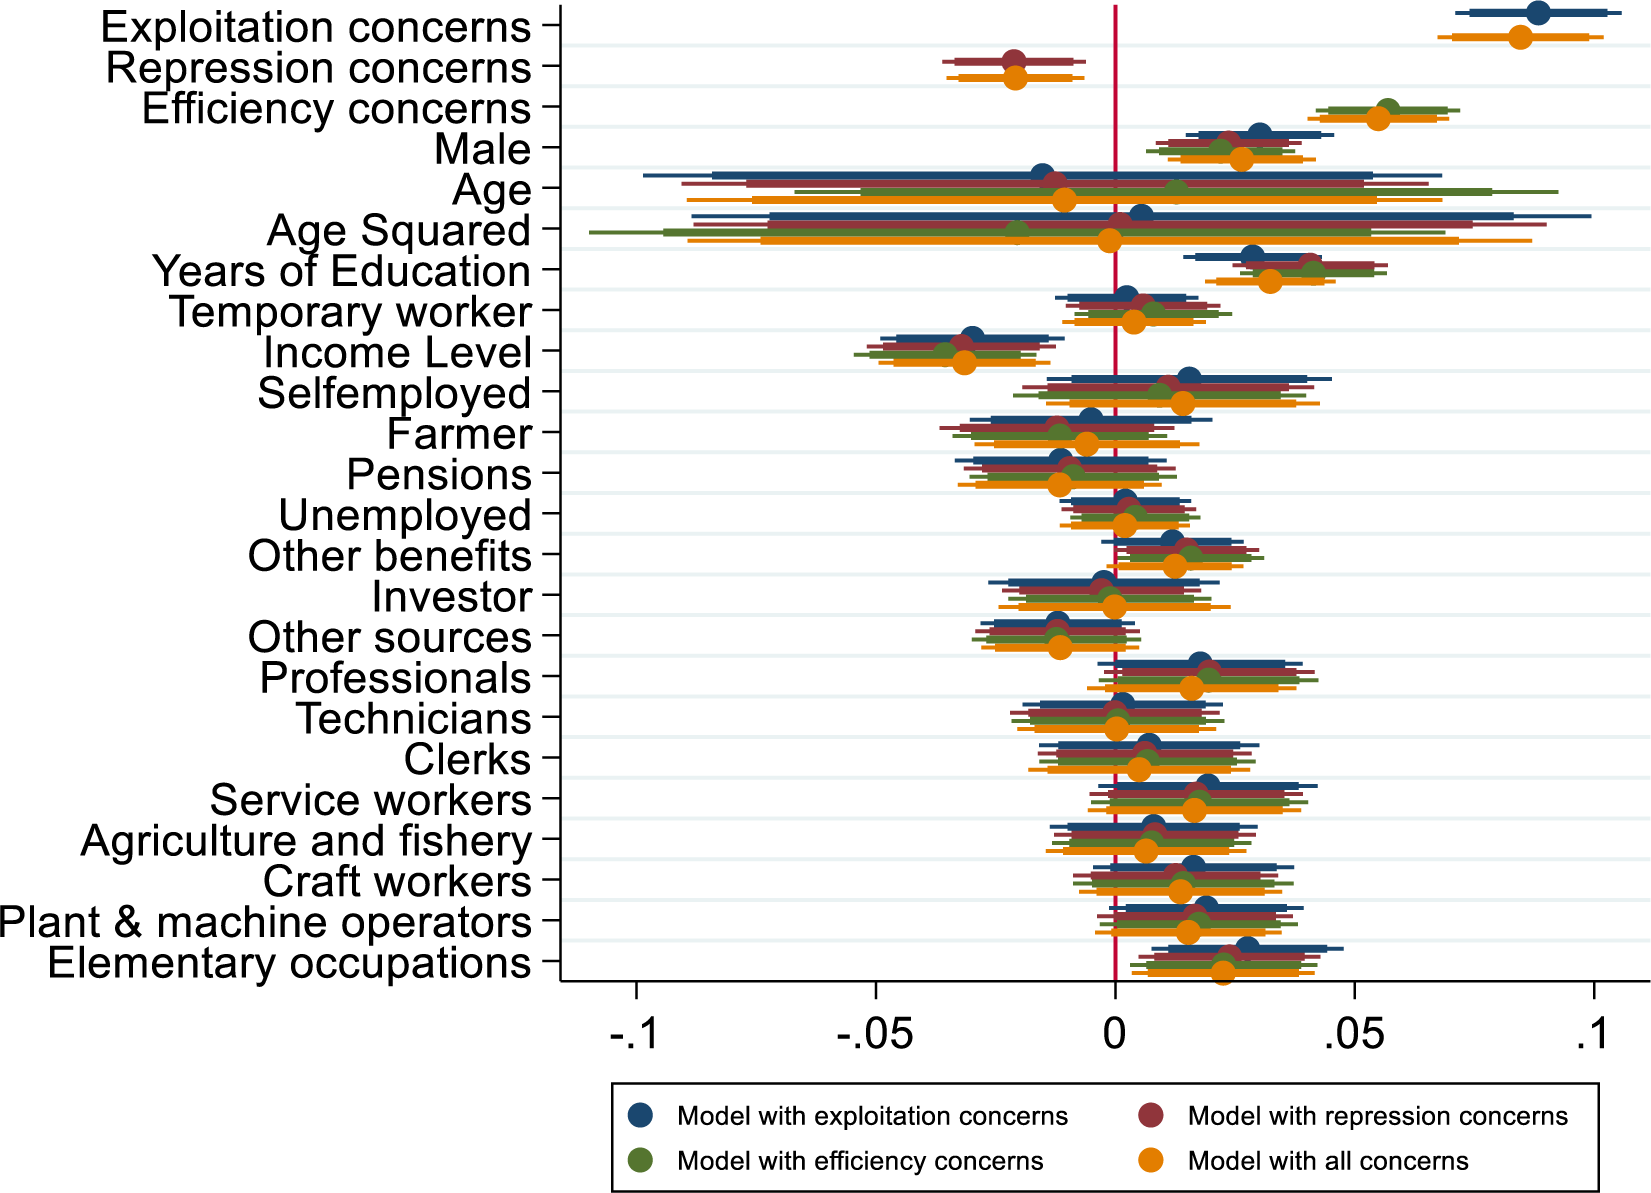
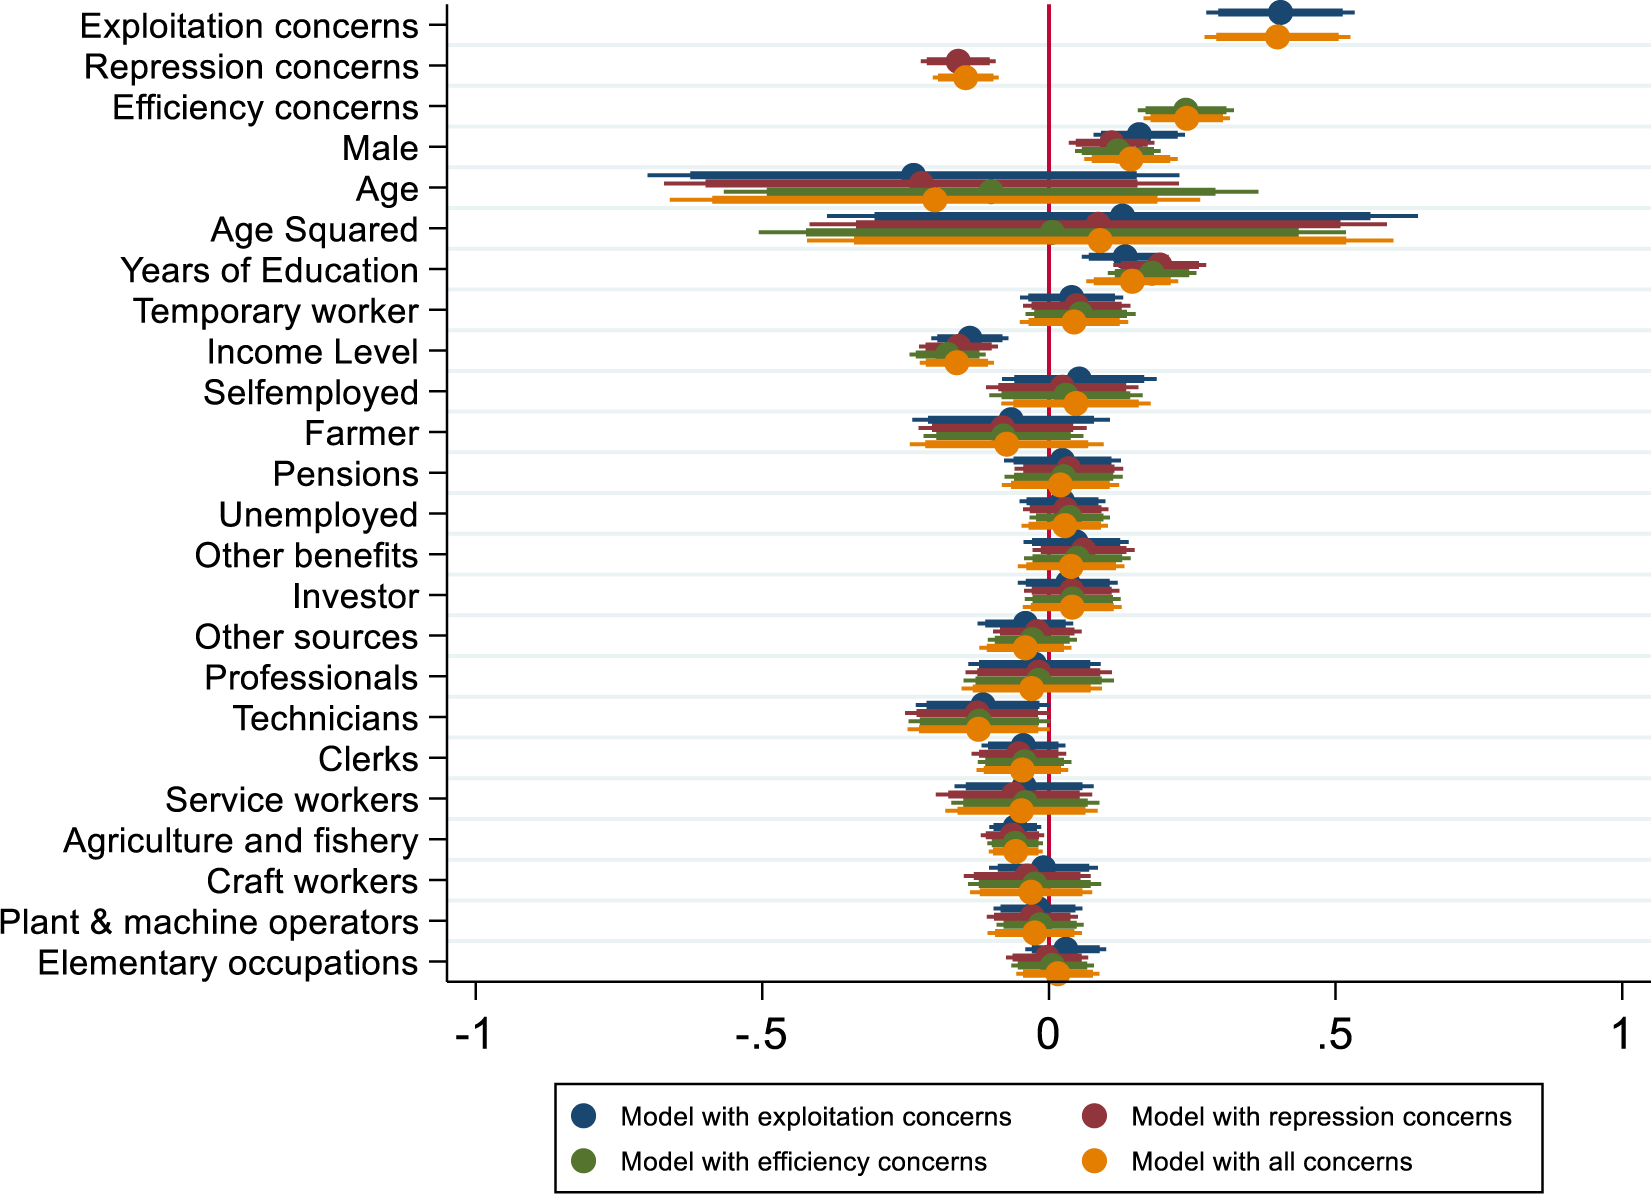
Fourth, in Section A3.4 in the Appendix, we replicate our analysis using ordinal logistic regression analysis on the non-binarized version of our dependent variable (Figure A3.4.1 in the Appendix) and an ordinary least squares (OLS) linear probability model (Figure A3.4.2 in the Appendix). The key results remain unchanged.
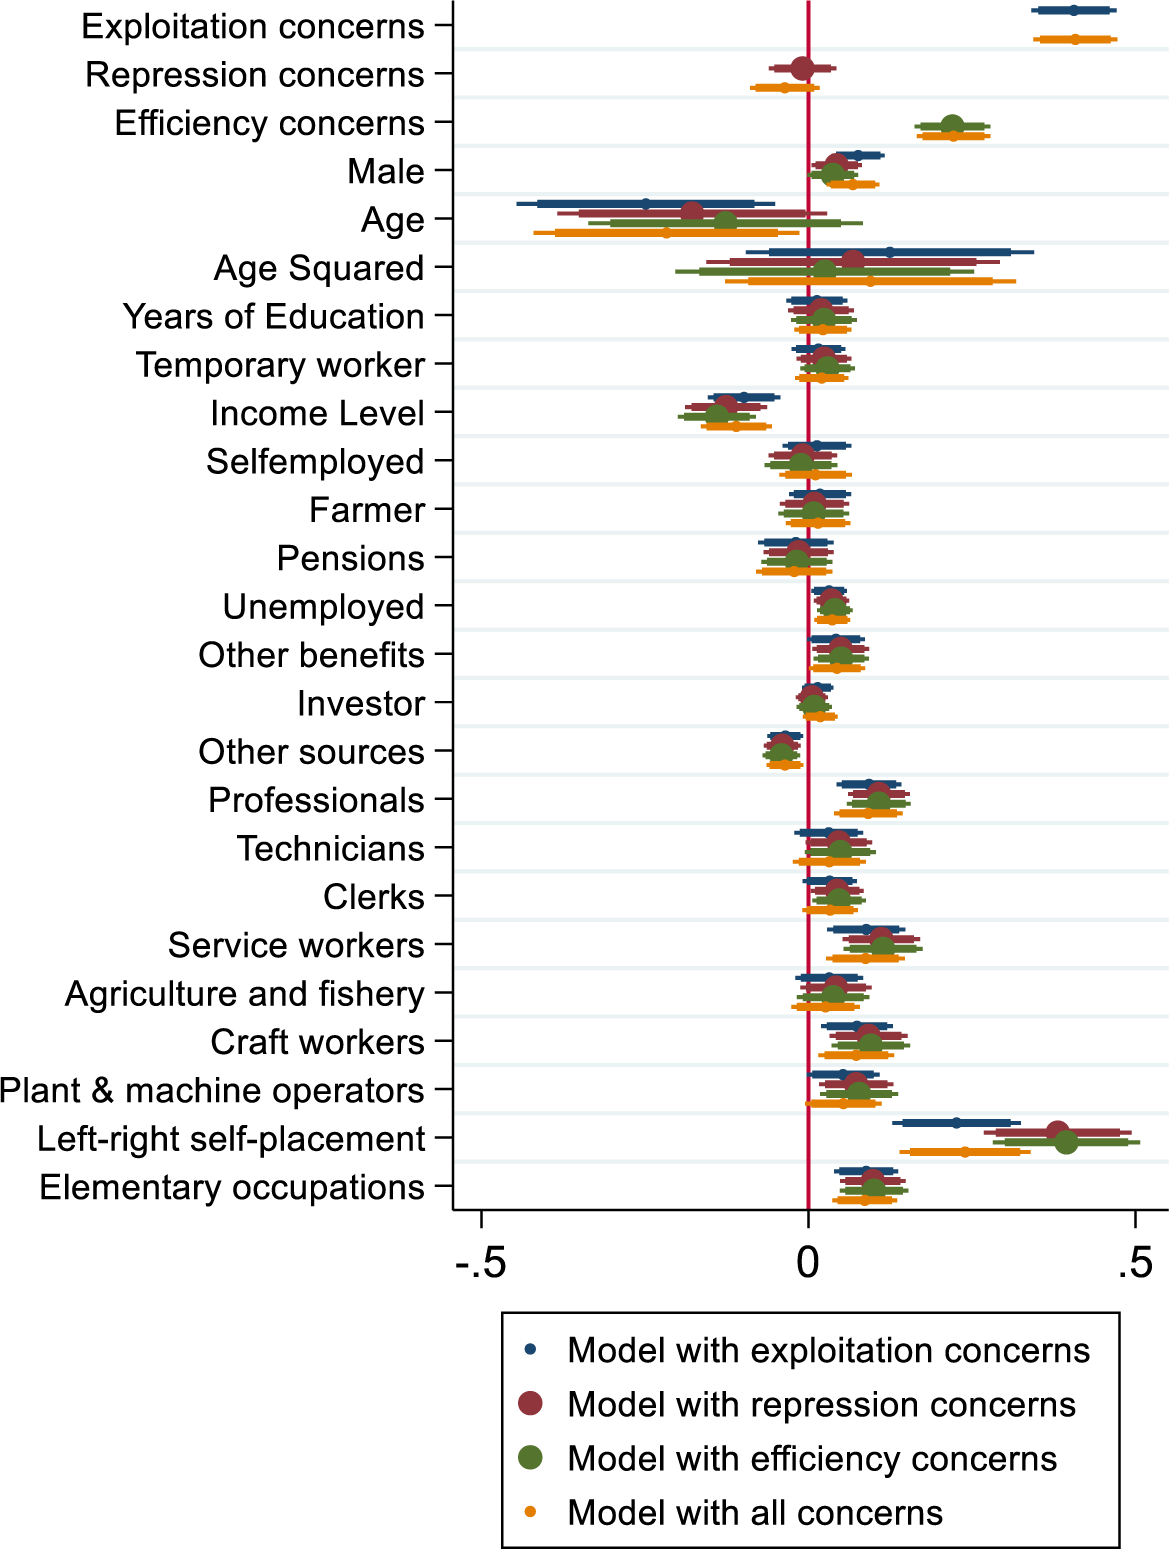
Finally, we rerun our analysis on a larger sample including both left- and right-wing respondents (Section A4.6 in the Appendix). Figure A4.6.1 shows that exploitation and efficiency concerns continue to be positively associated with higher support for UBI, whereas repression concerns are no longer statistically significant. In Figure A4.6.2, we show that left-wing respondents are indeed more supportive of UBI than right-wing respondents. Including our set of concerns reduces the effect of the Left, consistent with the notion that these concerns capture a part of what it means to be left-wing, but the effect remains significant. Controlling for self-placing on the Left in this wider sample does not change the association between exploitation and efficiency concerns with UBI.
Conclusion and discussion
This article explores the relationship between support for UBI among left-wing individuals and different ideological strands of the political Left, captured by different concerns about capitalism. We argue that the nature of criticism against capitalism shapes the extent to which left-leaning individuals will support a basic income. With this, our study contributes to the emerging literature on the drivers and conditions of support for UBI. The relevance of a Left political ideology on welfare state support is underscored by a large political economy and political sociology literature (Bremer & Schwander, Reference Bremer and Schwander2019; Häusermann et al., Reference Häusermann, Kurer and Schwander2016; Jæger, Reference Jæger2006; Linos & West, Reference Linos and West2003). Indeed, left-leaning citizens are more likely to be supportive of the UBI, in particular, in the rich advanced democracies (Parolin & Siöland, Reference Parolin and Siöland2020; Vlandas, Reference Vlandas2020) but the UBI is nevertheless contested within the political Left (Van Parijs, Reference Van Parijs2018a). Disentangling and explaining this variation in support for UBI within the Left is the contribution of our study.
We base our analysis on the eighth wave of the ESS (2016). A factor analysis reveals three factors that capture exploitation, repression and efficiency concerns as main sources of criticism about capitalism. We then test the extent to which these dimensions are associated with support for UBI. Our results first confirm that not all left-leaning individuals are similar in their support for UBI and the type of concerns about capitalism matters for this variation. However, the relationship between different individuals with distinct views of the state and market appears empirically more complex than much of the theoretical-normative literature has so far implicitly assumed.
Indeed, both efficiency and exploitation concerns are associated with higher support for UBI among left-wing individuals, whereas repression concerns are associated with lower support. Thus, citizens who care about equality and redistribution are more supportive of UBI, despite the fact that political thinkers in the Labourist tradition criticize UBI as an inadequate solution to the exploitative nature of capitalism (see for instance the more critical contributions in van Parijs, Reference Van Parijs2018a). It seems that – in contrast to many arguments of Labourists’ political elites – many left-wing citizens consider the UBI as a desirable mean to fight poverty and inequality. Adherents of social investment who favour state interventions to address market failures and increase the efficiency of markets tend to be more favourable to UBI. We suggest that both social investment policies and UBI are perceived as a modern, innovative idea which represents an attractive alternative to the current welfare state institutions (see also Roosma and van Oorschot Reference Roosma and van Oorschot2020). The results for Libertarian Left do not conform to prior expectations (see van Parijs Reference Van Parijs2018c). In sum, we find support only for the expectation from the welfare state literature that Social Investment Left should be associated with UBI but the opposite of what the political theory literature on UBI would make us expect: Labourists appear supportive, whereas Left Libertarians appear less supportive of UBI. In that sense, our study challenges the normative literature on UBI: how can the opinions of Labourist’ elites and citizens diverge so strongly?
Our findings are also relevant for welfare state scholars and from a policy-making perspective: without the support of the political Left, it seems unlikely that any government would implement UBI. Yet, given the heterogeneous support for UBI within the Left, one wonders about other possibly cross-cutting political coalitions that would enable an implementation of the policy. For instance, one might envisage social–liberal coalitions, which have successfully implemented social investment reforms in countries where the political Left alone did not achieve it (see for instance Kübler, Reference Kübler2007) but have not attracted much attention in the welfare state literature. Such a cross-cutting coalition, however, entails the risk that only a meagre version of UBI would be implemented.
Our findings call for more extensive research on the sources of variation of UBI support within the political Left, the specific characteristics of UBI that trigger support or rejection by individuals espousing different ideological dimensions of the Left and the potential coalition dynamics for a larger-scale introduction of UBI. We are also fully aware of the limitations of our analysis. It is entirely possible that part of our unexpected findings are due to imperfect empirical measurement of our main explanatory concepts for which we rely on the information given by the ESS. Yet, to the best of our knowledge, no alternative surveys offer more precise information about support for UBI and about different criticisms of capitalism, let alone in a cross-national survey to capture differences in the structure of the welfare state and the economic system. Nevertheless, we acknowledge limitations with respect to our measurements. Our measurement of exploitation concern for instance is partly problematic because it appears to be closely related to general support for welfare state intervention. Thus, further research should include data collection effort and develop questions more closely linked to repression concerns, including variables that control for general welfare state support in a distinct way.
Appendices
Table Contents
-
A1. Descriptive statistics 15
Table A1.1. Summary statistics 15
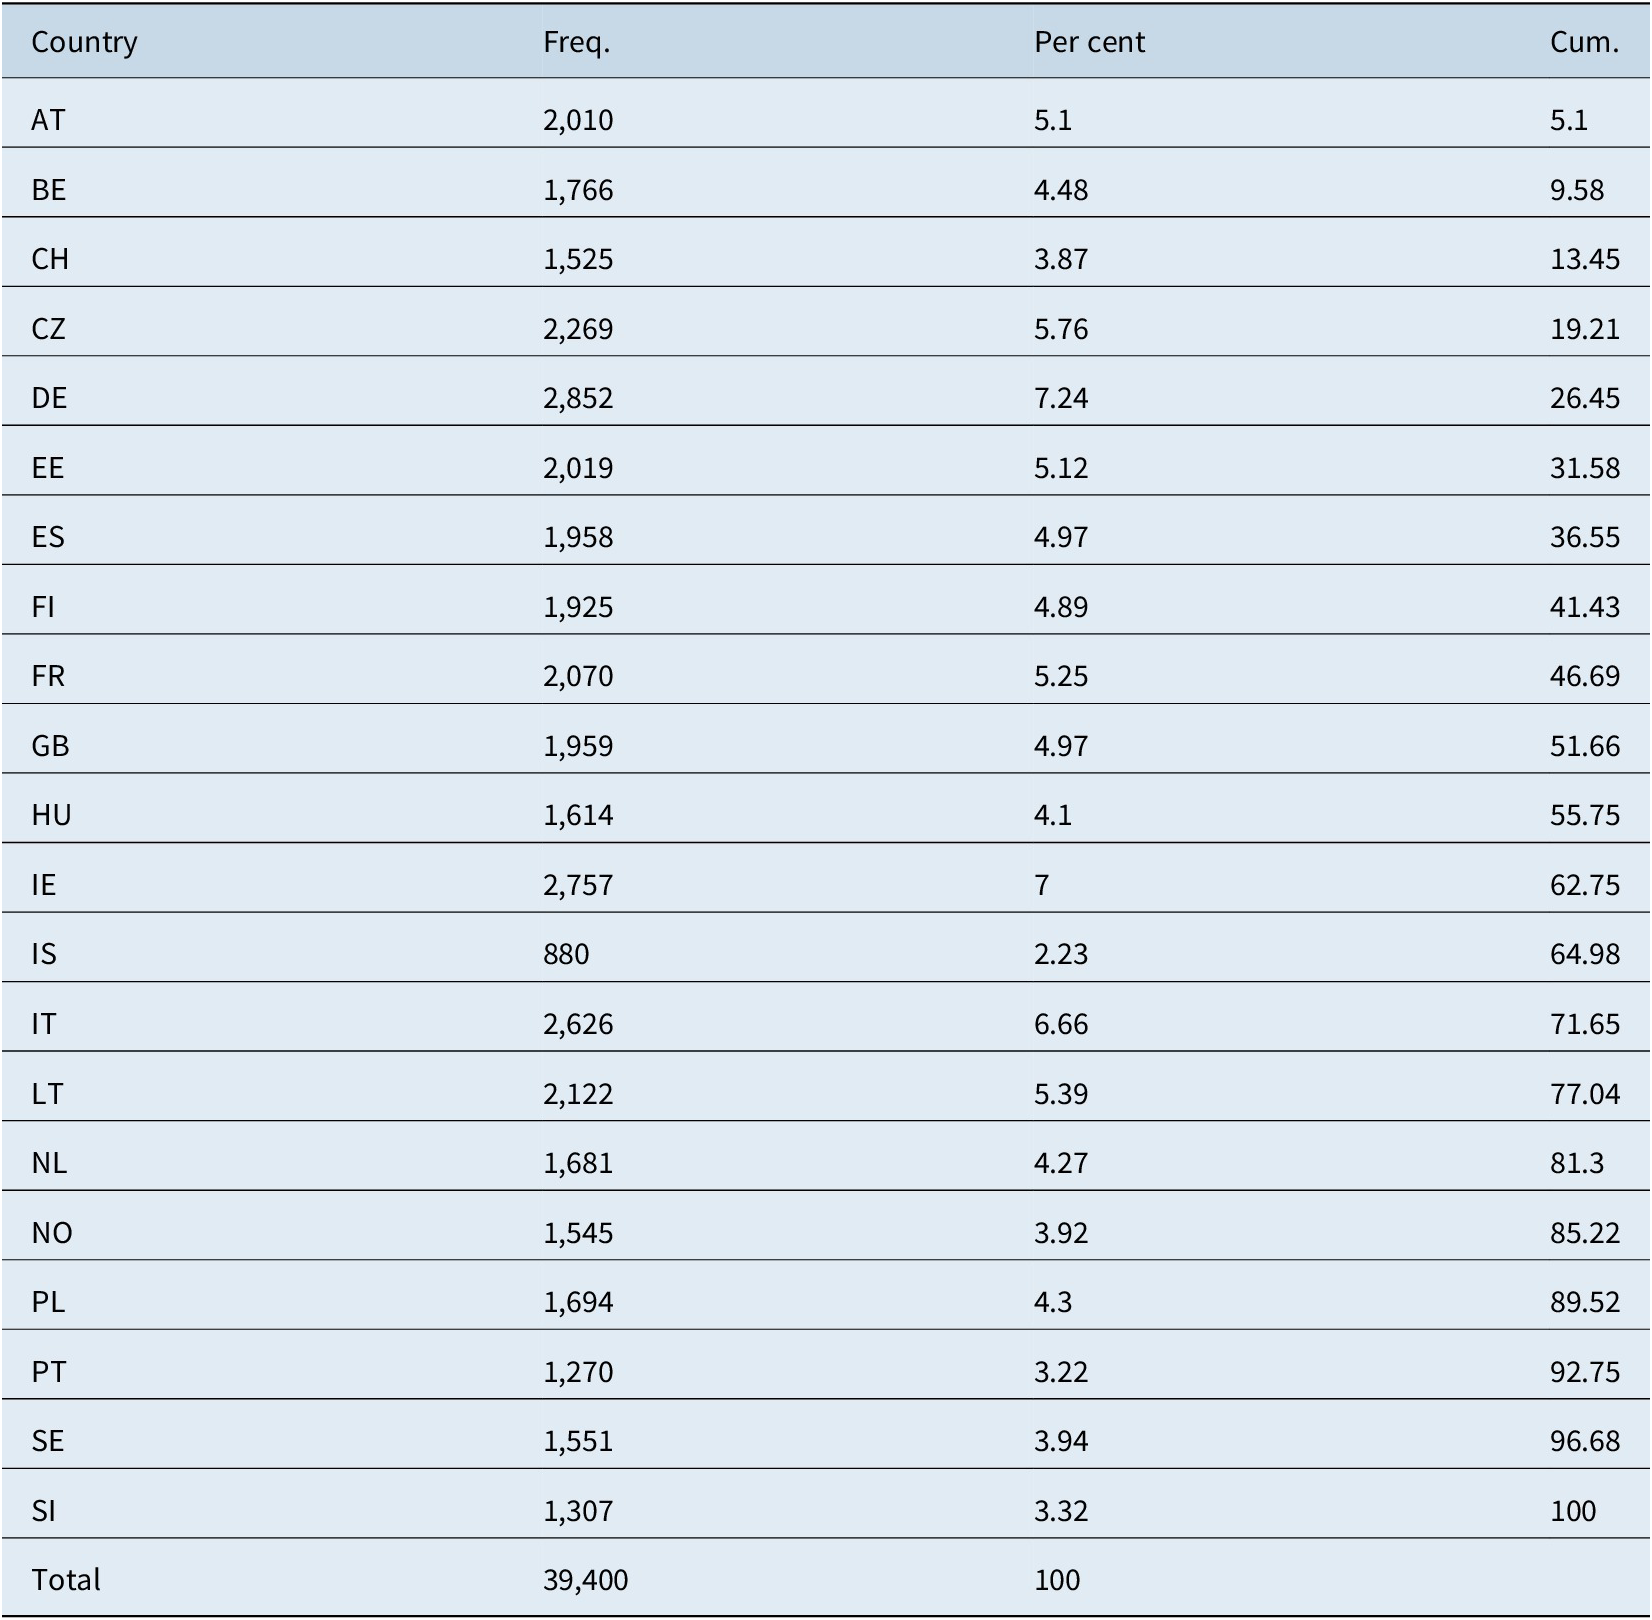
Table A1.2. Number of observations by country 16
-
A2. Correlation between activation attitudes and UBI support 16
Table A2.1. Correlation tables 17
Figure A2.2. Regression of UBI on measures of activation 18
-
A3. Baseline analyses 19
Table A3.1. Factor analysis among self-placed left-wing respondents using principal component factors 19
Figure A3.2. Ideological dimensions and support for UBI among self-placed left-wing respondents 20
Table A3.3. Full logistic regression results and predicted probabilities 21
-
A4. Robustness checks 23
A4.1. Excluding LGBT question 23
Table A4.1.1. Factor analysis among self-placed left-wing respondents using principal component factors (without LGBTQ variable ) 23
Figure A4.1.2. Ideological dimensions and support for UBI among self-placed left-wing respondents 24
A4.2. Deductive approach to index creation 25
Table A4.2.1. Summary statistics of key independent variables and new deductive indices1 25
Figure A4.2.2. Ideological dimensions using deductive indices and support for UBI among self-placed left-wing respondents1 25
Figure A4.2.3. Ideological dimensions using strictly exclusive deductive indices and support for UBI among self-placed left-wing respondents 26
A4.3. Restricting analysis to sample of Western European countries 27
Figure A4.3.1. Ideological dimensions and support for UBI among self-placed left-wing respondents (Western Europe sample) 27
A4.4. Alternative regression methods 28
Figure A4.4.1. Ordinal logistic 28
Figure A4.4.2. OLS regression for Linear Probability Model 29
A4.5. Using Left-wing voters to restrict sample to Left individuals in Western European countries 29
Figure A4.5.1. Ideological dimensions and support for UBI among left-wing voters 30
A4.6. Rerunning analysis on whole population (ie. not restricted to left-wing respondents) 30
Figure A4.6.1. Ideological dimensions and support for UBI in whole population with no restrictions to left-wing respondents 30
Figure A4.6.2. Ideological dimensions and support for UBI in whole population with no restrictions to left-wing respondents and controlling for left self-placement 31
A1. Descriptive statistics
Summary statistics.

Number of observations by country.

A2. Correlation between activation attitudes and UBI support
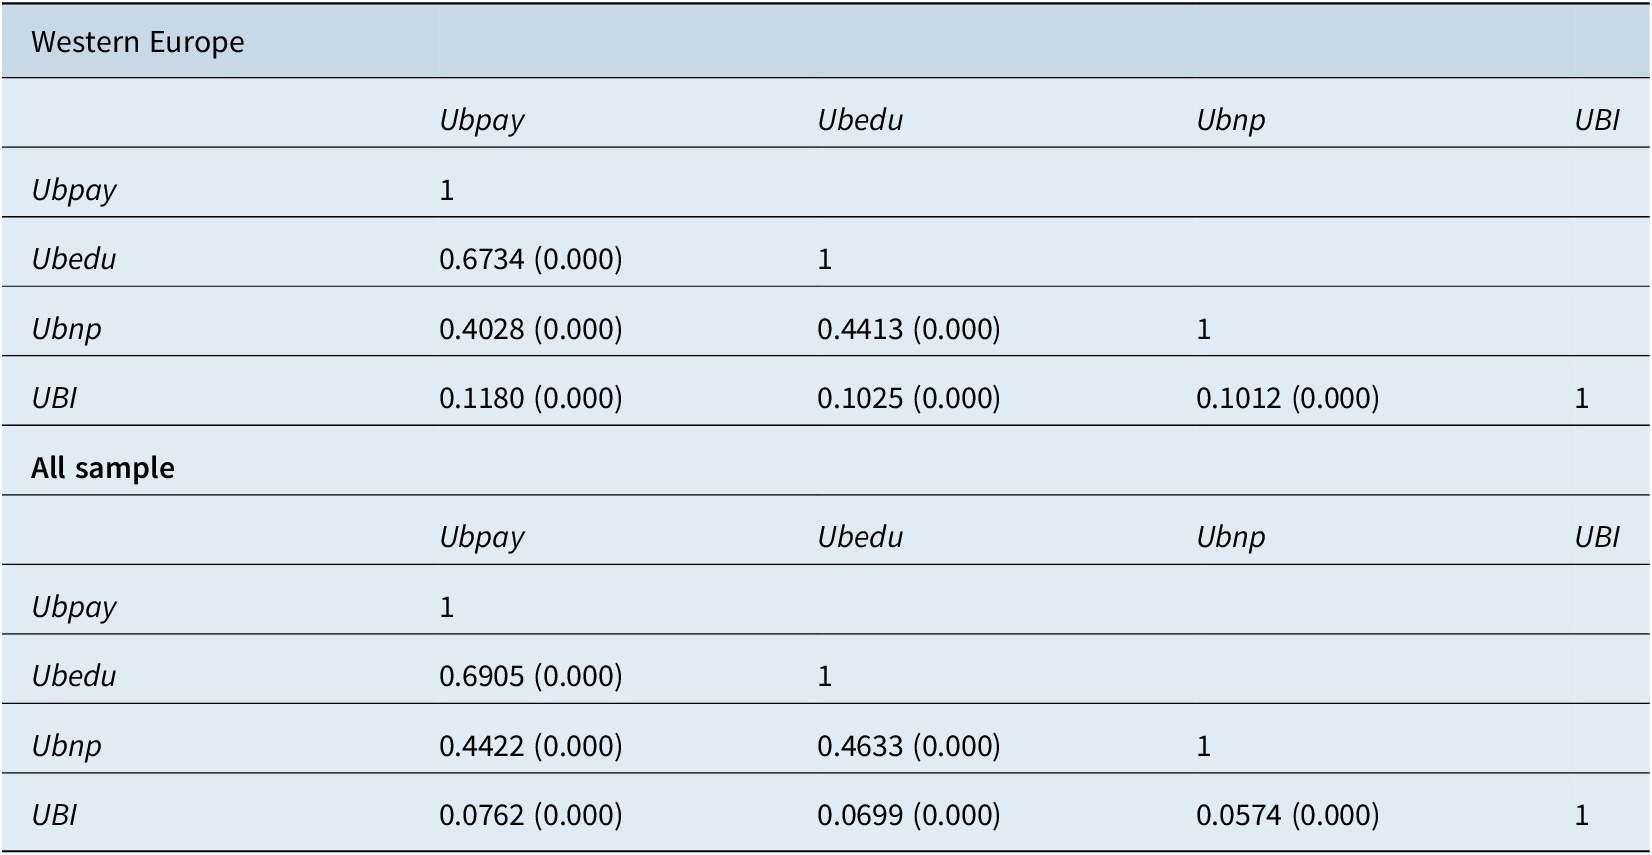
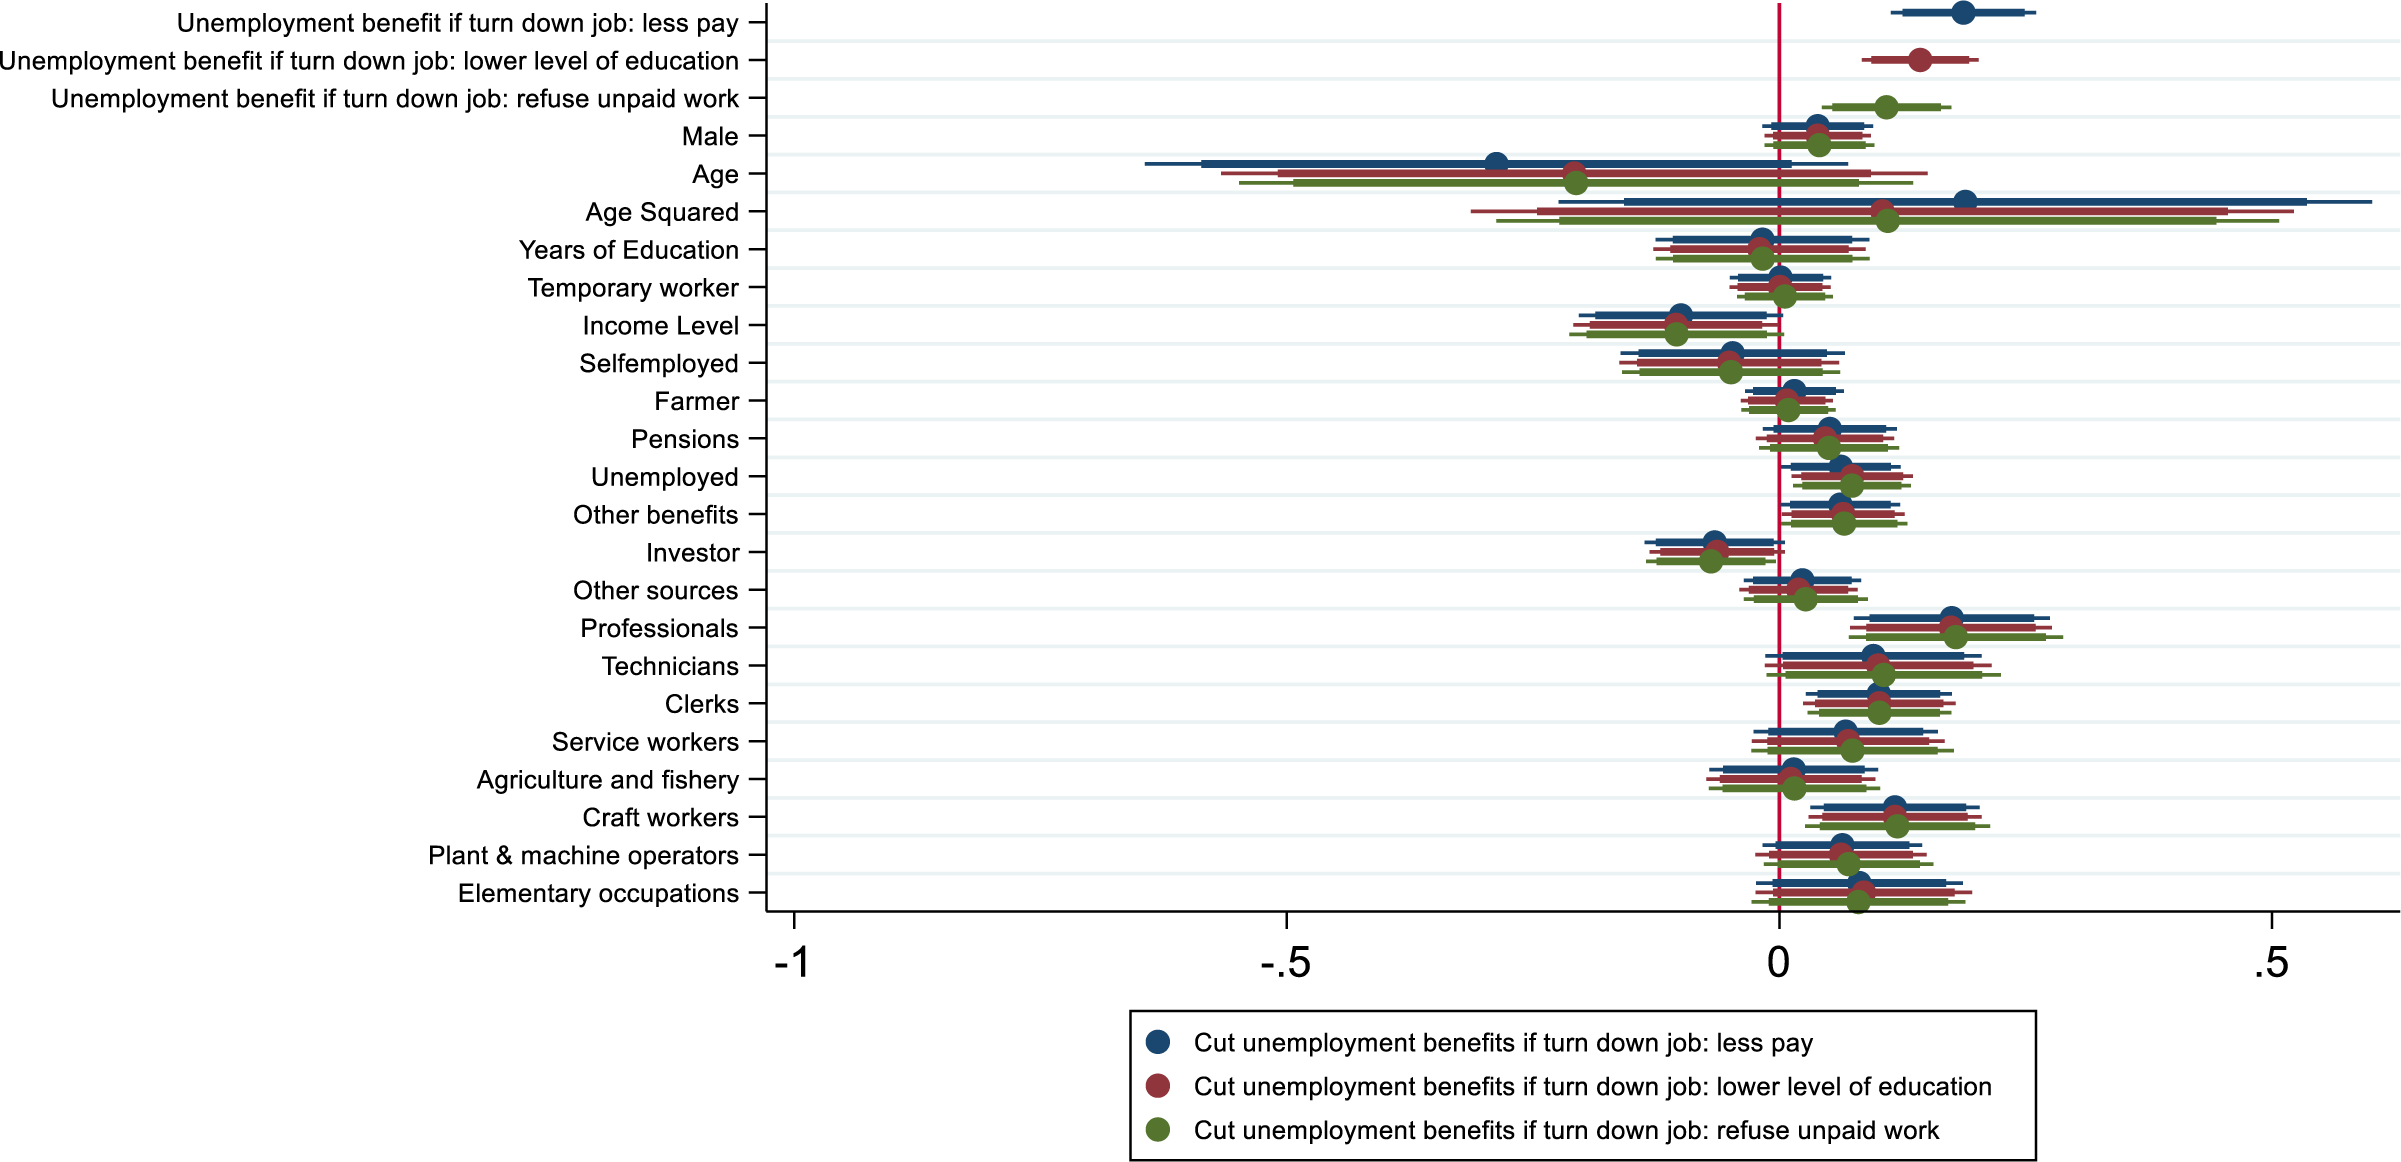
When discussing our analyses, we mention in footnote 3 (p. 11) that the relationship between attitudes toward activation and UBI is negative. Here, we discuss the variables and results for this claim in more details. To capture activation, we rely on three distinct variables which capture attitudes about penalizing the unemployed by reducing their benefits if they refuse a job for three possible reasons: “Unemployment benefits if turn down job because of less pay” (ubpay), “unemployment benefits if turn down job because of lower level of education” (ubedu) and “unemployment benefits if turn down job because it is unpaid” (ubunp). Each variable is scaled from 1 “Should lose all unemployment benefit” to 4 “Should keep all unemployment benefits,” and, therefore, more positive values capture less activation.
As can be seen in Table A2.1 below, less activation attitudes are always positively correlated with more support for UBI: while the correlation is not always very strong, it is always statistically significant. If we run a more formal logistic regression analysis controlling for other key variables, the results are the same: lower activation attitudes are positively and significantly related with support for a UBI (see Figure A2.2).
Correlation tables.

Regression of UBI on measures of activation.

A3. Baseline analyses
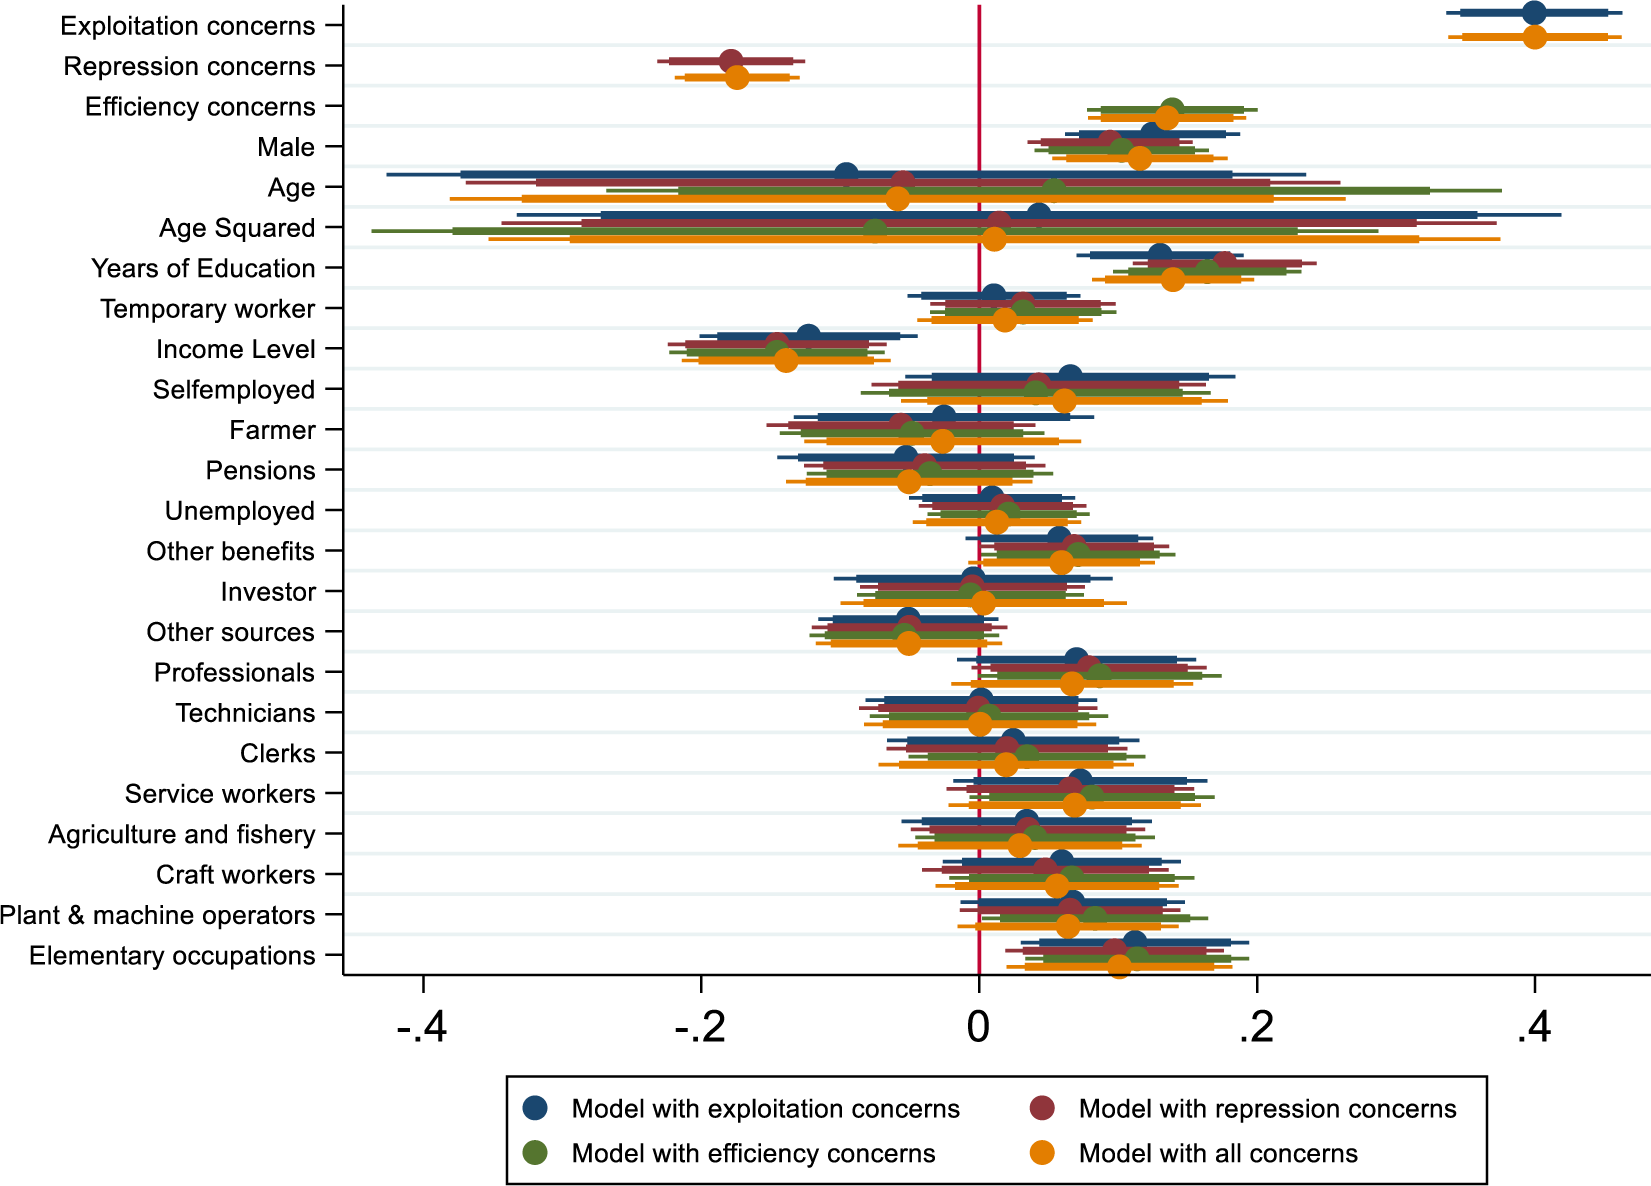
Table A3.1 displays the full results from the factor analysis, and Figure A3.2 shows the results for all independent variables while Table A3.3 displays the full logistic regression results. Our three key indices of Left-wing tradition, “exploitation,” “repression” and “social investment” together have very strong predictive power as shown when running a simple logistic regression of support for UBI on three variables. The count R2, which captures the percentage of correct predictions of the model, is 0.599.Footnote 8
Factor analysis among self-placed left-wing respondents using principal component factors.

Factor analysis/correlation; Number of observations = 9,727. Method: principal-component factors; Retained factors = 3; Rotation: (unrotated) Number of parameters = 21; LR test: independent versus saturated: χ 2(28) = 4095.54, Prob > χ 2 = 0.0000.
Ideological dimensions and support for UBI among self-placed left-wing respondents. Note: The sample has been restricted to respondents who identify as left. This sample was then used to compute the factor analysis and run the above logistic regressions. Country-fixed effects are included but not shown. Standard errors are clustered but not shown, robust standard errors clustered by country (90 and 95% confidence intervals), the constant is positive but not statistically significant, Log pseudolikelihood = −4268. Countries included are as follow: Austria, Belgium, Czechia, Estonia, Finland, France, Germany, Hungary Iceland, Ireland, Italy, Lithuania, Netherlands, Norway, Poland, Portugal, Slovenia, Spain, Sweden, Switzerland and the United Kingdom. All independent variables are standardized so that they have a mean of 0 and a standard deviation of 1, which makes coefficients directly comparable.

Full logistic regression results and predicted probabilities.

Robust standard errors clustered by country shown in parentheses, country-fixed effects are included but not shown.
Abbreviations: CI, confidence intervals; S.E., standard error.
Table A3.3 also displays all the predicted probabilities for the minimum versus maximum values of each independent variable while holding the controls at their mean value. Exploitation concerns have the strongest effect on support on UBI: those with highest concerns have roughly 75% predicted probability (95% CI between 71 and 77%) of supporting UBI compared to only 18% for those with the lowest level of these concerns (95% CI between 13 and 23%). Second, those with the highest level of efficiency concerns have 77% predicted probability (95% confidence interval between 73 and 82%) of support compared to 32% for those with lowest level of these concerns (95% confidence interval between 26 and 37%). Third, those with high repression concerns have a predicted probability of 48% compared to 67% for those with low concerns. Even this 19 percentage points gap compares favourably to many of the other variables that have been identified as important in the literature: for income, the gap is 12 points; for temporary work, six points; for age, five points and for gender, six points.
A4. Robustness checks
A4.1. Excluding LGBTQ question
Because the survey questions in the ESS only measure the three distinct intellectual traditions imperfectly at best, we carry out a number of robustness checks to test the fragility of our results. First, while we believe both economic and cultural variables are needed to appropriately capture the different intellectual traditions of the Left, we replicate the analysis while excluding attitudes toward LGBTQ rights. As can be observed in Table A4.1.1, the resulting factor analysis yields similar results. Using these new factors, we reproduce the baseline results and our findings hold (see Figure A4.1.2).
Factor analysis among self-placed left-wing respondents using principal component factors (without LGBTQ variable).

Factor analysis/correlation; Number of observations = 9,803. Method: principal-component factors; Retained factors = 3; Rotation: (unrotated) Number of parameters = 18; LR test: independent vs. saturated: χ 2(21) = 3518, Prob > χ 2 = 0.0000.
Ideological dimensions and support for UBI among self-placed left-wing respondents.

A4.2. Deductive approach to index creation
Next, we believe the more inductive logic underpinning our factor analysis represents a more transparent approach to capturing the different traditions. This approach also allows us to test the presence of different traditions in our survey data. However, one could nevertheless question the clarity and rationale behind the factor analysis, especially since many variables load on the first factor (except pro-unemployed education). We therefore rerun the analysis using a deductive approach to selecting which variables capture each intellectual tradition. This deductive approach still allows us to account for the distinct emphasis of each tradition while representing a useful robustness check.
We first summarize the mean, standard deviation, minimum and maximum values of all our key variables in Table A4.2.1 below. The last three rows then display our three deductive indices, which are calculated as follows. First, our deductive index of exploitation is a sum of the pro-redistribution, pro-equality and equal opportunity variables. Second, our deductive index of repression is a sum of equal opportunity variables, being free and pro-LGBTQ variables. Third, our deductive index of social investment approach is a sum of pro-childcare, pro-family benefits and pro-unemployed variables. As can be seen, the three resulting indices have similar means and standard deviations. When regressing our dependent variable on these three new deductive indices, while keeping the same controls as before, our key results are unchanged (see Figure A4.2.2).
Summary statistics of key independent variables and new deductive indices.

Ideological dimensions using deductive indices and support for UBI among self-placed left-wing respondents.

Note that equal opportunity is included in both the exploitation and repression indices because it seems important to both. However, we can also reproduce the same analysis while keeping this variable only in the exploitation index and excluding it from repression concerns index. The results in Figure A4.2.3 show that the findings for the three intellectual traditions of the Left remain similar.
Ideological dimensions using strictly exclusive deductive indices and support for UBI among self-placed left-wing respondents. Note: repression concerns are statistically significant at 10% level (p value = 0.057).

A4.3. Restricting analysis to sample of Western European countries
Despite clear historical and socio-political differences between Western and Eastern European countries, we decided to keep both in our baseline analyse to maximize sample size. However, if we restrict our analysis to Western Europe, our results remain the same (see Figure A4.3.1).
Ideological dimensions and support for UBI among self-placed left-wing respondents (Western Europe sample).

A4.4. Alternative regression methods
In this section, we replicate our analysis using ordinal logistic regression analysis on the non-binarized version of our dependent variable (Figure A4.4.1) and an ordinary least squares (OLS) linear probability model (Figure A4.4.2). The key results remain unchanged.
Ordinal logistic.

OLS regression for linear probability model.

A4.5. Using Left-wing voters to restrict sample to Left individuals in Western European countries
What matters for our theoretical argument is how respondents view themselves rather than how they vote, including whether they vote for left-wing parties, which can mean very different things across political and party systems. However, one could also reasonably question whether self-placement is sufficiently precise in identifying left-wing respondents. We therefore reproduce our analysis using past vote for left-wing parties as an alternative. To minimize concerns about comparability, we only focus on Western European countries. The correlation between selfplacement on the left and voting for a left-wing party is not particularly strong: 0.51 with p-value equal to 0.000. On the other hand, a simple cross-tabulation reveals that more than 90% that identified as most Left (8, 9 and 10) on the Left–Right self-placement scale voted for a Left-wing party. Restricting our sample to left-wingers in Western Europe, our factor analysis reveals the same three intellectual traditions of the Left: those with exploitation concerns score highly on pro-redistribution, pro-equality and equality of opportunities; those with efficiency concerns score most highly on childcare, family benefits and favouring education; while those with repression concerns score highly on being free, pro-LGBTQ rights and equal opportunities. Rerunning our empirical analysis with the same estimation method and controls yields the same results as before (see Figure A4.5.1).
Ideological dimensions and support for UBI among left-wing voters.

A4.6. Rerunning analysis on whole population (i.e. not restricted to Left-wing respondents)
Finally, we rerun our analysis on the whole sample, i.e., without restricting our sample to left-wing respondents. The results for exploitation and efficiency concerns are similar, but repression concerns are no longer statistically significant (Figure A4.61). This is consistent with the notion that these concerns are only negatively related with UBI support among left-wingers, ie. that left-wing respondents with high repression concerns are less supportive of UBI than other left-wing respondents with low repression concerns, but there is no association across all respondents. The results are the same when controlling for Left self-placement: exploitation and efficiency concerns are both positively associated with UBI support, but repression concerns are still statistically insignificant.
Ideological dimensions and support for UBI in whole population with no restrictions to left-wing respondents.

Ideological dimensions and support for UBI in whole population with no restrictions to left-wing respondents and controlling for left self-placement.