Introduction
Low genetic diversity in invasive plant species is not as common as expected. Invasions have the potential to generate founder effects and bottleneck genetic diversity (Dlugosch and Parker Reference Dlugosch and Parker2008; Excoffier et al. Reference Excoffier, Foll and Petit2009; Petit et al. Reference Petit, Duminil, Fineschi, Hampe, Salvini and Vendramin2005). The founder effect associated with initial colonization can reduce genetic diversity in weed populations and limit their capacity to adapt to novel conditions. However, high genetic diversity and significant heterozygote excess, as an indication of population bottlenecking, have been reported (Marochio et al. Reference Marochio, Bevilaqua, Takano, Mangolim, Oliveira and Machado2017; Minati et al. Reference Minati, Preston and Malone2020; Okada et al. Reference Okada, Hanson, Hembree, Peng, Shrestha, Stewart, Wright and Jasieniuk2015). Multiple introductions and hybridization with native or other introduced species have been proposed as ways to generate genetic diversity within weed plant populations. Cross-pollinating plant species tend to have high levels of genetic variation within populations and low levels of genetic differentiation among populations (Hamrick and Godt Reference Hamrick and Godt1996). Outcrossing may increase the genetic variation and produce novel gene combinations on which natural selection can act (see review by Ward et al. [Reference Ward, Gaskin and Wilson2008]). In this way, multiple introductions and hybridizations are the events attributed to weed populations that manage to bypass the founding effect and promote high genetic diversity.
Lower genetic diversity may be expected in weed plants in cultivated areas (corn [Zea mays L.], soybeans [Glycine max (L.) Merr.], cotton [Gossypium hirsutum L.], pasture) due to the selection pressure exerted by herbicide applications that aim to control weeds. Weed plants cause serious economic losses in cultivated areas, and the use of chemical compounds is usually the main option for their control. Species of the genus Conyza are examples of weed plants that occur in cropping areas worldwide (Lazaroto et al. Reference Lazaroto, Fleck and Vidal2008; Thebaud and Abbott Reference Thebaud and Abbott1995; Travlos and Chachalis Reference Travlos and Chachalis2013). Tall fleabane [Conyza sumatrensis (Retz.) E. Walker; also known as Sumatran fleabane or broad-leaved fleabane; syn. Conyza albida Willd. ex Spreng] is a native species of South America (Anastasiu and Memedemin Reference Anastasiu and Memedemin2011; Hao et al. Reference Hao, Qiang, Liu and Cao2009) and commonly invasive in crop areas of southern, southeastern, and midwestern Brazil (Santos et al. Reference Santos, Vargas, Christoffoleti, Agostinetto, Martin, Ruchel and Fernando2014a). Reduced yields in different crops infested with C. sumatrensis have been reported by Oliveira et al. (Reference Oliveira, Guerra, Osipe, Franchini, Adegas, Osipe, Constantin, Oliveira and Oliveira Neto2013).
Despite the economic importance of C. sumatrensis, few studies have particularly addressed the traits of this weed species. Only some reproductive (Hao et al. Reference Hao, Qiang, Liu and Cao2009) and morphological (Sansom et al. Reference Sansom, Saborido and Dubois2013) features, the occurrence of biotypes resistant to herbicides (Santos et al. Reference Santos, Vargas, Christoffoleti, Agostinetto, Martin, Ruchel and Fernando2014a, 2014b, 2015), the impact of invasions on the soil microbiome (Rasool et al. Reference Rasool, Reshi, Khasa, Roshan and Shah2016), and genetic diversity within and among different biotypes (Marochio et al. Reference Marochio, Bevilaqua, Takano, Mangolim, Oliveira and Machado2017; Schneider et al. Reference Schneider, Rizzardi, Brammer, Scheffer-Basso and Nunes2020) have been reported so far. Genetic diversity analysis of weed populations has practical importance, such as in predicting population response to biological or chemical control (Ward et al. Reference Ward, Gaskin and Wilson2008). High genetic diversity may confer on plants the ability to respond adequately to new selection pressures, to adapt to environmental changes, and to expand their distribution into new habitats (Erfmeier et al. Reference Erfmeier, Hantsch and Bruelheide2013; Matesanz et al. Reference Matesanz, Theiss, Holsinger and Sultan2014). Higher genetic diversity indicates strong potential fitness of the plant species, and plants with genotypes conferring the highest levels of fitness are expected to survive and reproduce at a greater rate.
A high number of alleles at simple sequence repeats of DNA (SSR loci or microsatellite loci) and high levels of observed and expected heterozygosity have been reported in a few biotypes of C. sumatrensis from different invaded areas of southern Brazil (Marochio et al. Reference Marochio, Bevilaqua, Takano, Mangolim, Oliveira and Machado2017). Genetic dissimilarity among 15 biotypes of C. sumatrensis from different fields from southern and midwestern Brazil determined using microsatellite loci was reported by Schneider et al. (Reference Schneider, Rizzardi, Brammer, Scheffer-Basso and Nunes2020). However, there is no information on genetic diversity within each biotype. In the present study, the authors hypothesize that different genetic diversity may be detected within each biotype. The level of genetic diversity within each biotype may be relevant in establishing control strategies using herbicides and predicting future invasive events. The objective of the present study was to evaluate the genetic diversity within and among a larger number of C. sumatrensis biotypes that are commonly invasive in 50 agricultural areas in southern, southeastern, and midwestern Brazil, employing microsatellites as molecular markers.
Materials and Methods
Samples of Conyza sumatrensis
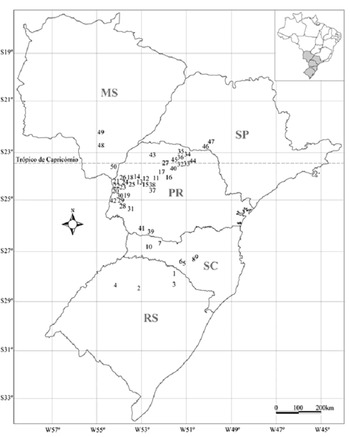
Seeds of C. sumatrensis were collected from several plants in soybean fields of southern (Rio Grande do Sul [RS], Santa Catarina [SC], and Paraná [PR] states), southeastern (São Paulo [SP] State), and midwestern (Mato Grosso do Sul [MS] State) Brazil (Figure 1; Table 1). The seeds from each collection site were placed in separate paper bags to prevent the mixture of seeds from different collection sites. Seeds from each site were randomly distributed for germination in separate 500-ml pots containing sterile soil. Plants obtained from germinated seeds were maintained at room temperature in the greenhouse (23.395°S, 51.950°W, altitude 510 m), irrigated daily, and used for the experiments.
Collection points for seeds of Conyza sumatrensis: São José do Ouro (1), Saldanha Marinho (2), Lagoa Vermelha (3), Santo Ângelo (4), Campos Novos 1 (5), Campos Novos 2 (6), Abelardo Luz (7), Curitibanos 1 (8), Curitibanos 2 (9), Quilombo (10), Luiziana (11), Janiópolis (12), Goioerê (13), Mariluz (14), Rancho Alegre D’Oeste (15), São João do Ivaí (16), Quinta do Sol (17), Alto Piquiri (18), Toledo (19), Marechal Cândido Rondon (20), Guaíra 1 (21), Guaíra 2 (22), Palotina 1 (23), Palotina 2 (24), Brasilândia do Sul (25), Francisco Alves (26), Maringá (27), Céu Azul (28), Ouro Verde do Oeste 1 (29), Ouro Verde do Oeste 2 (30), Lindoeste (31), Londrina 1 (32), Londrina 2 (33), Sertanópolis (34), Bela Vista do Paraiso (35), Cambé (36), Mamborê 1 (37), Mamborê 2 (38), Pato Branco (39), Cambira (40), Francisco Beltrão (41), Santa Helena (42), Tamboara (43), Assaí (44), Rolandia (45), Palmital (46), Campos Novos Paulistas (47), Caarapó (48), Itaporã (49), and Itaquiraí (50).

Collection points of the Conyza sumatrensis seeds from biotypes in soybean fields of southern (Rio Grande do Sul [RS], Santa Catarina [SC], and Paraná [PR] states), southeastern (São Paulo [SP] State), and midwestern (Mato Grosso do Sul [MS] State) of Brazil.

Analysis of the C. sumatrensis plants for possible resistance to glyphosate was carried out at different stages of development, according to the protocol previously described by Santos et al. (Reference Santos, Oliveira, Constantin, Francischini and Osipe2014b). Only the plants from Mariluz (PR), Maringá (PR), and Itaporã (MS) were classified as susceptible to glyphosate. Plants from Abelardo Luz (SC), Sertanópolis (PR), Cambé (PR), and Campos Novos Paulistas (SP) were ranked as slightly or moderately sensitive to glyphosate, while plants from the other 43 biotypes were considered resistant to glyphosate (Santos et al. Reference Santos, Oliveira, Constantin, Francischini and Osipe2014b).
DNA Extraction
DNA was extracted from young leaf tissues collected from 10 plants of C. sumatrensis from each invaded area (total of 500 plants). The young leaves were collected from plants 15 to 30 d after plant emergence. Leaf pieces (50 mg) from each plant were separately ground in liquid nitrogen and homogenized in microcentrifuge tubes with 500 μl of extraction solution prepared with 100 mM Tris-HCl/20 mM EDTA containing 1.4 M NaCl, 2% cetyl trimethyl ammonium bromide, 2% polyvinylpyrrolidone-40, and 0.2% β-mercaptoethanol. After homogenization, the microcentrifuge tubes were shaken gently and incubated at 60 C for 30 min, and DNA was extracted according to the protocol by Doyle and Doyle (Reference Doyle and Doyle1990). The DNA of each sample was quantified in a UV-visible spectrophotometer (Picodrop®;Victory Scientific, Sewell, NJ, USA); it was possible to check the DNA concentration per microliter of each sample to dilute them to 10 ng µl−1 for use in a polymerase chain reaction (PCR).
Amplification Reactions Using Microsatellite Primers
Ten pairs of primers for SSR previously developed for horseweed [Conyza canadensis (L.) Cronquist] and showing transferability to C. sumatrensis—HW02, HW04, HW06, HW21, HW27, and HW29 (Abercrombie et al. Reference Abercrombie, Anderson and Baldwin2009) and HWSSR01, HWSSR03, HWSSR04, and HWSSR09 (Okada et al. Reference Okada, Hanson, Hembree, Peng, Shrestha, Stewart and Jasieniuk2013)—were used to amplify the DNA samples by PCR. PCR was performed using a Veriti 96 Well (Applied Biosystems, Thermo Fisher Scientific, Waltham, MA, USA). The reaction mixtures were prepared in microtubes (0.2 ml) with a final volume of 20 μl per reaction, containing 20 ng of DNA; reaction buffer 1× (10 mM Tris-HCl, pH 8.3; 50 mM KCl); 2.0 mM MgCl2; 1 mM each of dATP, dGTP, dCTP, and dTTP; 0.4 μM each primer (F and R primers); 1 unit of Taq Polymerase Platinum (Invitrogen, Thermo Fisher Scientific, Waltham, MA, USA); and Milli-Q® water (Merck Group, Darmstadt, Germany) to bring the reaction to the final volume. Microsatellite amplification was initially performed with initial denaturation at 94 C for 5 min, followed by 34 cycles at 94 C for 40 s; annealing was carried out at 55 C for 40 s, and extension was at 72 C for 30 s; the final extension was at 72 C for 5 min.
Electrophoresis was performed in 4% agarose gel (50% agarose UltraPureTM [Invitrogen] and 50% agarose MetaphorTM [Lonza Bioscience, Morrisville, NC, USA]) using 0.5× TBE buffer (44.5 mmol L−1 Tris, 44.5 mmol L−1 boric acid, and 1 mmol L−1 EDTA) at 60 V for about 3 h. Each gel was stained with ethidium bromide at 0.5 μg ml−1, and the image was captured using an L-Pix HE (Loccus do Brasil LTDA Cotia, São Paolo, Brazil) and the software L-Pix Image (Loccus do Brasil LTDA Cotia, São Paulo, Brazil). The sizes of the amplified DNA segments (alleles) were determined using a 100-bp DNA Ladder (Invitrogen).
Polymorphism Analysis
Polymorphisms from SSR loci were analyzed with POPGENE v. 1.32 (Yeh et al. Reference Yeh, Yang and Boyle1999) to estimate the average number of alleles per locus (N a), the average observed heterozygosity (H o), the expected heterozygosity (H e), and the genetic diversity (F ST) among the biotypes of C. sumatrensis of the 50 invaded areas. Analysis of molecular variance (AMOVA; GenAlEx v. 6.5; Peakall and Smouse Reference Peakall and Smouse2012) explored the hierarchical partitioning of genetic variation within and between the biotypes of the 50 invaded areas. Genetic identity (Nei Reference Nei1978) and distances among 50 C. sumatrensis populations from different sites were also calculated. The Mantel test was applied to investigate whether the differentiation among the C. sumatrensis biotypes is related to geographic distances, using GenAlEx v. 6.5 (Peakall and Smouse Reference Peakall and Smouse2012).
The biotypes were also examined for evidence of a genetic bottleneck. A test for heterozygosity excess was employed to detect bottlenecks under the infinite alleles model and the stepwise mutation model using Bottleneck v. 1.2.02 (Cornuet and Luikart Reference Cornuet and Luikart1996).
DARwin software v. 6.0.021 (Perrier and Jacquemoud-Collet 2019) was used to calculate the pairwise dissimilarity coefficient matrix from allelic data, using 1,000 bootstraps. The pairwise dissimilarity coefficient matrix generated was used to perform a principal coordinate analysis (PCoA) and to construct a hierarchical clustering tree, also using DARwin v. 6.0.021. PCoA is a distance-based model using jointly a dissimilarity matrix calculated with a simple-matching index and a factorial analysis.
Polymorphism in the SSR loci was also analyzed using the software Structure v. 2.0 (Pritchard et al. 2003) to evaluate the level of genetic admixture among the 50 biotypes of C. sumatrensis. The genotypes were clustered, with the number of clusters (K) ranging from 2 to 20 and were tested using the admixture model with a burn-in period of 5,000 repeats followed by 50,000 Markov chain Monte Carlo repeats, considering the presence and absence of alleles across the sample. The true number of populations (K) is often identified using the maximal value of ΔK returned by the software. The most likely number (K) of subpopulations was identified as described by Evanno et al. (Reference Evanno, Regnaut and Goudet2005). The graphical output display of the Structure results was taken as input data using the Structure Harvester, a website and software that are used to visualize Structure output and to implement the Evanno method (Earl and Von Holdt Reference Earl and Von Holdt2012) to display a graphical representation.
Results and Discussion
DNA genomic quantification indicated that the amount of DNA ranged from 34.2 to 1,550.6 ng µl−1. A total of 42 alleles, which is an average of 4.2 alleles per locus, were detected in the 500 C. sumatrensis plants. Six alleles in locus HWSSR01; five in loci HW02, HW21, HW27; four in loci HW04, HW06, HWSSR03, HWSSR04; three in locus HWSSR09; and two in locus HW29 were observed in biotypes of C. sumatrensis of the 50 invaded areas (Table 2).
Nucleotide sequences of the SSR primers, simple sequence repeats of each primer (SSR), number of alleles (N a) detected by each primer in the Conyza sumatrensis, and variation in allele size (bp) detected in the samples.

The estimated proportion of SSR polymorphic loci (%P) ranged from 30% (in Mamborê 1 [PR]) to 100% (in 17 invaded fields). The highest proportion of SSR polymorphic loci (100%) was observed in 34% of biotypes. A low proportion of SSR polymorphic loci (P < 50%) was observed only in three biotypes (Luiziana [PR], Mamborê 1 [PR], and Palmital [SP]), while a high proportion of SSR polymorphic loci (P ≥ 50%) was detected in 94% of biotypes (Table 3).
Percentage of polymorphic locus (%P), number of alleles (N a) and number of effective alleles (Ne) per polymorphic SSR locus, mean observed heterozygosity (H o) and expected heterozygosity (H e), and richness of alleles (A) in biotypes of Conyza sumatrensis from 50 invasive areas in soybean fields of southern (Rio Grande do Sul [RS], Santa Catarina [SC], and Paraná [PR] states), southeastern (São Paulo [SP] State), and midwestern (Mato Grosso do Sul [MS] State) Brazil.

The observed (H o) and expected (H e) mean heterozygosity rates were also different in 50 C. sumatrensis biotypes. The molecular diversity was the highest (H e = 0.5535) in biotypes from Ouro Verde do Oeste 1 (PR). The H e > 0.50 was detected in five biotypes (Abelardo Luz [SC], Goioerê [PR], Guaíra 2 [PR], Ouro Verde do Oeste 1 [PR], and Ouro Verde do Oeste 2 [PR]), while the lowest molecular diversity (H e < 0.20) was detected in the biotypes of four invaded fields (Quinta do Sol [PR], Luiziana [PR], Palmital [SP], and Mamboré 1 [PR]). The expected mean heterozygosity (0.6287) was higher than the observed mean heterozygosity (0.2222) in the 50 biotypes, indicating a deficit of loci in heterozygosis (Table 3).
The high polymorphism (100%) and genetic diversity at the molecular level within the C. sumatrensis biotypes (H e = 0.6287) detected in our study are in accordance with the high levels of polymorphism and expected heterozygosity reported in a few biotypes studied by Marochio et al. (Reference Marochio, Bevilaqua, Takano, Mangolim, Oliveira and Machado2017). On the other hand, the low polymorphism and expected heterozygosity (H e < 0.20) observed in biotypes from four invaded fields (Luiziana, Quinta do Sol, Mamborê 1, and Palmital) support our hypothesis that different genetic diversity may be detected within biotypes from different invaded areas. A high or low level of genetic diversity is relevant information when predicting population response to chemical control. According to Ye et al. (Reference Ye, Mu, Cao and Cao2003), herbicides and biocontrol agents may have more immediate impact and longer-term efficacy when used on weed plant populations with lower levels of genetic diversity. Alternatively, high genetic variation at the population level might be particularly advantageous for a particular species due to the increased ability to respond differently to new selection pressures, such as different herbicide modes of action (Erfmeier et al. Reference Erfmeier, Hantsch and Bruelheide2013).
The global deficit of heterozygotes (F IS) in the 50 biotypes was 0.3899, which seemed either high or low depending on the individual SSR locus analyzed (Table 4). The analysis of the HWSSR03 locus (F IS = 0.7894) indicated the highest value for homozygote excess, while at the HW29 locus, the F IS value was negative (F IS = −0.8954) indicating heterozygote excess. The positive global value of F IS indicated a 38.99% deficit in heterozygous plants. The selective pressures arising from herbicide applications may lead to an excess of homozygous plants. Increased homozygosity may lead to a great number of deleterious recessive alleles, with a subsequent lowering of fitness. Reduced heterozygosity reduces the fitness of inbred individuals at loci in which heterozygous specimens have a relative advantage over homozygous specimens (Allendorf and Luikart Reference Allendorf and Luikart2007). On the other hand, high heterozygosity may indicate a considerable amount of adaptive genetic variations to escape the effects of a control agent.
Deficit of heterozygous (F IS), genetic divergence (F ST), and gene flow (N m) in 10 SSR loci of the biotypes of Conyza sumatrensis from 50 invasive areas in soybean fields of southern Brazil.

The genetic divergence represented by the F ST rate was high (0.4208) and indicated that different allelic frequencies conferred 42.08% of genetic divergence among the C. sumatrensis biotypes from 50 soybean fields. According to Wright’s F-statistic (Wright Reference Wright1978), values of F st ranging from 0.01 to 0.05 indicate minimal divergence among populations; those from 0.05 to 0.15 indicate moderate divergence, whereas those ranging from 0.15 to 0.25 indicate high genetic divergence. The observed F st > 0.25 indicates very high genetic divergence among the 50 C. sumatrensis populations. Because the gene flow determined from F ST, [F ST = 0.25 (1 − F ST)/F ST], was intermediate (N m = 0.3441; 0.25 < N m < 1.0) among the samples from the 50 biotypes, a moderate allelic transfer has been suggested, owing to seeds or seedlings being transferred from one site to another, or to the invasion of a new field, or even as result of vegetative propagation. AMOVA showed higher genetic variation within (54%; sum of squares = 2,530.8; variance components = 5.6) than among (46%; sum of squares = 2,645.6; variance components = 53.99) the 50 biotypes.
The self- and cross-pollinating mating systems reported in C. sumatrensis (Hao et al. Reference Hao, Qiang, Liu and Cao2009) might contribute to genetic diversity and to the species’ successful invasive capability. Higher genetic variation within than among the biotypes from the 50 fields support an indication of cross-pollination occurrence in C. sumatrensis. High genetic diversity within populations and relatively low diversity among populations are observed in outcrossing species (Clasen et al. Reference Clasen, Moss, Chandler and Smith2011). The versatile mating system in C. sumatrensis may ensure production of a significant number of seeds by self- or cross-pollination, contributing also to the species’ success in invasion. Studies by Hao et al. (Reference Hao, Qiang, Liu and Cao2009) have provided evidence for a nonspecialized pollination mechanism that does not require specialized pollinators.
Environmental effects may also induce different genetic diversity detected within C. sumatrensis biotypes from different invaded fields. Different climate conditions could cause different environmental selection pressures in invasive populations (Tang and Ma Reference Tang and Ma2020). Different physical, chemical, and biological soil properties could select seeds with different physiological potential (Vaz Mondo et al. Reference Vaz Mondo, Gomes Junior, Pinto, Marchi, Motomiya, Molin and Cicero2012). Different environmental selection pressures may lead to the selection of favorable genetic variation to adapt to different climates and environments (Williams et al. Reference Williams, Cook, Smerdon, Cook, Abatzoglou, Bolles, Baek, Badger and Livneh2020). Differential selection of favorable genetic variation may determine different genetic diversity within biotypes in different invaded areas. Smith et al. (Reference Smith, Hodkinsonc, Villellasd, Catforde, Csergö, Blombergh, Cronei, Ehrlénj, Garciak, Lainel, Roachn, Salguero-Gómezo, Wardlep, Childsq and Elderdr2020) showed that environmental gradients characterized by mean temperature, temperature seasonality, and mean precipitation affected population growth rate, fecundity, and neutral and adaptive genetic diversity in native and nonnative ranges of narrow leaf plantain (Plantago lanceolata L.).
In the bottleneck tests for heterozygosity excess (Table 5), the infinite allele model showed evidence of bottlenecks in biotypes of 29 invaded fields (58%) of C. sumatrensis, and the stepwise mutation model showed evidence of bottlenecks in biotypes of 11 invaded fields (22%). Table 5 shows the probabilities (P < 0.05) of each population in balance between mutation and genetic drift (Cornuet and Luikart Reference Cornuet and Luikart1996) evaluated with the Signal test, standardized differentiation test, and Wilcoxon test, according to the infinite allele models mutation (IAM; Kimura and Crow Reference Kimura and Crow1964) and stepwise mutation model (SMM; Ohta and Kimura Reference Ohta and Kimura1973) with heterozygosity excess (H > H e) detected in the SSR loci. The heterozygosity excess supports the conclusion that a recent bottleneck effect took place in 58% of the biotypes. The Wilcoxon test for heterozygosity excess showed a recent bottleneck effect in biotypes of 10 invaded fields (50%) for the two models. According to assumptions that all loci fit one of the two models, no heterozygosity excess was detected in SSR loci of the biotypes of 21 invaded fields (42%).
Expected number of loci with excess heterozygosity (N), numbers of loci with deficit (D) and excess (E) heterozygosity, and the probabilities (P) of populations in balance between mutation and genetic drift evaluated with the Signal test, standardized differentiation test, and Wilcoxon test, according to the mutation to infinite allele models mutation (IAM) and stepwise mutation model (SMM).

The founder effect associated with initial colonization may reduce genetic diversity in the weed biotypes from the four areas, while multiple introductions and hybridization may generate genetic diversity within invading plants. The bottleneck effect was seen in biotypes with reduced genetic diversity and also in biotypes with the highest genetic diversity (Ouro Verde do Oeste 1, Abelardo Luz Guaíra 2, Ouro Verde do Oeste 2, Goioerê). In invasion processes, genetic variation is often reduced, because weed populations are established by a small number of founders that represent only a fraction of the original genetic diversity (Dlugosch and Parker Reference Dlugosch and Parker2008; Voss et al. Reference Voss, Eckstein and Durka2012; Zhang et al. Reference Zhang, Zhang and Barrett2010). Bottleneck effects may be reduced by introductions of genetically differentiated populations (Zhao and Lou Reference Zhao and Lou2017). According to Tang and Ma (Reference Tang and Ma2020), the founder effect and multiple introductions are antagonistic processes in genetic diversity that could occur in different invasion events of the same species. Thus, different invasion events may generate biotypes with different genetic diversity. Several studies have shown that the admixture of seeds and/or invading propagules in each area can lead to hybrid vigor through recombination (Facon et al. Reference Facon, Jarne, Pointier and David2005, Reference Facon, Pointier, Jarne, Sarda and David2008; Keller and Taylor Reference Keller and Taylor2010; Keller et al. Reference Keller, Gilbert and Fields2012; Lavergne and Molofsky Reference Lavergne and Molofsky2007; Lucardi et al. Reference Lucardi, Wallace and Ervin2020; Verhoeven et al. Reference Verhoeven, Macell, Wolfe and Biere2011) and may increase genetic diversity.
Allelic fixation was observed in biotypes from 32 invaded fields (Table 6). The HW04 183 , HWSSR09 186 , and HW06 188 alleles were more commonly fixed in biotypes from nine and seven invaded areas, respectively. Allelic fixation was higher in the biotypes from Mamborê 1 (7 alleles); Luiziana and Palmital (6 alleles); and Saldanha Marinho, Caarapó, and Itaquiraí (5 alleles). The highest numbers of fixed alleles were observed in biotypes with low mean observed heterozygosity (H o < 0.20). A high number of fixed alleles were observed in biotypes with high (Itaquiraí; 68.7%) and low (Saldanha Marinho; 2.5%) glyphosate resistance. The allelic fixation observed in biotypes of C. sumatrensis from 32 different invasive fields may be a result of genetic drift or selective pressures. Genetic drift may be due to the bottleneck effect or to the founder effect (Andrews Reference Andrews2010). Bottleneck effect in 58% of the biotypes, probably in response pressure caused by herbicide applications, and founder effect due to invasion processes by a small number of founder seeds were both admitted in our study. Moreover, C. sumatrensis is subjected to chemical control, particularly the intense human-induced selective pressure caused by herbicide applications, and this may lead to random allelic fixation. The alleles HW04 183 , HWSSR09 186 , and HW06 188 were the most commonly fixed in biotypes of C. sumatrensis. However, no relationship was observed between the presence of most commonly fixed alleles, HW04 183 , HWSSR09 186 , and HW06 188 , and the proportion of biotypes with low or high resistance.
Allelic fixation, mean heterozygosity observed (H o), and rate of Conyza sumatrensis biotype glyphosate resistance (GR) in each invaded area.

The low value obtained with the Mantel test (R2 = 0.1032) showed that the differentiation among the C. sumatrensis biotypes is not related to geographic distances between them. Higher genetic identity (I = 0.9174) was observed between the biotypes from Palotina (PR) and Mamborê 2 (PR), while lower identity (I = 0.1644) was observed between the biotypes from São José do Ouro (RS) and Maringá (PR) (Supplementary Table S1).
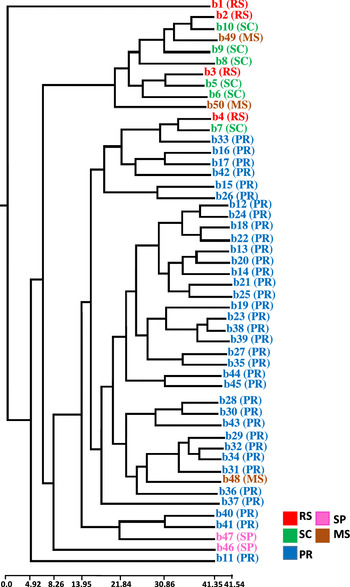
The unweighted pair group method with arithmetic mean (UPGMA) dendrogram obtained from the cluster analysis of Nei’s (1978) unbiased genetic distance (Figure 2) revealed the formation of four main groups, one smaller group, and four isolated groups. One group comprised biotypes from invaded fields in RS, SC, and MS; a second comprised biotypes from invaded fields in RS, SC, and PR; a third comprised biotypes only from invaded fields in PR; a fourth comprised biotypes from invaded fields in PR and MS. The smallest group was formed by biotypes from invaded fields in PR and SP. The isolated groups were formed by biotypes from RS (b1), PR (b37), SP (b46), and PR (b11) states (Figure 2).
Relationships among biotypes of Conyza sumatrensis from 50 invaded areas in the states of Rio Grande do Sul (RS), Santa Catarina (SC), Paraná (PR), São Paulo (SP), and Mato Grosso do Sul (MS), based on unweighted pair group method with arithmetic mean (UPGMA) cluster analysis of the allele polymorphism at SSR loci by Jaccard’s similarity coefficient.

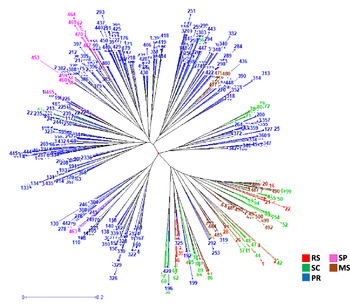
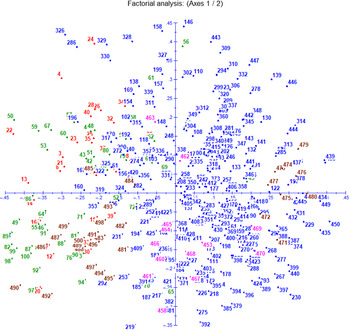
The radial unrooted tree generated from data of the 10 SSR primers according to the unweighted neighbor-joining method (UNJ) using DARwin v. 6.0.021 software showed the 500 plants in six larger groups (Figure 3). Dendrogram analysis showed one heterogeneous group (I) formed by biotypes from four geographic regions in RS, SC, PR, and MS and five mostly homogeneous groups formed predominantly by biotypes from PR, with low mixture of biotypes from SC (II), MS and SC (III), SP (IV), SC and SP (V), and SP (VI). The graphical representation of the PCoA showed the dispersion pattern of plants from five geographic regions. The dispersion pattern does not have a close relationship with the region where samples were collected; an admixture of biotypes from five, four, and three geographic regions may be observed in Figure 4.
The radial unrooted tree generated from data on allele polymorphism at SSR loci according to the unweighted neighbor-joining method (UNJ) showing the 500 plants of Conyza sumatrensis from 50 invaded areas in the states of Rio Grande do Sul (RS), Santa Catarina (SC), Paraná (PR), São Paulo (SP), and Mato Grosso do Sul (MS) in six larger groups (I–VI).

The graphical representation of the PCoA showing the dispersion pattern of 500 plants of Conyza sumatrensis from 50 invaded areas in the states of Rio Grande do Sul (RS), Santa Catarina (SC), Paraná (PR), São Paulo (SP) and Mato Grosso do Sul (MS).

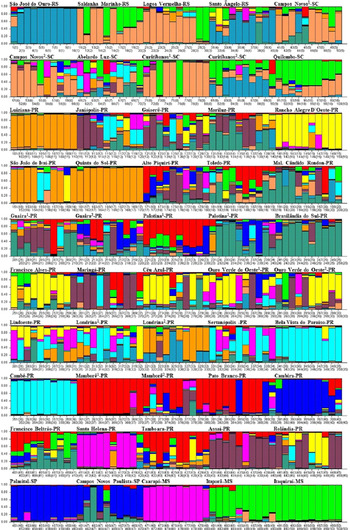
In the clustering of the 500 plants according to a model-based Bayesian algorithm, the bar plot was obtained for the K-value (K = 11; ΔK = 8.3624), and the results were consistent with the evidence of low and high levels of genetic admixture at 62% and 38%, respectively, of the C. sumatrensis biotypes (Figure 5; Table 7). Plants sharing alleles from the 11 groups were observed in 38% of biotypes, while in 62% of biotypes more than 50% of plants were observed predominantly in one of the 11 groups (Table 7). In 18% of biotypes, a higher proportion of plants (>80%) were predominantly observed in groups I (Mamborê 1, PR), II (Itaquiraí, MS), III (Palmital, SP), V (Caarapó, MS), VI (Bela Vista do Paraíso, PR; Cambé, PR), VII (Luiziana, PR; Quinta do Sol, PR), and X (São José do Ouro, RS), indicating a lower level of genetic admixture.
Bar plot–like population structure based on microsatellite markers for plants of Conyza sumatrensis from 50 invaded areas in the states of Rio Grande do Sul (RS), Paraná (PR), São Paulo (SP), and Mato Grosso do Sul (MS), within the K clusters. Each plant is represented by a single vertical bar broken into K colored segments (K = 3), with lengths proportional to each of the K inferred clusters. Each color represents the proportion of DNA segments for each plant, represented by a vertical bar, in each group.

Proportion of Conyza sumatrensis plants from each invaded area in each group (K = 11) according to a model-based Bayesian algorithm in 11 different groups.

The differential frequencies of alleles at SSR loci were sufficiently high to determine the genetic structure of the C. sumatrensis biotypes from 50 invasive fields of southern, southeastern, and midwestern Brazil. The genetic divergence represented by the high rate of F ST (F ST > 0.15; Wright Reference Wright1978) and by the dendrogram (Figure 3) also suggests differential selective pressures on the C. sumatrensis biotypes from 50 invaded areas. The dendrogram showed only one heterogeneous group and five more homogeneous groups formed predominantly by biotypes from PR with a limited mixture of biotypes. Genetic divergence has led to the formation of five genetically structured groups in the biotypes of invaded fields in PR. It is notable that highly differentiated biotype populations in nearby invaded fields may increase the risk that one or more populations may not respond to a single management practice.
Despite the high genetic divergence, the gene flow (N m = 0.3441) was moderate, suggesting an exchange of alleles or dispersion of samples among invaded areas. Seeds of one or more fields may be carried to other fields by wind dispersal or via the movements of agricultural machinery. Seeds of C. sumatrensis may travel more than 100 m (Dauer et al. Reference Dauer, Mortensen and Vangessel2007), while the movements of agricultural machinery can even involve different states. Dendrograms (Figures 2 and 3) have provided evidence for a mixture of biotypes from SC, MS, and SP in homogeneous groups formed predominantly by biotypes from PR. Some invaded areas might have started with relatively few individuals that bear little relation to the geographic or ecological distance from the original invaded area.
The invasive potential and rapid range expansion of C. sumatrensis have been attributed to its persistent fecundity and high germination rate (Hao et al. Reference Hao, Qiang, Liu and Cao2009); its production of a large number of small, wind-dispersed seeds, ranging up to more than 200,000 seeds per plant (Sansom et al. Reference Sansom, Saborido and Dubois2013); and its high resistance to diseases, herbivory, and herbicides (Santos et al. Reference Santos, Vargas, Christoffoleti, Agostinetto, Martin, Ruchel and Fernando2014a). Santos et al. (Reference Santos, Oliveira, Constantin, Francischini and Osipe2014b, 2015) reported differential sensitivity to herbicides according to the stage of development of the plants, while Schneider et al. (Reference Schneider, Rizzardi, Brammer, Scheffer-Basso and Nunes2020) reported the overexpression of genes in the resistant biotype treated with glyphosate. Differential sensitivity to herbicides according to growth stage was also reported in C. canadensis and C. sumatrensis populations by Travlos and Chachalis (Reference Travlos and Chachalis2013).
High genetic diversity has been frequently reported in invasive species (Matesanz et al. Reference Matesanz, Theiss, Holsinger and Sultan2014; Minati et al. Reference Minati, Preston and Malone2020; Xu et al. Reference Xu, Tang, Fatemi, Gross, Julien, Curtis and Van Klinken2015; Zhao and Lou Reference Zhao and Lou2017). It is considered to be one of the factors that leads to the success of the potential invasion. However, the results of our analysis of 500 plants of C. sumatrensis from 50 invaded fields showed high and low genetic diversity not associated with the geographic distribution, bottleneck effects, or higher or lower resistance to glyphosate. Data on genetic diversity, bottleneck effects, and glyphosate resistance showed contrasts in biotypes from nearby invaded fields, such as Sertanópolis (PR), Bela Vista do Paraíso (PR), Cambé (PR), Guaíra 1 (PR), Guaíra 2 (PR), Palotina 1 (PR), Palmital (SP), Campos Novos Paulistas (SP), Campos Novos 1 (SC), and Campos Novos 2 (SC) (Figure 1; Tables 3, 5, and 6). Environmental effects, physical, chemical, and biological properties of soil, and herbicide application were supposedly causative agents of differential genetic variability in C. sumatrensis. Although environmental effects (different climate conditions) and physical, chemical, and biological soil properties (Smith et al. Reference Smith, Hodkinsonc, Villellasd, Catforde, Csergö, Blombergh, Cronei, Ehrlénj, Garciak, Lainel, Roachn, Salguero-Gómezo, Wardlep, Childsq and Elderdr2020; Tang and Ma Reference Tang and Ma2020; Vaz Mondo et al. Reference Vaz Mondo, Gomes Junior, Pinto, Marchi, Motomiya, Molin and Cicero2012) have been reported as determinant agents of differential genetic diversity in invasive species, our study has shown different genetic diversity in biotypes of C. sumatrensis from fields under the same climatic conditions.
Different genetic diversity cannot be explained by geographic distance. Herbicide applications may have contributed to generating different genetic diversity and genetic divergence between biotypes of C. sumatrensis from fields under the same climatic conditions. The combined use of herbicides with different mechanisms of action in different concentrations to control resistant biotypes has been reported (Oliveira et al. Reference Oliveira, Guerra, Osipe, Franchini, Adegas, Osipe, Constantin, Oliveira and Oliveira Neto2013; Santos et al. Reference Santos, Vargas, Christoffoleti, Agostinetto, Martin, Ruchel and Fernando2014a, 2014b, 2015). Thus, the application of different doses and combinations of herbicides has been proposed as more effective a way to facilitate the control of the species, but these different applications may be one of the main factors that promote differentiated selection that hinders control. The rotation of herbicide mechanisms of action is necessary to provide efficient control of resistant biotypes, but it may lead to an increased diversity and genetic divergence among the populations in different invaded areas. The selective pressures exerted by herbicide applications in different doses and combinations, as well as spatial variability of soil properties (Mzuku et al. Reference Mzuku, Khosla, Reich, Inman, Smith and MacDonald2005; Reichert et al. Reference Reichert, Dariva, Reinert and Silva2008; Tola et al. Reference Tola, Al-Gaadi, Madugundu, Zeyada, Kayad and Biradar2017) and the different herbicide application methodologies available (Chethan et al. Reference Chethan, Singh, Dubey, Subhash and Dibakar2019), may contribute to generating high genetic divergence between biotypes and boost the invasiveness of C. sumatrensis. The polymorphism in the SSR loci revealed in our study may be useful in monitoring the effects of combinations and rotating applications of herbicides on the diversity and genetic divergence between biotypes of C. sumatrensis from different invaded fields. The polymorphism analysis in the SSR loci was important to identify the biotypes with low (Quinta do Sol [PR], Luiziana [PR], Palmital [SP], and Mamboré 1 [PR]) and higher (Ouro Verde do Oeste 1 [PR], Ouro Verde do Oeste 2 [PR], Abelardo Luz [SC], Goioerê [PR], and Guaíra 2 [PR]) genetic diversity in order to assess whether pressures exerted by herbicide applications in different doses and combinations may contribute to generating high genetic diversity and divergence between the biotypes of C. sumatrensis. Future investigations can use data from the present study to assess whether there is a periodic dynamic in the genetic diversity within each invaded area in response to different control measures.
Supplementary material
To view supplementary material for this article, please visit https://doi.org/10.1017/wsc.2021.59
Acknowledgments
The authors would like to thank CAPES (Coordenação de Aperfeiçoamento de Pessoal de Nível Superior, Brasília DF Brazil) for financial support (Finance Code 001). The authors declare that they have no conflict of interest.