I. INTRODUCTION
Most pharmaceutical materials, the so-called active pharmaceutical ingredients (APIs) and the excipients, are in solid phase. In addition, the most common drug products, tablets or capsules, are solids as well. The choice of the form of drug depends on several physicochemical factors associated with its stability, solubility, bioavailability, efficacy, and manufacturing. Different polymorphs and compositions (solvates, anhydrates, etc.) of a given API can display different physicochemical and mechanical properties. Therefore, it is important to properly characterize all the materials, APIs, and excipients, involved in the manufacture of a drug in order to ensure the quality, safety, and efficacy of a product (Zhang et al., Reference Zhang, Law, Schmitt and Qiu2004; Cui, Reference Cui2007).
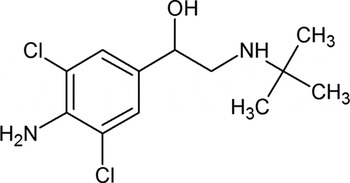
Clenbuterol (Figure 1), usually marketed as a hydrochloride, is an API used as a bronchodilator in treatment of reversible obstructions in the respiratory system, as in asthma and in other chronic obstructive pulmonary diseases. Clenbuterol has also been used to promote weight gain in animals raised for human consumption. This drug has been used in sports for its anabolic effects. It is a stimulant of the central nervous system and produces an increase in aerobic capacity, blood pressure, and oxygen transportation (Sweetman, Reference Sweetman2009). In recent years, athletes from different disciplines have been penalized, suspended from competition, and even stripped of their titles for testing positive for clenbuterol. In several cases, the athletes have claimed that they have consumed the drug inadvertently, due to food contamination.
Chemical structure of clenbuterol.

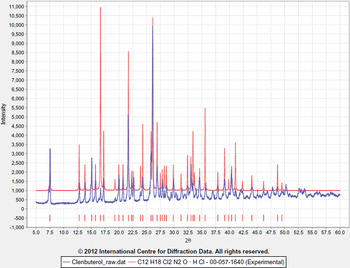
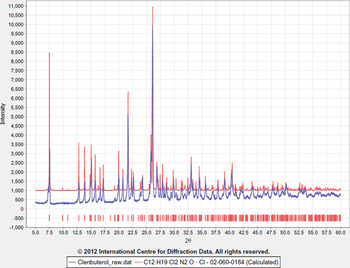
A search of the Cambridge Structural Database, V 5.33 (Allen, Reference Allen2002), of the clenbuterol skeleton (omitting hydrogen atoms) resulted in five entries. These entries have their calculated powder diffraction pattern incorporated in the PDF-4/Organics database. Three of them correspond to its hydrochloride phase: the racemic mixture (PDF 02-060-0184, CSD Refcode ACBUET), the S isomer (PDF 02-089-4160, Refcode SAZRUH), and the R isomer (PDF 02-089-4161, Refcode SAZSAO). Two additional entries correspond to Cu-clenbuterol solvated complexes: with MeOH (Refcode QAXFUR) and DMSO (Refcode QAXFOL), respectively. The PDF-4/Organics also contain an entry with an experimental unindexed pattern (PDF 00-057-1640).
As part of the work being carried out in our laboratory to characterize common active pharmaceutical ingredients and to examine the possible formation of polymorphs under different crystallization conditions, a study by FT-IR spectroscopy, thermal analysis (TGA-DSC), and X-ray diffraction of a new form of clenbuterol was performed.
II. EXPERIMENTAL
A. Crystallization of clenbuterol
A sample of clenbuterol hydrochloride, a white solid with a melting point of 173 °C, was dissolved in water. The pH of the solution was adjusted using NH4OH. Several extractions with ether were carried out and the extracts were allowed to evaporate at room temperature. Melting points were determined using a digital melting point apparatus (Model 9100, Electrothermal Engineering Ltd).
B. IR spectroscopy and thermal analysis
The FT-IR spectra were recorded in KBr pellets, using a Perkin-Elmer PE-1600X spectrophotometer with IRDM software. Thermogravimetric analysis (TGA/DTG) and differential scanning calorimetry measurements (DSC) were performed in a thermal analyzer SDT Q600 V3 using 6.0670 mg of sample heated to 350 °C, at a rate of 10 °C/min, under a dynamic nitrogen atmosphere at 120 mL/min.
C. X-ray powder diffraction data collection
Powder diffraction patterns were recorded at room temperature on a Bruker D8 Advance diffractometer working in Bragg-Brentano geometry using CuKα radiation (λ = 1.541 87 Å), operating at 50 kV and 30 mA. The pattern was recorded in steps of 0.01526° (2θ), from 5 to 60° at 2 sec/step. The diffractometer was equipped with a secondary monochromator and a LynxEye detector.
D. Single-crystal X-ray data collection
Intensity data were collected at room temperature on a colorless plate with dimensions 0.49 × 0.27 × 0.13 mm3 using a Bruker APEX Duo diffractometer with MoK α radiation (λ = 0.710 73 Å) and a graphite monochromator. Data collection and unit-cell refinement were carried out with SMART and data reduction with SAINT, both are Bruker proprietary software. A total of 3770 unique reflections were obtained from 22654 reflections measured (R int = 0.0165, R σ =0.0114).
III. RESULTS
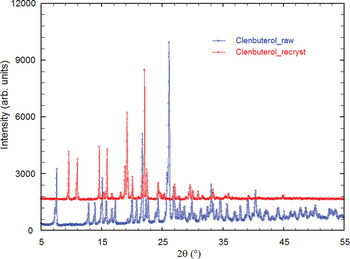
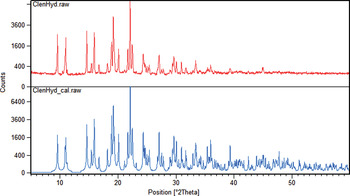
The diffraction pattern recorded for raw clenbuterol hydrochloride is similar to the unindexed pattern reported in entry PDF 00-057-1640 of PDF-4/Organics (Figure 2) and to the pattern calculated (Figure 3) for racemic mixture of this material (PDF 02-060-0184, ACBUET). However, the pattern for the crystals obtained after recrystallization is different from the experimental pattern of the raw material and all the entries in the PDF (Figure 4).
Comparison of the powder diffraction pattern of clenbuterol_raw (blue) with PDF 00-057-1640 (red).

Comparison of the powder diffraction pattern of clenbuterol_raw (blue) with PDF 02-060-0184 (red).

Comparison of the PDP of raw clenbuterol with the pattern of the recrystallized material.

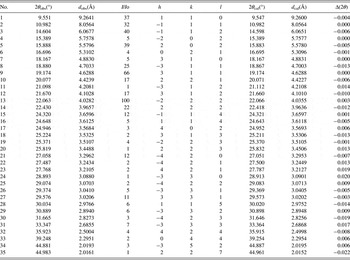
The indexing of this pattern carried out using DICVOL06 (Boultif and Louër, Reference Boultif and Louër2004) produced a monoclinic unit cell with parameters: a = 16.256(3) Å, b = 11.276(3) Å, c = 15.819(3) Å, β = 91.82(2)° and V = 2898.34 Å3. The figures of merit associated with indexing were M20 = 25.9, F 30 = 48.2 (0.0090, 69). Table I contains the corresponding powder diffraction data. This pattern, in PD3 format, will be submitted for inclusion in the Powder Diffraction File. The fitting of the whole pattern, using the above mentioned unit cell parameters, with the Le Bail algorithm implemented in FULLPROF (Rodriguez-Carvajal, Reference Rodriguez-Carvajal1990) accounts for all the diffraction maxima recorded. The comparison of the powder diffraction pattern (PDP) of this phase with the pattern calculated using single crystal data (SCD) obtained in structural analysis is shown in Figure 5. Both analyses clearly indicate the formation of a new clenbuterol phase.
Comparison of the PDP of recrystallized clenbuterol with the pattern calculated using the SCD data obtained.

X-ray powder diffraction data of clenbuterol·0.5H2O.

The FT-IR spectrum of raw clenbuterol indicates that the amino group is protonated (–OH stretch: ν = 3401.00 cm−1 and ν = 2628.30 cm−1 for the –NH+ stretch). In contrast, the spectrum for the recrystallized clenbuterol form indicates that the amino group is deprotonated (–OH stretch: ν = 3469.80 cm−1).
The new clenbuterol phase melts and immediately decomposes at ~125 °C. This is a different behavior from raw clenbuterol hydrochloride for which melting and decomposition begin at 179 °C, according to the DSC analysis. The TGA curve of the new phase shows that the material is stable up to 80 °C and undergoes a weight loss of 3.795% between 81.8 and 202.53 °C corresponding to the loss of half a molecule of water, followed by melting at 120–126 °C. A weight loss of 87.01%, attributed to total decomposition of the material, occurs at a peak temperature of 263.05 °C.
The single-crystal structural study reveals that this compound crystallizes in space group C2/c with unit cell parameters a = 16.2685(9) Å, b = 11.2647(6) Å, c = 15.8089(9) Å, β = 91.822(1)°, V = 2895.67(29) Å3, and Z = 4. The asymmetric unit contains the formula C12H18Cl2N2O·0.5H2O, consistent with the TGA results. The structure was solved by Direct Methods and refined by least-squares method with SHELXS and SHELXL, respectively (Sheldrick, Reference Sheldrick2008). The graphical user interface, ShelXle, was used in the refinement process (Hübschle et al., Reference Hübschle, Sheldrick and Dittrich2011). Hydrogen atoms were placed in calculated positions and refined using a riding model with their displacement parameters equal to 1.2U iso of the non-hydrogen atom to which they are attached. The refinement converged to R = 0.0386, wR 2 = 0.1139, S = 1.03. A complete account of the structure refinement results will be published elsewhere.
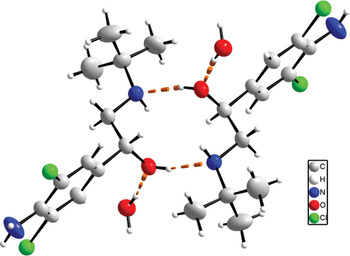
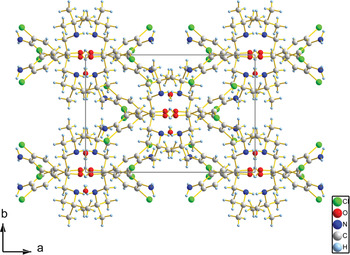
The structure of clenbuterol·0.5H2O can be described in terms of hydrogen bonded dimers (see Figure 6). The hydrogen bonding pattern observed can be represented by the graph set symbol R 22(10)(Etter et al., Reference Etter, MacDonald and Bernstein1990). The water molecules present in the structure, occupying a special position, connect these dimers to other dimers to form chains approximately parallel to the c-axis. Figure 7 shows a view of the unit cell down the c-axis.
Hydrogen bonded dimers with graph set symbol R 22(10)in clenbuterol·0.5H2O.

A view down the c-axis of the structure of clenbuterol·0.5H2O.

Acknowledgements
This work was possible thanks to Grant LAB-97000821 from FONACIT (Universidad de Los Andes) and Grant LOCTI-2007-0003 (INZIT).