This study aims to identify the rare earth element (REE) contents in some levels of the stratigraphic Permian–Neogene sequences in Tunisia that overlie the Palaeozoic basement that has been studied via oil-drilling cores (Jamoussi, Reference Jamoussi2001).
The clay fraction of the examined series is dominated by illite in the Palaeozoic, Triassic and Jurassic, by smectite in the Campanian–Maastrichtian, by palygorskite in the continental Eocene and by halloysites in the Miocene (Jamoussi, Reference Jamoussi2001; Jamoussi et al., Reference Jamoussi, Abbès, Fakhfakh, Bédir, Kharbachi and Soussi2001, 2003). The study field extends from the ‘Saharan Platform’ in the south to the ‘Nappes Zone’ in the north (Fig. 1). Most of these clay minerals have a detrital origin, with some cases of neoformation for palygorskites (Jamoussi et al., Reference Jamoussi, Bédir, Boukadi, Kharbachi, Zargouni, López-Galindo and Paquet2003). The mineralogical variation of the clays in the studied stratigraphic series is the result of the geodynamic history of the basins (Jamoussi, Reference Jamoussi2001; Jamoussi et al., Reference Jamoussi, Bédir, Boukadi, Kharbachi, Zargouni, López-Galindo and Paquet2003). Moreover, the distribution of trace elements is approximately similar in the various investigated levels, reflecting a common origin of the clay minerals.
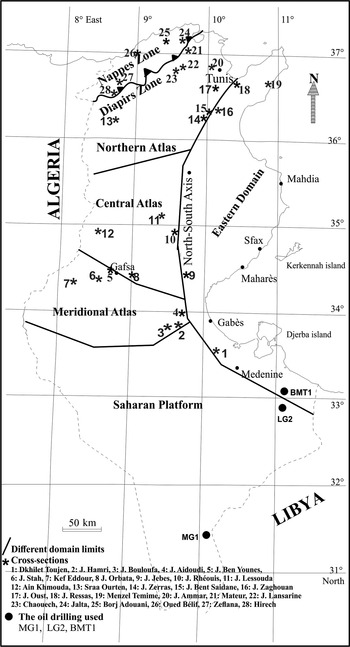
Locations of the cross-sections and petroleum wells studied.

The REEs were studied to specify the origins of the clay minerals and to determine the distribution of lanthanides according to the age of the stratigraphic series and their mineralogical composition along the examined domains. The aim of this work is to describe the chemical composition of the clay minerals in the Palaeozoic, Mesozoic and Cenozoic sequences of the Tunisian margin.
Geological setting
The region examined extends from the ‘Saharan Platform’ in the south, through the Southern, Central, Eastern and Northern Atlas to the ‘Nappes Zone’ (Fig. 1). The stratigraphic succession spreads from the Permian to the Quaternary series. The Palaeozoic rocks of the ‘Saharan Platform’ were investigated using core-drilling samples obtained from hydrocarbon exploration companies (Jamoussi, Reference Jamoussi2001; Jamoussi et al., Reference Jamoussi, Bédir, Boukadi, Kharbachi, Zargouni, López-Galindo and Paquet2003).
The ‘Saharan Platform’ is made up essentially of granitic and metamorphic Precambrian basement rocks covered by Palaeozoic clay–sandstone sub-tabular series (Busson, Reference Busson1967; Memmi et al., Reference Memmi, Burollet and Viterbo1986; Bouaziz, Reference Bouaziz1995). The Southern Atlas includes two major fold chains with a Cretaceous core and, sometimes, with a Jurassic core. More precisely, the ‘Northern Chotts Chain’ in the south and the ‘Gafsa Chain’ in the north are separated by vast plains with continental Neogene filling. These chains originated in the Late Cretaceous from a strike-slip tectonic movement (Zargouni, Reference Zargouni1985; Boukadi, Reference Boukadi1994; Bédir, Reference Bédir1995). The Central Atlas has formed by a succession of north-east to south-west and east to west folded drive structures (Burollet, Reference Burollet1956; Ben Ayed, Reference Ben Ayed1986; M'Rabet, Reference M'Rabet1987; Bédir, Reference Bédir1995). The Eastern Atlas is limited to the west and north-west by the north to south fault called the ‘N–S Axis’ corridor and the Tunisian ridge of Zaghouan (Turki, Reference Turki1985). These structures are separated by syncline gutters with significant accumulations of Neogene sediments and subsident platforms (Colleuil, Reference Colleuil1976; Ben Salem, Reference Ben Salem1992; Bédir, Reference Bédir1995). The Northern Atlas consists of north-east to south-west direction anticlines pouring southwards and arranged in overlapping scales. It is limited to the north by large Triassic structures called the ‘Diapirs Zone’. This area is also characterized by the presence of transverse north-west to south-east management collapse ditches (Solignac, Reference Solignac1927; Crampon, Reference Crampon1973; Rouvier, Reference Rouvier1977; Perthuisot, Reference Perthuisot1978; Ben Ayed, Reference Ben Ayed1986).
The Numidian ‘Nappes Zone’ is made up of turbiditic clay–sandstone sedimentary units (Mahersi, Reference Mahersi1991) of Oligo-Miocene age in an allochthonous position (Rouvier, Reference Rouvier1977). The Numidian ‘Nappes Zone’ was thrust southwards from the Serravallian (Tlig et al., Reference Tlig, Er Raoui, Ben Aissa, Alouani and Tagorti1991).
Three phosphate samples of Palaeocene–Eocene age were added to this work based on the study conducted by Garnit et al. (Reference Garnit, Bouhlel and Javis2017). A sample of rhyodacite, taken from among the rare volcanic points in the northern Tunisian late Miocene (Serravallian–Messinian) magmatic rocks belonging to the post-collisional magmatism of the Mediterranean Maghreb margin in Oued Bélif, was obtained as a reference according to Decrée et al. (Reference Decrée, Marignac, Liégeois, Yans, Ben Abdallah and Demaiffe2014).
Materials and methods
The clay samples studied, collected from several geological cross-sections (Fig. 1), are representative of the lithostratigraphic sequences that crop out in the various geological domains studied. The qualitative and semi-quantitative mineralogical compositions, corresponding to the bulk rock and clay fraction, were identified and estimated using X-ray diffraction (XRD) with a Siemens Kristalloflex 810 diffractometer and Cu-Kα radiation on either random powder for bulk rock or oriented clay-size particles under the following conditions: air dried, saturated with ethylene glycol and heated at 550°C. The clay minerals were quantified using the classic method that measures peak areas and takes into account the corresponding reflective powers. The abbreviations of the clay minerals and associated minerals follow the recommendations and listing of Warr (Reference Warr2020).
Chemical analyses of major elements were carried out using a Perkin-Elmer atomic absorption spectrophotometer. Trace elements and REEs were determined using inductively coupled plasma mass spectrometry (Perkin-Elmer SCIEX Elan-5000 ICP-MS spectrometer) with Rh and Re as internal standards. The accuracy levels were 2 and 5% for elemental concentrations of 50 and 5 ppm, respectively. The detection limits of the elements were 100 ppb for REEs and Th, 5 ppm for transition elements and Cs, Rb, Sr, Ba and Pb and 10 ppm for Li.
Distribution diagrams were smoothed by normalizing REE abundance relative to North American shale composite (NASC; Haskin et al., Reference Haskin, Wildeman, Frey, Collins, Keedy and Haskin1966, Reference Haskin, Haskin, Frey, Wildeman and Ahrens1968; Haskin & Paster, Reference Haskin, Paster, Gschneidner and Eyring1979; Gromet et al., Reference Gromet, Dymek, Haskin and Korotev1984; Jamoussi, Reference Jamoussi2001).
Geochemical evolution of the REEs in the study areas
Thirty-nine clay samples, three phosphate samples and one rhyodacite sample from the various palaeogeographical domains of Tunisia were studied in the present work (Fig. 1). The geochemistry of the major elements shows an abundance of SiO2 and Al2O3 in the clay samples. The clays are slightly ferriferous. The Al2O3 correlates well with Fe2O3, K2O and Na2O (Table 1), indicating that these elements are present in the detrital phyllosilicate phases of the examined samples (Jamoussi, Reference Jamoussi2001). The highest concentrations of Al2O3 were observed in the halloysites of Tamra and Ain Khmouda (Table 1).
Chemical analysis of the major elements (wt.%) from the levels studied.

a Decrée et al. (Reference Decrée, Marignac, Liégeois, Yans, Ben Abdallah and Demaiffe2014).
b Garnit et al. (Reference Garnit, Bouhlel and Javis2017).
LOI = loss on ignition.
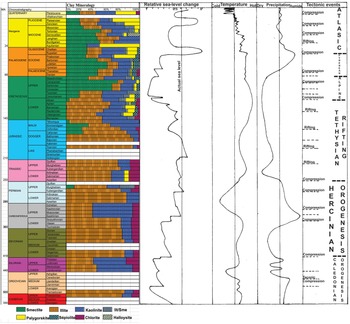
The clay fraction is dominated by illites in the Palaeozoic, Triassic and Jurassic sediments, smectite in the Campanian–Maastrichtian sediments, palygorskite in the continental Eocene and halloysite at some levels of the Miocene (Fig. 2 & Table 2).
Clay mineralogy, eustatism, temperature, precipitation and tectonic relationships in the study area (modified from Jamoussi et al., Reference Jamoussi, Bédir, Boukadi, Kharbachi, Zargouni, López-Galindo and Paquet2003). Ilt/Sme = illite/smectite.

Mineralogical analysis (%) of the levels studied.

Sme = smectite; Ilt = illite; Kln = kaolinite; Ilt/Sme = interstratified illite/smectite; Plg = palygorskite; Sep = sepiolite; Chl = chlorite; Hly = halloysite; Cal = calcite; Dol = dolomite; Qtz = quartz; Gp = gypsum; Kfs = K-feldspar.
a Decrée et al. (Reference Decrée, Marignac, Liégeois, Yans, Ben Abdallah and Demaiffe2014).
bGarnit et al. (Reference Garnit, Bouhlel and Javis2017).
There is a cause/effect relationship between the mineralogical composition of the sediments and the geodynamic history of the basins (Fig. 2). Smectites are present and often abundant during periods with high sea levels, whereas palygorskite confirms the continental character of the deposits.
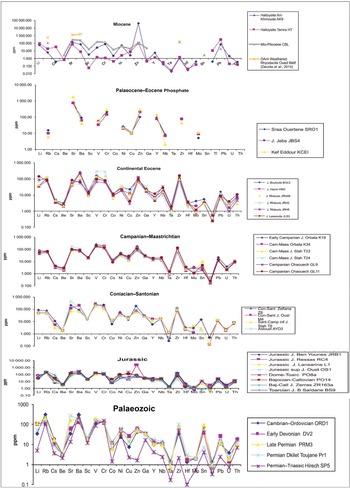
The distribution of trace elements is similar in the various studied levels (Fig. 3 & Table 3), reflecting the common history, origin and evolution of these various clay types and proving the presence of inherited minerals, except for halloysites, palygorskites and sepiolites.
Distribution curves of the trace elements of the clays from the stratigraphic series studied.

Chemical analysis of the trace elements (ppm) from the levels studied.

a Decrée et al. (Reference Decrée, Marignac, Liégeois, Yans, Ben Abdallah and Demaiffe2014).
b Garnit et al. (Reference Garnit, Bouhlel and Javis2017).
Some samples are relatively rich in trace elements (Fig. 3 & Table 3), in most cases due to their proximity to zones where lead mineralization mainly occurs. The maximum trace element contents were detected in the illitic Triassic clays of J. Ammar (TAM2), followed by the illitic Jurassic clays of J. Ressas (RC4; Fig. 3 & Table 3), generally because of their proximity to the mineralization zones. Relatively high abundances of trace elements were also observed in the Kef Eddour phosphates (KCEI) and in the samples of rhyodacite from Oued Bélif (AOr4).
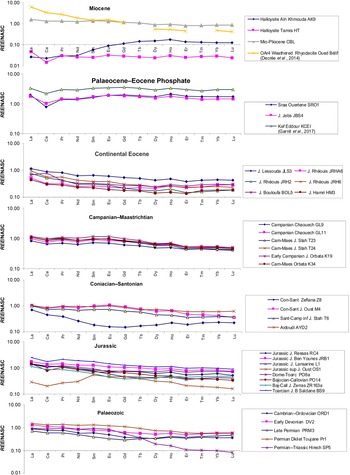
Clay minerals are among the main sediment fractions involved in REE transport. The latter are reliable tracers that help with determining the origins of rocks because of their limited surface mobility (Wronckiewiez & Condie, Reference Wronckiewiez and Condie1990). The normalization curves of the REEs with respect to NASC (Fig. 4 & Table 4) show a more regular distribution compared to those of the detrital clays from the continental environments. The REE diagrams are comparable across the studied clay levels, indicating the inherited origin of these clays, except for the palygorskite clays, which were partly neoformed (Jamoussi, Reference Jamoussi2001; Jamoussi et al., Reference Jamoussi, Bédir, Boukadi, Kharbachi, Zargouni, López-Galindo and Paquet2003). The flat patterns of the REE/NASC curves confirm the detrital origin of the clay levels examined (Wray, Reference Wray1995). The spectra also tend to become depleted of heavy REEs (Fig. 4).
Normalized REE patterns of clays in the studied stratigraphic series.

Chemical analysis of REEs (ppm) from the levels studied.

a Decrée et al. (Reference Decrée, Marignac, Liégeois, Yans, Ben Abdallah and Demaiffe2014).
b Garnit et al. (Reference Garnit, Bouhlel and Javis2017).
The negative Ce anomaly (characteristic of seawater), which affects the minerals formed in a marine environment (Piper, Reference Piper1974; Courtois & Hoffert, Reference Courtois and Hoffert1977; De Baar et al., Reference De Baar, German, Elderfield and Gaans1988; Murray et al., Reference Murray, Buchholtz ten Bink, Jones, Gerlach and Russ1990), is very weak or absent, even in levels where the clay fraction is very rich in smectite, except for the phosphate-rich levels, confirming their marine origin.
One can observe a slight fractionation with impoverishment of heavy REEs compared to light REEs. This fractionation could result from the complexation of REEs with organic matter. This mechanism favours the maintenance of the heaviest elements in solution, which are thus depleted in the solid phase (Courtois & Chamley, Reference Courtois and Chamley1978; Nesbitt, Reference Nesbitt1979).
The mobility and fractionation of REEs at the rock–fluid interface are very low (MacLennan et al., 1980; Taylor & MacLennan, Reference Taylor and MacLennan1985; MacLennan, 1989). As a result, these elements move from the weathering profiles to the sedimentation basins without being involved in chemical processes during transport (Fleet, Reference Fleet and Henderson1984). The behaviour of REEs during continental alterations is therefore governed by the parent-rock composition. Consequently, it may be concluded that the detrital clays transported to the sedimentation basins retain their detrital imprints (Bonnot-Courtois, Reference Bonnot-Courtois1981; Fleet, Reference Fleet and Henderson1984; Setti et al., Reference Setti, Marinoni and López-Galindo2004). The distribution of REEs is thus related directly to that of the parent rock (Cullers et al., Reference Cullers, Chandhuri, Arnold, Lee and Wolf1975). These elements are adsorbed by the existing minerals, which leads to great REE levels in detrital minerals. The very low concentrations of REEs in sedimentation ponds lead to low levels of REEs in the neoformed minerals from these solutions. Once adsorbed on the clays, REEs form complexes that are linked strongly to the clayey network (Leleyter et al., Reference Leleyter, Probst, Depetris, Haida and Mortatti1999).
The REEs located in an interlayer position or in exchangeable sites are among the chemical elements that are related most closely to detrital phyllosilicates. Their adsorption onto the clays occurs easily, while their desorption is relatively difficult. The high charge of these elements should stabilize them in the exchangeable sites of clay minerals (Bonnot-Courtois, Reference Bonnot-Courtois1981; Bonnot-Courtois & Jaffrezic-Renault, Reference Bonnot-Courtois and Jaffrezic-Renault1982). REEs are therefore relatively immobile and their concentrations are great in detrital phyllosilicates and low in natural solutions. The few previous works carried out in Tunisia on REEs concerned mainly the phosphatic series (Ounis et al., Reference Ounis, Kocsis, Chaabani and Pfeifer2008; Garnit et al., Reference Garnit, Bouhlel, Barca and Chtara2012, Reference Garnit, Bouhlel and Javis2017; Bouabdallah et al., Reference Bouabdallah, Elgharbi, Horchani-Naifer, Barca, Fattah and Férid2019) and the Oued Bélif belt breccia (Decrée et al., Reference Decrée, Marignac, De Putter, Yans, Clauer and Dermech2013, Reference Decrée, Marignac, Liégeois, Yans, Ben Abdallah and Demaiffe2014). Hence, it is important to conduct further studies in an attempt to separate these REEs from the gangue for possible exploitation.
Tlig & Steinberg (Reference Tlig and Steinberg1980) showed that the REE spectra of the Late Jurassic and lower Cretaceous clays of southern Tunisia are comparable to those of the Callovian clays and show a slight depletion of heavy REEs. These authors concluded that these REEs have an inherited origin. The relatively great REE concentrations in the phosphate pellets of the Gafsa phosphate basin correlate with the porosity and specific surface area of the cryptocrystalline apatite and the palaeo-depositional environment (Ounis et al., Reference Ounis, Kocsis, Chaabani and Pfeifer2008; Galfati et al., Reference Galfati, Sassi Beji, Zaier, Bouchardon, Bilal, Joron and Sassi2010; Garnit et al., Reference Garnit, Bouhlel, Barca and Chtara2012, Reference Garnit, Bouhlel and Javis2017). Finally, the Oued Bélif breccia in the north-west of Tunisia is enriched in REEs (Decrée et al., Reference Decrée, Marignac, De Putter, Yans, Clauer and Dermech2013, Reference Decrée, Marignac, Liégeois, Yans, Ben Abdallah and Demaiffe2014).
Distribution of REEs according to clay mineralogy
The data present above suggest that the distribution of REEs in the Tunisian sediments has changed slightly over time. The abundances of REEs vary considerably depending on the nature of the clay minerals, especially at the lowest REE-rich levels (Tables 2 & 4). In accordance with Torres-Ruiz et al. (Reference Torres-Ruiz, Lopez-Galindo, Gonzales-Lopez and Delgado1994), the present study showed that the REE contents in the clay minerals obtained by calculating regressions between REEs and the mineralogical components of mono-mineral samples are dominant in illite, followed by mixed-layer illite-smectite, palygorskite, Mg-smectite, sepiolite and carbonates. The Palaeozoic, Triassic and Jurassic horizons rich in illite are most enriched in REEs. Moreover, the horizons with palygorskite in the continental Eocene are poorer in REEs, while the halloysite-rich horizons have the lowest REE contents (Fig. 4 & Table 4).
The REE distribution curves are very comparable and there are no significant changes in REE associations (Fig. 4). Moreover, the sample from the Permo-Triassic of Hirech in the Northern Atlas exhibits considerable depletion of heavy REEs probably due to slight metamorphism. Similarly, the horizons rich in halloysites display a slight depletion of REEs, demonstrating the lower affinity of halloysites for REEs compared to other clay minerals.
Three phosphate samples richer in REEs compared to the remaining studied samples were extracted from the phosphate mines of Kef Eddour, Jebel (J.) Jebes and Sraa Ourten (Garnit et al., Reference Garnit, Bouhlel and Javis2017). The REE concentrations at Sraa Ourten and J. Jebes are lower than those in Kef Eddour because of the lower level of P2O5, which is responsible for REE retention. This result was confirmed by Garnit et al. (Reference Garnit, Bouhlel and Javis2017), who suggested that Fe-Mn oxyhydroxides play an important role in hosting REEs in the Metlaoui Basin (Kef Eddour). Moreover, phosphate samples exhibit a negative anomaly in Ce, confirming the marine origin of these deposits (Fig. 4). In addition, the abundance of REEs the Oued Bélif belt breccia (Decrée et al., Reference Decrée, Marignac, Liégeois, Yans, Ben Abdallah and Demaiffe2014) and in its rhyodacite alteration products (Badurina & Šegvić, Reference Badurina and Šegvić2022) was also observed in the current study.
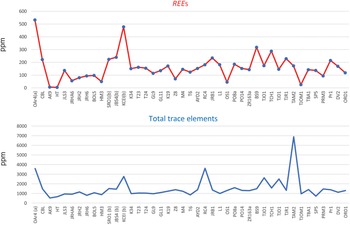
All samples are rich in light REEs (LREEs), except for Ain Khmouda's halloysite, which has a large heavy REE (HREE) content, suggesting a greater affinity of halloysite to HREEs than other minerals. In addition, it is clear that trace elements (Fig. 5) in Jebel Ammar (TAM2) and Jebel Ressas (RC4) have great REE concentrations due to their proximity to mineralization zones. The greatest concentration of trace elements (7000 ppm) was detected at Jebel Ammar (TAM2; Fig. 5). The greatest REE content of the phosphate sample (KCEI) coincides with a relatively large trace element content. This observation should be considered in future studies or exploitations of these REEs. Finally, the large REE concentration in the altered rhyodacite horizons of Oued Bélif is accompanied by an increase in the abundance of trace elements (Fig. 5).
Comparison of the REEs and trace elements of the clays from the stratigraphic series studied. The suffix (a) refers to data from Decrée et al. (Reference Decrée, Marignac, Liégeois, Yans, Ben Abdallah and Demaiffe2014); the suffix (b) refers to data from Garnit et al. (Reference Garnit, Bouhlel and Javis2017).

Influence of tectonic and climate eustatism on REEs
The Tunisian margin can be subdivided into six palaeogeographical and geological domains from the ‘Saharan Platform’ in the south to the ‘Nappes Zone’ in the north (Fig. 1). These tectono-palaeogeographical domains were established after seven successive geodynamic events that can be summarized as follows (Fig. 2):
(1) Caledonian and Hercynian orogenesis in the Devonian–Silurian and Permian (Bédir et al., Reference Bédir, Boukadi, Tlig, Ben Timzal, Zitouni and Alouani2001);
(2) Tethyan rifting in the Jurassic, Triassic and lower Cretaceous (Bédir et al., Reference Bédir, Boukadi, Tlig, Ben Timzal, Zitouni and Alouani2001);
(3) Alpine orogenesis of the Austrian phase;
(4) Early Pyrenean orogenesis in the uppermost Cretaceous;
(5) Late Pyrenean orogenesis in the Palaeocene–Eocene;
(6) Rifting from the Middle Miocene to the Langhian;
(7) Alpine and Atlasic orogenesis of the upper Miocene and Quaternary.
It has been proposed that the decline in sea levels and intensification of erosion from the Palaeozoic to the lower Cretaceous is responsible for the large inflow of illite and kaolinite in the area (Jamoussi, Reference Jamoussi2001; Jamoussi et al., Reference Jamoussi, Bédir, Boukadi, Kharbachi, Zargouni, López-Galindo and Paquet2003). The mineralogical variations of the Palaeozoic are probably caused by the various orogeneses, because the climate can affect the clay sedimentation only during periods of tectonic stability. The presence of chlorite in Palaeozoic and Triassic sediments is due to diagenetic influences (Deconinck et al., Reference Deconinck, Beaudoin, Chamley, Joseph and Raoult1985). In addition, the high humidity during the Carboniferous may be the source of the kaolinite abundance, whereas the warm climate during the Late Cretaceous and Palaeogene favoured the formation of the Al-Fe-beidellites that characterize periods of high sea levels (Chamley et al., Reference Chamley, Deconinck and Millot1990). The correspondence between the increase in smectite abundance and the maximum flood period is consistent with the decrease in the intensity of erosion resulting from higher sea levels (Fig. 3). The lowering of the sea level during the upper Eocene–Oligocene and Pliocene promoted the formation of closed basins, which induced the formation of palygorskite at high pH and with an intake of Mg (Jamoussi et al., Reference Jamoussi, Bédir, Boukadi, Kharbachi, Zargouni, López-Galindo and Paquet2003).
Thus, it can be concluded that the Palaeozoic clays were produced by the alteration of the crystalline basement rocks (Jamoussi, Reference Jamoussi2001). However, the deposits of the Triassic and Jurassic were formed by clastic clays and neoformed palygorskite. The upper Cretaceous smectites are the result of underwater alteration of volcanic material, a pedogenic process and tectonic stability. Furthermore, continental Eocene deposits combine the neoformation and transformation of older materials. However, the Miocene halloysite deposits were neoformed (Jamoussi et al., Reference Jamoussi, Bédir, Boukadi, Kharbachi, Zargouni, López-Galindo and Paquet2003).
These results show that the mineralogical compositions of sediments and, therefore, REEs are influenced by sea-level variations, phases of tectonic activity and palaeoclimate. It is also clear that the increases in the eustatic level were accompanied by increased abundances of smectite, while the abundance of the palygorskite coincides with the lowering of the sea level (which would be linked in Tunisia to the Austrian, Pyrenean, Alpine and Atlasic compressive events) and to the evaporative conditions in the area studied (Jamoussi et al., Reference Jamoussi, Bédir, Boukadi, Kharbachi, Zargouni, López-Galindo and Paquet2003).
Conclusion
This is the first study to examine the relationship between REEs and clay minerals of the stratigraphic series of the Palaeozoic to the Neogene in Tunisia. It provided the following results:
• The REE distribution shows limited variability from the Palaeozoic to the Neogene, except during the Triassic, Jurassic and Miocene. The REEs did not evolve over time and did not establish equilibrium with the marine environment, which makes them valuable markers of the origins of clay minerals that have not undergone diagenetic modifications.
• The normalized REE patterns are most often characteristic of detrital clays such as illite, kaolinite and smectite, which shows that the smectites of the Tunisian margin are mainly continental and probably largely pedogenic.
• Only some fibrous clays have an authigenic origin.
• Illites display the greatest REE contents, followed by smectites and palygorskites. The smallest values were recorded in the halloysites.
• Similar to clay minerals, REEs are influenced by variations in sea level, phases of tectonic activity and palaeoclimate.
• The phosphate horizons are richer in REEs and trace elements compared to the other studied horizons.
• The Oued Bélif belt breccia is rich in REEs.
• It is still difficult to evaluate the relative importance of tectonic destabilization, eustatic movements and climatic influence when interpreting the composition and distribution of the REEs of the sedimentary column due to the interactions between these three parameters.
• Trace elements are enriched close to mineralization zones.
The industrial exploitation of REEs is not possible currently. More work in areas rich in REEs will enable the separation of REEs from the bulk rock.
Acknowledgements
The authors are grateful to the anonymous referees for their valuable comments and constructive remarks that allowed them to improve the manuscript both scientifically and linguistically, and their native English-speaking colleague for the efforts he made to revise the paper and present an enhanced version of the work.