





High BMI is one of the most significant global public health challenges today, with a widespread and profound disease burden(Reference Dai, Alsalhe and Chalghaf1). Concurrently, high BMI profoundly disrupts the metabolic balance of blood lipids and blood pressure, serving as a core contributor to hypertension and dyslipidaemia(Reference Engin2).
High BMI is clearly associated with an increased risk of several cancers(Reference Zhou, Liu and Hung3). For women, cancers related to high BMI primarily include endometrial cancer, postmenopausal breast cancer and ovarian cancer(Reference Engin4); for men, they include prostate cancer and thyroid cancer(Reference Morgans, Chen and Jarrard5). Furthermore, the incidence of colorectal cancer rises significantly in individuals with high BMI, regardless of gender(Reference Recalde, Davila-Batista and Díaz6). Excess weight exacerbates the load on and wear of joints, leading to a substantial increase in the incidence of musculoskeletal disorders such as osteoarthritis(Reference Lu, Xiao and Tao7).
Given the multitude of diseases that high BMI can cause, targeted prevention and control are crucial(Reference Nicholson and Silverstein8). However, the disease burden attributable to high BMI is not uniform across different regions(Reference Ding, Deng and Qi9). Asians, for instance, may have a lower obesity rate at a younger age, but diabetes complications can persist for a longer duration, and mortality might occur earlier compared to other regions(Reference Yoon, Lee and Kim10). In European countries, adult obesity is widespread and associated with socio-economic levels(Reference Diamantis, Karatzi and Kantaras11). Obese Africans are more than twice as likely to develop hypertension as the general African population, and this risk increases with age(Reference Akpa, Made and Ojo12).
Although existing studies have described the global burden of high BMI and its associations with various diseases, there is a lack of research that specifically and systematically compares the epidemiological characteristics, long-term trends and future projections of the disease burden attributable to high BMI across the three major continents of Asia, Europe and Africa within a unified framework. Current discussions on regional differences – such as diabetes susceptibility in Asian populations, ageing and disease profiles in Europe and health system challenges in Africa – are largely based on observational descriptions or single-disease studies, lacking systematic validation through quantitative comparisons and attribution analyses based on comprehensive burden of disease data. This study aims to comprehensively assess and compare the disease burden attributable to high BMI and its epidemiological trends in Asia, Europe and Africa from 1990 to 2023, using the latest Global Burden of Disease (GBD) 2023 data, and to project its future burden.
Methods
Data sources
The most recent data on high BMI-related disease burden across various countries and regions in Asia, Europe and Africa were sourced from the latest GBD 2023 database for secondary analysis. All three principal authors of this study are members of the GBD Collaborators Network. The GBD 2023 study represents a comprehensive epidemiological assessment, enabling the estimation of key metrics such as incidence and prevalence(13).
Based on the ‘risk factor’ category in the GBD 2023 database, we extracted disease burden of high BMI for twenty age groups: ‘<5’, ‘5 to 9’, ‘10 to 14’, ‘15 to 19’, 20–24’, ‘25 to 29’, ‘30 to 34’, ‘35 to 39’, 40–44’, ‘45 to 49’, ‘50 to 54’, ‘55 to 59’, 60–64’, ‘65 to 69’, ‘70 to 74’, ‘75 to 79’, 80–84’, ‘85 to 89’, ‘90 to 94’ and ‘95 plus’.
The study extracted the following burden-of-disease indicators: Deaths, Disability-Adjusted Life Years (DALY), Years Lived with Disability (YLD) and Years of Life Lost (YLL). These parameters were gathered from the ‘cause of death or injury’ component, while the ‘risk factor’ component provided all except Incidence and Prevalence.
Measurement of exposure variable
The exposure variable was high BMI, as defined by the GBD 2023 study. In the GBD framework, high BMI is a continuous risk factor. The theoretical minimum risk exposure level for BMI is set at 20–25 kg/m2. Exposure levels (prevalence of BMI ≥ 25 kg/m2) for each country, age, sex and year were derived from a comprehensive analysis of population-based survey data, including measured and self-reported height and weight, using spatiotemporal Gaussian process regression and Bayesian meta-regression to ensure comparability and address missing data.
Measurement of outcome variables
The outcome variables were the disease burden metrics attributable to high BMI, including:
Deaths: Number of fatalities where high BMI was a contributing risk factor.
Disability-Adjusted Life Years: Sum of YLL due to premature death and YLD. YLL were calculated as the number of deaths multiplied by the standard life expectancy at the age of death. YLD were computed as the prevalence of each sequela multiplied by its disability weight.
Location selection
The GBD database does not report aggregate estimates for broad regions such as ‘Asia’, ‘Europe’ or ‘Africa’; consequently, the burden estimates related to high BMI for these three continents must be compiled by aggregating data from individual countries and territories.
The Asian countries and regions extracted are Afghanistan, Bahrain, Bangladesh, Bhutan, Brunei Darussalam, Cambodia, China, Democratic People’s Republic of Korea, India, Indonesia, Iran (Islamic Republic of), Iraq, Japan, Jordan, Kuwait, Kyrgyzstan, Lao People’s Democratic Republic, Lebanon, Malaysia, Maldives, Mongolia, Myanmar, Nepal, Oman, Pakistan, Palestine, Philippines, Qatar, Republic of Korea, Saudi Arabia, Singapore, Sri Lanka, Syrian Arab Republic, Tajikistan, Thailand, Timor-Leste, Turkmenistan, United Arab Emirates, Uzbekistan, Viet Nam, Yemen, Taiwan (Province of China) and Kazakhstan.
The European countries and regions extracted are Albania, Andorra, Armenia, Austria, Azerbaijan, Belarus, Belgium, Bosnia and Herzegovina, Bulgaria, Croatia, Cyprus, Czechia, Denmark, Estonia, Finland, France, Georgia, Germany, Greece, Hungary, Iceland, Ireland, Israel, Italy, Latvia, Lithuania, Luxembourg, Malta, Monaco, Montenegro, Netherlands, North Macedonia, Norway, Poland, Portugal, Republic of Moldova, Romania, Russian Federation, San Marino, Serbia, Slovakia, Slovenia, Spain, Sweden, Switzerland, Turkey, Ukraine and the United Kingdom.
The African countries and regions extracted are Algeria, Angola, Benin, Botswana, Burkina Faso, Burundi, Cabo Verde, Cameroon, Central African Republic, Chad, Comoros, Congo, Democratic Republic of the Congo, Côte d’Ivoire, Djibouti, Egypt, Equatorial Guinea, Eritrea, Eswatini, Ethiopia, Gabon, Gambia, Ghana, Guinea, Guinea-Bissau, Kenya, Lesotho, Liberia, Libya, Madagascar, Malawi, Mali, Mauritania, Mauritius, Morocco, Mozambique, Namibia, Niger, Nigeria, Rwanda, Sao Tome and Principe, Senegal, Seychelles, Sierra Leone, Somalia, South Africa, South Sudan, Sudan, Togo, Tunisia, Uganda, United Republic of Tanzania, Zambia and Zimbabwe.
Age-standardised rate
Data on high BMI-related deaths, DALY, YLD and YLL for countries and territories across Asia and Europe were extracted from the GBD 2023 database. Following the extraction of high BMI-related disease burden indicators for countries and territories across Asia, Europe and Africa from the GBD 2023 database, the age-standardised rates of these indicators were calculated. Each estimate is reported alongside its 95 % uncertainty interval (UI).
To estimate the disease burden, we utilised age-standardised rates per 100 000 population. These rates were calculated to facilitate valid comparisons across different regions and time periods by adjusting for variations in population age structures. Absolute case counts were also reported to reflect the tangible public health burden and to inform resource allocation decisions.
To facilitate comparable assessment of disease burden across varying time periods and geographical locations, age-standardisation was performed via the ageadjust.direct function within the R epitools package. This approach, which utilises population data from the GBD database, synthesises three primary inputs: observed case counts, age-stratified population sizes and the age distribution of a standard population. The resulting age-standardised estimates offer a refined depiction of epidemiological distribution patterns by minimising confounding effects of population age structure.
The computed age-standardised metrics include the age-standardised incidence rate (ASIR), age-standardised prevalence rate (ASPR), age-standardised death rate (ASDR), age-standardised DALY rate, age-standardised YLD rate and age-standardised YLL rate.
Estimated annual percent change
The estimated annual percentage change (EAPC) describes the average annual rate of change for epidemiological metrics, including age-standardised rates(Reference Zheng, Yu and Lin14). Consequently, a positive EAPC indicates an upward trend, while a negative value signifies a downward trend; the absolute value reflects the speed of the trend. Owing to its utility in analysing temporal patterns, EAPC is a standard metric in burden of disease studies, particularly those utilising GBD data(Reference Cen, Wang and Cheng15). We employed EAPC to quantify the long-term trends from 1990 to 2023 for indicators such as Incidence, Prevalence, Deaths, DALY, YLD and YLL across Asia, Europe and Africa.
Joinpoint regression
Joinpoint regression was employed to analyse the temporal trends of age-standardised disease burden indicators across Asia, Europe and Africa. This method fits segmented linear models to identify joinpoints – specific years where the direction or rate of the trend exhibits a statistically significant change. The annual percent change (APC) was calculated for each segment, and the overall net trend over the entire period was summarised as the average annual percent change (AAPC) along with its 95 % CI(Reference Kim, Fay and Feuer16). To prevent overfitting, a user-defined maximum number of joinpoints was set. This methodology has been extensively used in previous studies related to the GBD(Reference Feng, Wang and Su17).
Risk factors
To further investigate the diseases caused by high BMI, we quantified the proportion of disease burden attributable to multiple high BMI-related diseases. The diseases contributing to the high BMI-related ASDR include respiratory infections and tuberculosis, diabetes and kidney diseases, neoplasms, CVD, digestive diseases, chronic respiratory diseases and neurological disorders. The diseases contributing to the high BMI-related age-standardised DALY rate, age-standardised YLL rate and age-standardised YLD rate include respiratory infections and tuberculosis, diabetes and kidney diseases, neoplasms, CVD, digestive diseases, chronic respiratory diseases, neurological disorders, sense organ diseases and musculoskeletal disorders.
Autoregressive Integrated Moving Average
To project the high BMI-related disease burden in Asia, Europe and Africa from 2024 to 2040, forecasts were conducted using the Autoregressive Integrated Moving Average (ARIMA) model. This well-established methodological approach integrates the Autoregressive (AR), Integrated (I) and Moving Average (MA) components to capture key characteristics in time series data, including trend, seasonality and random fluctuations. In this study, we utilised the auto.arima() function from the R forecast package for automated model selection. This algorithm systematically searches across possible combinations of autoregressive (p), differencing (d) and moving average (q) orders, selecting the optimal model based on the corrected Akaike information criterion. For model diagnostics, we relied on the built-in diagnostic procedures embedded within the auto.arima() framework, which includes assessments of residual autocorrelation and model stability. Additionally, the forecasting procedure automatically generates 95 % CI via the forecast() function, reflecting the uncertainty inherent in the projections. The auto.arima() function internally performs model validation through information criterion-based selection and ensures that the fitted model meets stationarity and invertibility conditions.
The data analysis and graphical presentation in this study were performed with R software (version 4.2.3) and the Joinpoint Regression Program.
Results
Disease burden in 2023
In 2023, Asia recorded 2 877 582 deaths attributable to high BMI (95 % UI: 1 465 996–4 507 685), an ASDR of 30·83 (14·87–49·89) per 100 000, 120 182 714 DALY (56 308 955–186 506 210), an age-standardised DALY rate of 1253·75 (573·14–1984·15) per 100 000, 74 212 199 YLL (38 514 065–113 990 110), an age-standardised YLL rate of 776·88 (384·97–1225·99) per 100 000, 45 970 515 YLD (16 579 992–78 233 023) and an age-standardised YLD rate of 476·88 (169·82–821·51) per 100 000. In 2023, Europe recorded 1 675 848 deaths attributable to high BMI (791 226–2 558 882), an ASDR of 52·52 (24·64–80·78) per 100 000, 49 401 025 DALY (20 994 181–77 166 219), an age-standardised DALY rate of 1824·14 (773·31–2872·71) per 100 000, 30 336 554 YLL (14 586 793–45 627 262), an age-standardised YLL rate of 1064·15 (511·63–1607·2) per 100 000, 19 064 471 YLD (6 295 879–32 208 651) and an age-standardised YLD rate of 760 (253·04–1305·58) per 100 000. In 2023, Africa recorded 1 092 682 deaths attributable to high BMI (621 669–1 602 027), an ASDR of 88·74 (48·06–134·85) per 100 000, 40 278 756 DALY (21 676 314–59 084 575), an age-standardised DALY rate of 2746·12 (1445·93–4106·26) per 100 000, 29 579 169 YLL (17 038 193–42 992 707), an age-standardised YLL rate of 2086·94 (1151·37–3131·4) per 100 000, 10 699 587 YLD (4 204 190–17 514 338) and an age-standardised YLD rate of 659·18 (247·05–1103·66) per 100 000. Figure 1 presents the ASDR and age-standardised DALY rate attributable to high BMI by age and sex in Asia, Europe and Africa. Figure S1 in the supplementary materials presents the age-standardised YLL rate and age-standardised YLD rate attributable to high BMI by age and sex in Asia, Europe and Africa.
Age- and sex-specific burden of disease indicators attributable to high BMI in Asia, Europe and Africa. (A) ASDR due to high BMI in Asia, by age group and gender. (B) ASDR due to high BMI in Europe, by age group and gender. (C) ASDR due to high BMI in Africa, by age group and gender. (D) Age-standardised DALY rate due to high BMI in Asia, by age group and gender. (E) Age-standardised DALY rate due to high BMI in Europe, by age group and gender. (F) Age-standardised DALY rate due to high BMI in Africa, by age group and gender. ASDR, age-standardised death rate; DALY, Disability-Adjusted Life Years.

Estimated annual percentage change analysis
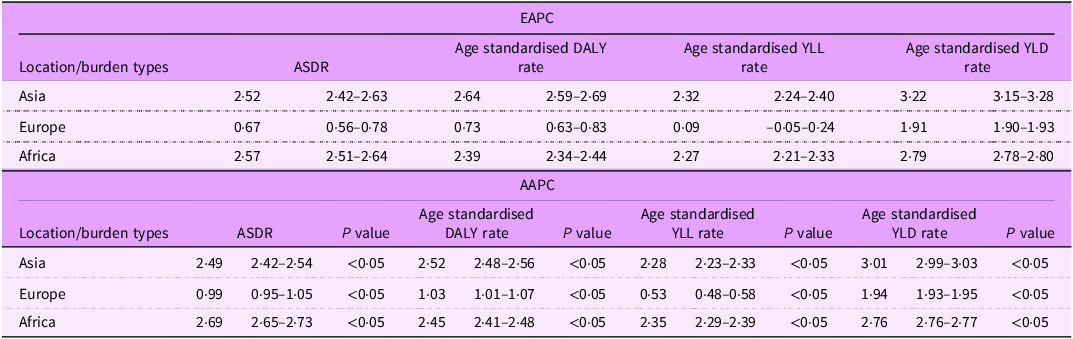
From 1990 to 2023, the EAPC in age-standardised rates of high-BMI-related disease burden indicators showed an upward trend in Asia, Europe and Africa. Detailed EAPC results are presented in Table 1.
EAPC and AAPC of high BMI in Asia, Africa and Europe, 1990–2023

Table 1. Long description
A table comparing age-standardized rates of high BMI-related disease burden indicators across Asia, Europe, and Africa. The table is divided into two sections: EAPC and AAPC. EAPC section includes columns for ASDR, Age standardised DALY rate, Age standardised YLL rate, and Age standardised YLD rate. Row 1: Asia, ASDR 2.52, Age standardised DALY rate 2.42-2.63, Age standardised YLL rate 2.59-2.69, Age standardised YLD rate 2.24-2.40. Row 2: Europe, ASDR 0.67, Age standardised DALY rate 0.56-0.78, Age standardised YLL rate 0.63-0.83, Age standardised YLD rate -0.05-0.24. Row 3: Africa, ASDR 2.57, Age standardised DALY rate 2.51-2.64, Age standardised YLL rate 2.34-2.44, Age standardised YLD rate 2.21-2.33. AAPC section includes columns for ASDR, P value, Age standardised DALY rate, P value, Age standardised YLL rate, P value, Age standardised YLD rate, P value. Row 1: Asia, ASDR 2.49, P value <0.05, Age standardised DALY rate 2.52, P value <0.05, Age standardised YLL rate 2.28, P value <0.05, Age standardised YLD rate 3.01, P value <0.05. Row 2: Europe, ASDR 0.99, P value <0.05, Age standardised DALY rate 1.03, P value <0.05, Age standardised YLL rate 0.53, P value <0.05, Age standardised YLD rate 1.94, P value <0.05. Row 3: Africa, ASDR 2.69, P value <0.05, Age standardised DALY rate 2.45, P value <0.05, Age standardised YLL rate 2.35, P value <0.05, Age standardised YLD rate 2.76, P value <0.05.
EAPC, estimated annual percentage change; AAPC, average annual percent change; ASDR, age-standardised death rate; DALY, Disability-Adjusted Life Years; YLL, Years of Life Lost; YLD, Years Lived with Disability.
Joinpoint regression analysis
From 1990 to 2023, the age-standardised rates of disease burden indicators attributable to high BMI in Asia, Europe and Africa all showed an increasing trend, as measured by the AAPC. Detailed AAPC analysis results are presented in Table 1. Figure 2 displays the results of the Joinpoint regression analysis for the ASDR and the age-standardised DALY rate attributable to high BMI in Asia, Europe and Africa. Similarly, Figure S2 presents the Joinpoint regression analysis results for the ASDR and the age-standardised DALY rate related to high BMI across Asia, Europe and Africa.
Joinpoint regression analysis of high BMI-related ASDR in Asia, Europe and Africa. (A) Joinpoint regression analysis of high BMI-related ASDR in Asia. (B) Joinpoint regression analysis of high BMI-related ASDR in Europe. (C) Joinpoint regression analysis of high BMI-related ASDR in Africa. (D) Joinpoint regression analysis of high BMI-related age-standardised DALY rate in Asia. (E) Joinpoint regression analysis of high BMI-related age-standardised DALY rate in Europe. (F) Joinpoint regression analysis of high BMI-related age-standardised DALY rate in Africa. ASDR, age-standardised death rate; DALY, Disability-Adjusted Life Years.

Risk factors
In Asia, Europe and Africa, high BMI primarily causes death through CVD and diabetes and kidney diseases. However, Europe has a higher proportion of deaths attributable to high BMI from neurological disorders, neoplasms and digestive diseases than the other two continents. In Asia, diabetes and kidney diseases account for the largest share of high-BMI-related DALY. In Europe, CVD are the dominant contributor to high-BMI-related DALY. In Africa, high-BMI-related DALY are driven almost equally by CVD and diabetes and kidney diseases. Figure 3 shows the proportion of deaths and DALY attributable to high BMI by cause in Asia, Europe and Africa. Figure S3 in the supplementary material presents the corresponding proportions of YLD and YLL.
The proportion of deaths and DALY attributable to high BMI by cause in Asia, Europe and Africa. (A) The proportion of deaths attributable to high BMI by cause in Asia. (B) The proportion of deaths attributable to high BMI by cause in Europe. (C) The proportion of deaths attributable to high BMI by cause in Africa. (D) The proportion of DALY attributable to high BMI by cause in Asia. (E) The proportion of DALY attributable to high BMI by cause in Europe. (F) The proportion of DALY attributable to high BMI by cause in Africa. DALY, Disability-Adjusted Life Years.

Prediction of disease burden
Based on the ARIMA model, the projected high BMI-related ASDR in Asia by 2040 is 43·46 (35·86–51·05), with a projected number of Deaths at 4 632 592 (3 741 049–5 524 135). In Europe, the projected high BMI-related ASDR is 59·94 (54·12–65·76), with Deaths projected at 1 944 391 (1 763 163–2 125 620). In Africa, the projected high BMI-related ASDR is 130·70 (102·80–158·60), with Deaths projected at 1 918 415 (1 458 295–2 378 535). By 2040, the projected high BMI-related age-standardised DALY rate in Asia is 1701·62 (1482·63–1920·60), with the number of DALY projected at 185 161 489 (155 591 214–214 731 764). In Europe, the projected age-standardised DALY rate is 2127·79 (1866·53–2389·06). In Africa, the projected age-standardised DALY rate is 4420·21 (3387·35–5453·07), with the number of DALY projected at 75 513 189 (47 639 236–103 387 143). The projected high BMI-related age-standardised YLL rate in Asia by 2040 is 1052·03 (877·35–1226·71), with the number of YLL projected at 113 963 050 (92 533 311–135 392 788). In Europe, the projected age-standardised YLL rate is 1016·73 (912·92–1120·54), with YLL projected at 30 661 724 (23 670 783–37 652 664). In Africa, the projected age-standardised YLL rate is 2871·83 (2311·31–3432·35), with YLL projected at 56 138 512 (28 768 119–83 508 905). For the age-standardised YLD rate in Asia by 2040, the projection is 650·51 (523·88–777·15), with the number of YLD projected at 70 084 328 (58 614 091–81 554 566). In Europe, the projected age-standardised YLD rate is 1204·72 (1032·62–1376·83), with YLD projected at 26 932 263 (24 092 198–29 772 328). In Africa, the projected age-standardised YLD rate is 974·33 (914·78–1033·89), with YLD projected at 20 044 395 (17 368 306–22 720 485). Figure 4 displays the projected high BMI-related ASDR and age-standardised DALY rate in Asia, Europe and Africa for 2040, based on the ARIMA model. Figure S4 in the supplementary materials displays the projected high BMI-related age-standardised YLL rate and age-standardised YLD rate in Asia, Europe and Africa for 2040, based on the ARIMA model.
The projected high BMI-related ASDR and age-standardised DALY rate in Asia, Europe and Africa for 2040, based on the ARIMA model. (A) The projected high BMI-related ASDR in Asia. (B) The projected high BMI-related ASDR in Europe. (C) The projected high BMI-related ASDR in Africa. (D) The projected high BMI-related age-standardised DALY rate in Asia. (E) The projected high BMI-related age-standardised DALY rate in Europe. (F) The projected high BMI-related age-standardised DALY rate in Africa. ASDR, age-standardised death rate; DALY, Disability-Adjusted Life Years; ARIMA, Autoregressive Integrated Moving Average.

Discussion
High BMI represents a major global public health threat. For the first time, our study provides a comparative assessment of the high-BMI-related disease burden across Asia, Europe and Africa. Asia records the largest absolute numbers of deaths and DALY, largely reflecting its vast population. After age standardisation, however, Asia displays the lowest high-BMI-related burden rates. Africa shows the highest ASDR, age-standardised DALY rate and age-standardised YLL rate, whereas Europe exhibits the highest age-standardised YLD rate. These findings indicate that individuals in Africa face the greatest personal risk attributable to high BMI, posing a formidable public health challenge. Limited healthcare resources in Africa mean that CVD, diabetes and other BMI-related conditions often progress to fatal outcomes(Reference Bradshaw, Joubert and Abdelatief18). In contrast, well-resourced health systems in Europe can provide long-term disease management, extending survival but sometimes at the cost of prolonged disability – hence the relatively higher YLD rate(Reference Khunti, Capehorn and Artime19).
An analysis of the disease burden attributable to high BMI shows that, in Europe and Asia, sex-specific BMI-related burdens are relatively similar. In Africa, however, the BMI-related burden is markedly higher in women than in men. Each continent thus exhibits distinct epidemiological patterns. In both Europe and Asia, the ASDR due to high BMI rises steadily with age; the older the age group, the higher the ASDR. In Africa, by contrast, the ASDR peaks earlier. Similarly, while high-BMI-related DALY in Europe increase with age, the DALY peaks in Asia and Africa also shift forward – Africa’s peak occurs as early as the age of 65 years. As a chronic metabolic risk factor, high BMI has a long latency period, and its most severe health consequences cluster in mid-to-late life(Reference Liu, Wang and Zhang20). This underscores the critical importance of preventive interventions during young and middle adulthood(Reference Wang, Yang and Chen21). The earlier peak of BMI-related burden in Africa signals an urgent need to strengthen primary healthcare systems so that common chronic conditions such as hypertension and diabetes are detected and managed early, averting avoidable deaths(Reference Nambiema, Agboyibor and Dangou22).
An analysis of the 34-year epidemiological trends of high-BMI-related burden across the three continents shows that, from 1990 to 2023, all EAPC and AAPC values for every high-BMI-related indicator were positive in Asia, Europe and Africa. This confirms that – after removing the effect of changing population age structure – the health risk attributable to high BMI has continuously worsened on all three continents. Asia and Africa exhibited extremely high growth rates, with most AAPC ranging from 2·3 % to 3·0 %; such rates double the burden every 25–30 years, underscoring an alarming scenario. Europe’s growth rates were significantly lower than those of Asia and Africa, yet the trend remained upwards, indicating that the high-BMI problem in Europe is still intensifying, albeit more slowly. In every region, the AAPC of the age-standardised YLD rate was markedly higher than that of the age-standardised YLL rate. This signifies that high BMI increasingly forces people to live longer with poor health and reduced quality of life, rather than simply causing premature death(Reference Machado-Fragua, Sabia and Fayosse23). The most likely driver is advances in medical care that improve survival from acute fatal events triggered by high BMI, leaving survivors to cope with chronic disabling conditions such as osteoarthritis and diabetic complications(Reference Liu, Zong and Luo24). These trends may impose massive long-term care costs and economic strain on health systems.
We analysed the disease-spectrum profile attributable to high BMI across continents. The results reveal that, although high BMI acts as a universal risk factor, it produces distinct patterns of disease in different regions. In all three continents, cardiovascular conditions dominate the ASDR linked to high BMI. Myocardial infarction, stroke and other acute cardiovascular events are the main drivers of mortality, underscoring the critical importance of preventing cardiovascular events in people with high BMI(Reference Nicholls, Ryan and Deanfield25).
In Asia, diabetes and kidney diseases account for the largest share of the burden. Asian populations develop insulin resistance and hyperglycaemia at relatively low BMI levels(Reference Sun, Kovacs and Guiu-Jurado26). Diabetic complications such as renal failure and neuropathy may not cause immediate death, but they generate enormous long-term disability(Reference Dal Canto, Ceriello and Rydén27). Europe has the most aged population. High BMI is a major risk factor for neurodegenerative disorders, several cancers and digestive diseases such as fatty liver cirrhosis(Reference Yun, Son and Koh28). These conditions predominate in the elderly, yielding a more diversified disease spectrum. In Africa, chronic diseases driven by high BMI – especially CVD and diabetes – have risen rapidly, producing a double burden that is already heavy(Reference Bamidele Adelowo, Lemos Ferreira and Besis29).
Using ARIMA forecasting models, we projected future BMI-related burden. Without special interventions, deaths and DALY attributable to high BMI will increase markedly in all three continents. This finding demands immediate, region-specific action. Asia must place the containment of diabetes at the core of public health strategy, alongside cardiovascular control, by expanding early screening and life-long management. Europe needs to go beyond classical cardiometabolic endpoints and integrate neurodegenerative diseases and cancers into its obesity prevention framework, with special attention to quality of life in older adults. Africa should focus on controlling common chronic diseases, strengthening primary-care systems for hypertension and diabetes and implementing population-wide policies to curb rising obesity.
This study has several limitations. First, our analysis relies entirely on modelled estimates from the GBD 2023 study rather than primary empirical data, and the accuracy of these estimates depends heavily on the availability and quality of underlying source data, which varies considerably across regions. Second, substantial disparities in data quality exist across the three continents: many low- and middle-income countries in Africa and parts of Asia have limited vital registration and survey data, leading to greater reliance on covariate-based imputation, whereas European countries generally benefit from more comprehensive surveillance systems, complicating direct cross-continental comparisons. Third, this study adopts an ecological design analysing aggregated data at the continental and country level; thus, our findings describe population-level associations rather than causal relationships at the individual level, and readers should exercise caution against ecological fallacy and overinterpretation. Fourth, our uncertainty quantification is limited to the 95 % UI from GBD, and we did not conduct additional sensitivity analyses such as excluding countries with lower data quality or employing multi-model ensembles. Fifth, the ARIMA forecasting model assumes that historical trends will continue into the future, which may not hold if major policy interventions or epidemiological shifts occur. Despite these limitations, this study provides a comprehensive comparative assessment of high BMI-related disease burden across Asia, Europe and Africa within a unified analytical framework.
Conclusion
High BMI has led to a significant disease burden across Asia, Europe and Africa, and its epidemic trend has been rising in recent years. It is projected that high BMI will continue to cause a substantial disease burden in these three continents in the future. Targeted prevention and control measures, tailored to the specific characteristics of the high BMI-related disease burden in different regions, are recommended.
Supplementary material
For supplementary material accompanying this paper visit https://doi.org/10.1017/S1368980026103620
Data availability statement
To download the data used in these analyses, please visit the Global Health Data Exchange GBD 2023 data-input sources tool at https://vizhub.healthdata.org. No permission is required for anyone to access this data.
Acknowledgements
The authors thank institute for health metrics and evaluation for their contribution to GBD.
Financial support
This study was supported by the Scientific Research Education Scientific Research Projects for Middle-aged Young Teachers from the Education Department Fujian Province (grant number: JAT251052) and Joint Funds for the Innovation of Science and Technology, Fujian province (grant number: 2024Y9349). This work was also supported by the Nursery Fund Project of the Second Affiliated Hospital of Fujian Medical University (grant number: 2026MP25)
Competing interests
The authors declare no competing interests.
Authorship
Study design: Zhangsheng Dai. Data collection: Xiaocong Lin. Data analyses: Zhangsheng Dai. Results interpretations: Xiaocong Lin. Manuscript writing: Huange Cai. Manuscript proofing: Kaibin Fang. Ethical standards This study utilised anonymised data compiled by the Institute for Health Metrics and Evaluation (IHME) at the University of Washington. The research protocol, including the waiver of informed consent, was reviewed and approved by the Institutional Review Board (IRB) of the University of Washington.
Consent for publication
Not applicable.
Clinical trial number
Not applicable.



 Open access

