I. Introduction
Behavioral economic research has exhaustively cataloged consumer biases. For example, people sometimes overweight low probability events, reverse preferences in pricing versus choice tasks, have inconsistent preferences over time, and are sometimes less likely to make a choice when the choice set size grows. Despite this extensive development in the literature, much less is known about how sellers can correct these errors. Instead, these studies focus on the systemic errors made in consumer decision making, thereby encouraging policymakers to generate additional government regulations to alleviate the anomalies (Thaler and Sunstein, Reference Thaler and Sunstein2003). Because behavioral economists generally assume that these behavioral anomalies represent opportunities for Pareto-improving government intervention, they have the potential to neglect ways that market participants might eliminate the bias themselves (List, Reference List2003; Earl, Friesen, and Shadforth, Reference Earl, Friesen and Shadforth2017; Smith and Zywicki, Reference Smith, Zywicki and Abdukadirov2016). That is, by omitting the role played by sellers and other entrepreneurs, behavioral economics has not taken into account that, if left to their own devices, markets could eliminate biases. As such, we contribute to the literature on the institutional role entrepreneurs play in market transactions.
This study builds on Malone and Lusk (Reference Malone and Lusk2017), who studied choice overload of craft beer at a wine bar in Oklahoma. Their findings suggest that, in this narrow context, consumers sometimes feel overwhelmed by increases in the number of options; however, the seller could mitigate this issue by behavioral nudges such as the addition of third-party quality ratings. Yet a key question remains for this market: Are these findings generalizable to the American beer-drinking public? Therefore, the focus of this article is to use a representative national sample of Americans to determine which consumers face choice overload (CO)Footnote 1 in their beer choices. This study also evaluates if there are systemic differences in the effectiveness of nudges when the “nudger” is a first party or a third party.
For this study, menus are varied to examine the effectiveness of uncertainty-reducing mechanisms that might be easily implemented by sellers. The experiment is constructed so that there are preconditions for CO; namely, that there are a large number of options listed, and none are well known by the casual drinker. While these choices are hypothetical, a key benefit to our approach is that we can collect data on demographics, personalities, and preferences to determine what types of consumers are likely to experience CO. In addition, a survey experiment allows our sample to be more generalizable than that of a location-specific field experiment.
This article identifies ways in which entrepreneurial actions internally correct CO in a menu. Because of the myriad of choices, the cognitive effort to select a beer has increased drastically, which could generate a choice overload problem for some consumers (Reutskaja and Hogarth, Reference Reutskaja and Hogarth2009). It is likely that different types of consumers respond differently to an excessively large menu, so we expect that any nudge implemented by a seller will have varying effects depending on the type of consumers the bar serves. Moreover, beer is an experience good, so its quality is unobservable until it is consumed. Thus, it is also likely that CO is present for consumers who are uncertain about whether they like novel beers.
The remainder of this article is organized as follows. In the background section, we discuss the previous literature on choice overload, as well as the seller's role in alleviating this type of behavioral anomaly. Then we introduce and discuss the results of an online experiment where participants chose which beer they would drink from a menu selection of 5 options and 18 options. Using this data, we estimate the likelihood of selecting a beer while varying the number of options available from 5 choices to 18 in the presence of search cost-reducing nudges that are likely to reduce uncertainty. The final section concludes with a discussion on the shortcomings of our approach and the practical applications of our findings.
II. Background
The fact that some consumers can find large choice sets overwhelming has been a fixture in the academic literature for some time. Most notably, Iyengar and Lepper (Reference Iyengar and Lepper2000) conducted a series of experiments targeted at identifying this potential effect. Their best-known experiment showed that an increase in the number of jams at a specialty foods store would result in a decrease in the number of jams purchased. Some researchers have taken this finding to suggest that government intervention might at times be necessary to prevent this “tyranny of choice” (Schwartz, Reference Schwartz2000).
Despite numerous studies, researchers have failed to consistently identify the phenomenon of CO (Scheibehenne, Greifeneder, and Todd, Reference Scheibehenne, Greifeneder and Todd2010), with few variables robustly identifying reasons for the inconsistent effect size (Chernev, Böckenholt, and Goodman, Reference Chernev, Böckenholt and Goodman2015). This struggle to identify choice overload (CO) has spurred articles whose focus has been to incorporate the paradox into a standard theoretical framework (Kamenica, Reference Kamenica2008; Norwood, Reference Norwood2006). Empirical research has also been conducted to identify potential moderating variables of CO (Scheibehenne, Greifeneder, and Todd, Reference Scheibehenne, Greifeneder and Todd2009; Chernev, Böckenholt, and Goodman, Reference Chernev, Böckenholt and Goodman2015). However, to date, research on CO has largely omitted the seller's role.
As the primary entrepreneur of the market transaction, sellers have the most to gain by encouraging would-be buyers toward a decision. These entrepreneurs have an incentive to identify the optimal number of choice alternatives because they are motivated to increase consumer demand. For many buyers, the alternatives of additional choices can be a welcome addition, increasing the likelihood consumers might find their preferred option. This is evident by the rapid increase in the number of options in grocery stores, for example, as the average grocery store has increased the number of products it sells by more than 500% over the past few decades (Consumer Reports, 2014). At the same time, some consumers may prefer a smaller number of choices, and demand might increase by raising the visibility of certain products over others. Even those who have a deep knowledge of the product category are likely to benefit from increased product visibility, but it is likely that those with the least knowledge of the market will benefit most from a nudge in this fashion. As such, the sellers themselves might eliminate the behavioral anomaly through a simple uncertainty-reducing nudge such as prominently highlighting a “special” on a menu.
The success of the primary entrepreneur's nudge might be confounded with the perceptions of buyers who might believe that the seller does not have their best interests in mind, and rather, are more concerned with short-term profit (Diamond, Reference Diamond1971; Ganesan, Reference Ganesan1994; Jin and Leslie, Reference Jin and Leslie2003). This additional uncertainty creates another opportunity for tertiary entrepreneurs to provide supplementary information to the buyer (McMullen and Shepherd, Reference McMullen and Shepherd2006; Bylund and McCaffrey, Reference Bylund and McCaffrey2017). Furthermore, knowledge of the market has been linked to the likelihood that an entrepreneurial opportunity will be exploited (Arentz, Sautet, and Storr, Reference Arentz, Sautet and Storr2013; Acs, Audretsch, and Lehmann, Reference Acs, Audretsch and Lehmann2013). Thus, a nudge developed through a tertiary entrepreneur is likely to be more effective in mitigating behavioral anomalies.
A. Measures of Consumer Heterogeneity
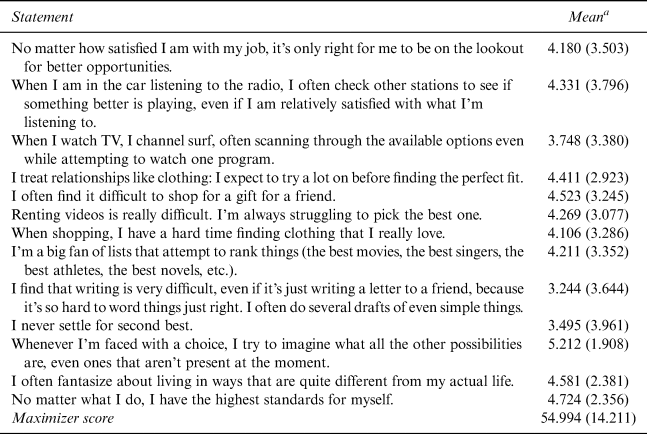
We first sought to identify consumers who might experience CO, as identifying moderating variables has sometimes proven difficult (Scheibehenne, Greifeneder, and Todd, Reference Scheibehenne, Greifeneder and Todd2009; Hadar and Sood, Reference Hadar and Sood2014). We examine whether CO is more (or less) likely to exist when consumers are (1) “maximizing” in their consumption choices, (2) are familiar with the market, or (3) prefer novel products in general. Schwartz et al. (Reference Schwartz, Ward, Monterosso, Lyubomirsky, White and Lehman2002) developed a scale which identifies the people most likely to experience the paralysis and regret endemic of CO. Basing their scale on Simon (Reference Simon1978), Schwartz et al. (Reference Schwartz, Ward, Monterosso, Lyubomirsky, White and Lehman2002) first identify the “satisficers,” who simply choose the first option they discover that will satisfy some utility threshhold. By contrast, maximizers “will settle for nothing less than the best” (Simon, Reference Simon1978, p. 2). As such, when “maximizers” make a choice, they are more likely to regret their decision once they consider the opportunity cost of other alternatives. Arunachalam et al. (Reference Arunachalam, Henneberry, Lusk and Norwood2009) validated this finding through multiple field experiments while identifying whether participants would voluntarily reduce their choice set size. They found that the maximizer-satisficer scale could predict CO, although the size of the effect was small and difficult to detect. We include the maximizer-satisficer scale to identify consumer heterogeneity (found in the Appendix), where consumers identify on a Likert scale the extent to which they agree with different statements about how they make choices (1 = “Completely disagree,” 7 = “Completely agree”).
While the maximizer-satisficer scale has been identified as a moderator of CO, other variables might be a better predictor of CO. In addition to the maximizer-satisficer scale, we tested the efficacy of two additional moderators: a product familiarity scale and a novelty-seeking scale. First, it is likely that increases in product familiarity will reduce the prevalence of CO. This assertion echoed that proposed by Mogilner, Rudnick, and Iyengar (Reference Mogilner, Rudnick and Iyengar2008), who only found choice overload for inexperienced participants. Similarly, Chernev (Reference Chernev2003a) finds that consumers with clearer articulated preferences are more likely to prefer a larger choice set. Thus, we asked participants how often they drink a seven-point craft beer where one indicates “never” and seven indicates “daily.”
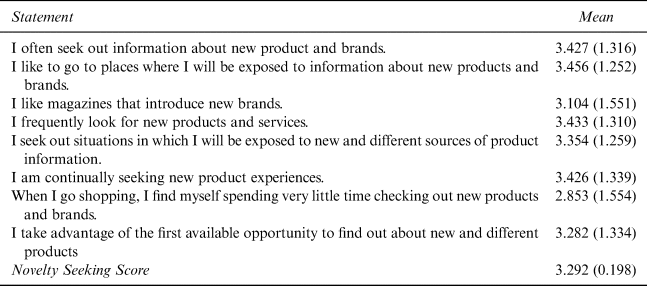
The extent to which a drinker prefers craft beer to the alternatives has been linked to the drinker's desire for novelty (Malone and Lusk, Reference Malone and Lusk2018), and perceived variety has been shown to moderate the effect size of CO (Szrek, Reference Szrek2017). Therefore, novelty seeking is likely to be a key characteristic in identifying buyers who suffer from CO. To test this assertion, the survey included a variation of the Consumer Novelty Seeking Scale developed by Manning, Bearden, and Madden (Reference Manning, Bearden and Madden1995). This scale asks participants to indicate their agreement with seven statements on a five-point scale, which include “I like to go to places where I will be exposed to information about new products and brands” (see the Appendix for the precise statements). We create a novelty seeking score for each person by averaging their answers to the seven questions.Footnote 2
B. Treatments
In our experiment, we assume that choosing a beer is preferred to not choosing. Thus CO is akin to deciding to purchase beer in the smaller choice set and deciding against purchasing a beer in the larger choice set. Supposing CO can be found for some consumers in our sample, we seek to identify whether sellers might be able to “nudge” these consumers into making a decision. Previous research suggests that the cause of CO is the convergence of search costs, information asymmetry, and uncertainty (Kamenica, Reference Kamenica2008; Norwood, Reference Norwood2006). In other words, reductions in choice complexity can moderate CO (Greifeneder, Scheibehenne, and Kleber, Reference Greifeneder, Scheibehenne and Kleber2010; Iyengar and Kamenica, Reference Iyengar and Kamenica2010). Therefore, we test the efficacy of two nudges.
Even though the customer usually does not know why the menu item is considered a special for that day, restaurants often list and servers often recommend “specials.” Just as providing simple information to employees is likely to increase employee participation in a 401(k) program (Clark, Maki, and Morrill, Reference Clark, Maki and Morrill2014), simply making one of the options more cognitively available should decrease CO. We hypothesize that this practice is done in part to minimize CO for consumers, that proposing an “ideal point” (e.g., highlighting a special) is likely to moderate CO (Chernev, Reference Chernev2003b). As such, we first test the listing of a “special” on the menu. Similar to the traditional practices at a bar or restaurant, we do not provide any context as to why the product is “special.” Because prices might also be a method toward reducing CO, we did not change the price of the “special” beer, but instead simply highlighted an option as a “special.”
For our second nudge, we focused on a professional and crowd-sourced rating service, as they have become common ways individuals aggregate quality information to make more informed decisions (Costanigro, McCluskey, and Mittelhammer, Reference Chernev2007). Multiple ratings websites make information freely available to the beer consumer. For our purposes, we use ratings from Beer Advocate. Solely owned by founders Jason and Todd Alström, Beer Advocate is the largest poster of expert and crowd-sourced quality information in the beer community. The effectiveness of these quality scores is likely to vary based on the differences in consumer sentiments. For example, these scores might be useful for a person unfamiliar with beer varieties, but might be less useful for a consumer who is more familiar with craft beer.
III. Methods
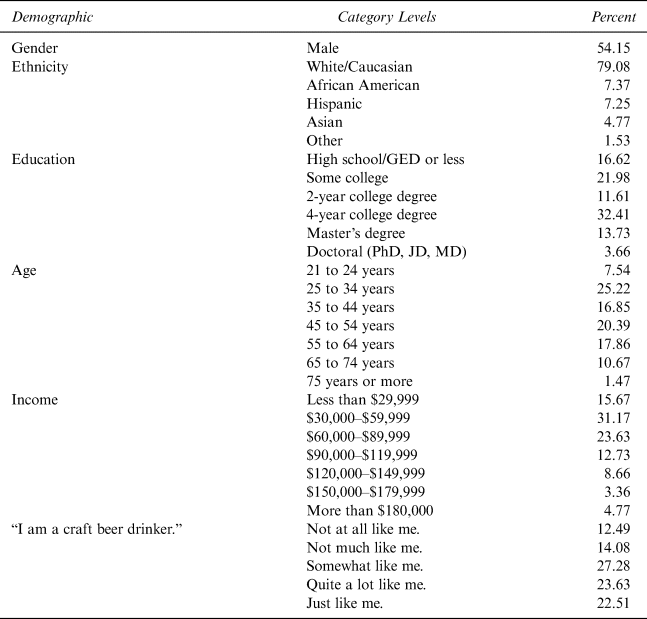
To test our hypotheses, we conducted an online experiment with 1,697 survey respondents. Participants were randomly selected from an optional online panel of likely beer drinkers maintained by SSI® who paid participants approximately $1.50 in gift cards, frequent flier miles, or points to complete the survey, and the study was conducted using Qualtrics® survey software (instructions and survey items are included in the Appendix). The data were collected in May 2015. Each participant was asked to choose beers from all treatments (i.e., we used a within-subject design), creating 1,697 x 6 = 10,182 observations of choice. Table 1 shows the sample characteristics of the data. More than 70% of the participants are craft beer drinkers and almost half of the participants are under 45 years of age. The average participant drinks beer once a week, wine or liquor 2–3 times a month, and craft beer monthly. Table 2 presents a correlation matrix between the three personality scales (maximizer-satisficer, craft beer consumption, and consumer novelty seeking). All scales correlated positively with each other. Maximizers tend to be more likely to drink craft beer and seek novelty in their purchase choice. Due to the correlation between these variables, only one of these measures is included in each model.
Sample Characteristics of Menu Experiment

Number of observations: 1,697.
Correlation Matrix for Personality Scales

Number of observations = 1,697. An asterisk represents significance at the α = 0.01 level. Numbers in parentheses are standard deviations.
A. Experimental Design
The experiment consisted of a 2 x 3 experimental design that varied the number of options (5 or 18) and the search cost-reducing nudge (a control menu, a special menu, and a Beer Advocate scores menu). To isolate the effects of our treatment variables, we held prices for all beers constant at $5 across all treatment combinations and used a within-subject design. Because the previous literature indicates that CO is difficult to observe, our decision to use the within-subjects design for our principle analysis came from two main concerns. First, a within-subject design holds all individual-specific characteristics (such as demographics) constant, which increases the power of the test. Second, we wanted to maximize the number of observations we could obtain from our sample given a fixed budget constraint.Footnote 3 A potential disadvantage to within-subject designs is that the order fatigue or the learning effects might contaminate comparisons (Ariely and Levav, Reference Ariely and Levav2000). We partially addressed this concern by varying the order in our within-subject design as discussed later. Prior research suggests that sellers might respond to CO simply by organizing the options into smaller categories (Kahn and Wansink, Reference Kahn and Wansink2004; Gourville and Soman, Reference Gourville and Soman2005). For example, Mogilner, Rudnick, and Iyengar (Reference Mogilner, Rudnick and Iyengar2008), found that categorizing magazines on the rack of a supermarket chain improved consumer satisfaction and reduced the problems associated with CO. To control for this potential effect, beers on the menu were listed in the same order for each menu.
The experiment was framed to mirror the experience of patrons in a restaurant. The respondents were told the following:
“Imagine you are at a restaurant. On the following pages, we will show you several different drink menus. For each menu, please click with your mouse on the name of the drink that you would be most likely to order.”
If restaurant patrons do not order a beer, they usually have alternative options; as such, it would seem disingenuous for a beverage menu to offer beer and nothing else. For our experiment, if they did not select any type of beer, they could click on a different part of the screen that said: “I would choose something else to drink.”Footnote 4 The participants were randomly assigned to one of two menu options to partially avoid confusion of the mentioned order. Half of the respondents received all 5 treatment options first, followed by the 18 treatment options, while the other half of the respondents became the control with 5 then 18 options, then the special with 5 then 18, then the scores with 5 then 18. While other orders could have been used, these two orders preserve internal validity due to learning.Footnote 5
B. Empirical Model
As noted, we identify that CO occurs when the probability of purchase is negatively correlated with the number of options, since a recent meta-analysis identified that this method successfully identifies CO (Chernev, Böckenholt, and Goodman, Reference Chernev, Böckenholt and Goodman2015). It is likely that there is heterogeneity across individuals, since a given individual's responses are likely to be correlated across treatments. To control for this heterogeneity, we estimated random effects logit models where standard errors are clustered at the individual level. Given the correlation between the three measures of consumer heterogeneity (consumer novelty-seeking, maximizer-satisficer scale, frequency of craft beer consumption), we did not want to include all of them in the same model; rather, we estimate three separate models with the only difference being the scale used. Mathematically, the log odds that participant i does not choose a beer in menu t can be defined as:
 $$\eqalign{\log {\rm it[}P\left( {Y_{it} = 1} \right){\rm ]} & = u_i + {\beta }_1 \times {\rm Option}{\rm s}_t \;{\rm + }\;{\beta }_2 \times {\rm Special}{\rm s}_t + {\beta }_3 \times {\rm Score}{\rm s}_t \cr &\quad + {\beta }_{\rm 4}\times {\rm Scale}_i + {\beta }_{\rm 5} \times {\rm (Option}{\rm s}_{t} \times {\rm Scores}_t) \cr &\quad + {\beta}_{\rm 6} \times {\rm (Option}{\rm s}_{t} \times {\rm Special}{\rm s}_t) + {\beta }_7 \times ({\rm Special}{\rm s}_{t} \times {\rm Scale}_i) \cr &\quad + {\beta }_{\rm 8} \times ({\rm Scores}_{t} \times {\rm Scale}_i) + {\beta }_{\rm 9} \times {\rm (Options}_{t} \times {\rm Scale}_i) \cr &\quad + {\beta }_{10} \times ({\rm Specials}_{t} \times {\rm Options}_{t} \times {\rm Scale}_i) \cr &\quad + {\beta }_{{\rm 11}} \times ({\rm Scores}_{t} \times {\rm Options}_{t} \times {\rm Scale}_i) + {\rm \varepsilon }_{it},} $$
where u i are participant random effects, Optionst are the number of beers listed on menu t, Specialst a dummy for whether a special was listed on menu t, Scorest a dummy for whether Beer Advocate Scores were listed on menu t, Scalei was participant i’s personality scale score (maximizer-satisficer, consumer-novelty seeking, or craft beer consumption frequency) , εit was the error term, and all β i are parameters to be estimated. To compare the goodness of fit across our three estimated models, we compared maximum likelihood values (since all models contain the same number of parameters, this is equivalent to comparing AIC and BIC) and conduct generalized chi-square tests. Then, to identify the effects of the menu treatment on CO, we use the parameter estimates of equation (1) to calculate the probability of making a purchase for people with difference scale values in different treatments.
IV. Results
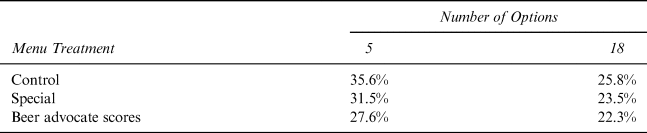
Table 3 shows the percentage of consumers who did not choose a beer for each of the six menu treatments. Increasing the number of options, adding specials or providing product quality scores seems to increase the likelihood that a beer will be chosen relative to the 5-option control group. On average, the changes in the percentage of consumers who did not choose a beer due to increases in the number of options were smaller when the search-cost reducing treatments were included in the menu. Adding specials to the menu decreased the percentage of people who did not select a beer from 31.5% in the five-option menu to 23.5% in the 18-option set. Beer Advocate scores decreased the frequency of no beer choice to 22.3% in the treatment with 18 options, from 27.6% in the treatment with 5 options.
Percentage of Times a Beer Was Not Chosen for Each Menu Treatment

Number of observations = 1,697.
By comparing choices between menus with 5 and 18 options, we can determine the existence of CO for craft beer in our experiment. We do not find this to be the case overall, as in the control menu, 35.6% of participants did not select a beer from the 5-option menu and 25.8% did not select a beer in the 18-option menu. In this case, more options increased the chance of purchase. Only 39 people (of 1,697) selected “none” with the 18-option control menu and then bought a beer in the five-option menu.
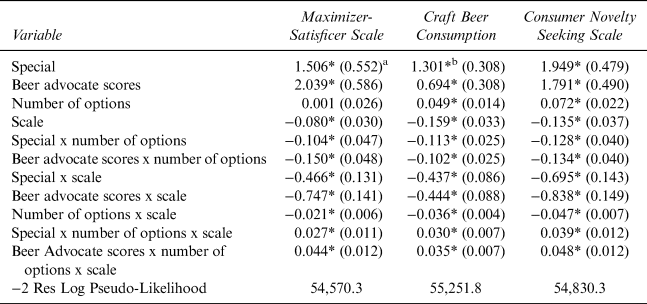
Table 4 shows the random effects logit estimates.Footnote 6 The log-likelihood values suggest that the models that consider consumption frequency of craft beer and consumer novelty seeking fit the data better than including the Maximizer-Satisficer scale. Significant two-way and three-way interactions exist between the number of options, menu treatments, and personality scales, implying adding specials or scores are likely to have differential effects depending on the number of options present. The statistically significant three-way interaction terms reported in Table 4 suggest that, given the consumer experiencing CO, the number of options and the menu treatment is likely to have statistically significant moderating effects on the probability that there will be no beer choice. Thus, the CO depends both on the type of menu and on the consumer's novelty seeking tendencies.
Parameter Estimates for CO Random Effects Logit Models That Include Personality Scale Interactions
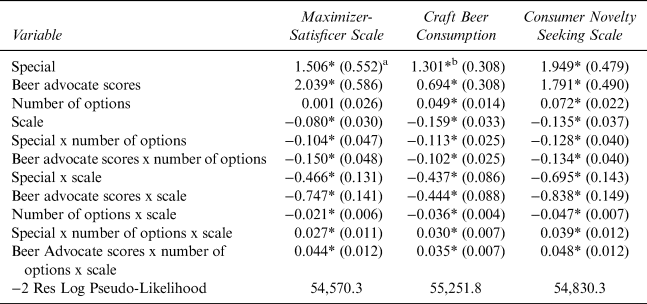
The dependent variable is choosing none. Number of choice observations = 10,182. Number of participants = 1,697.
a Standard errors reported in parentheses are clustered at the individual level. b Asterisk indicates significance at the 0.05 level.
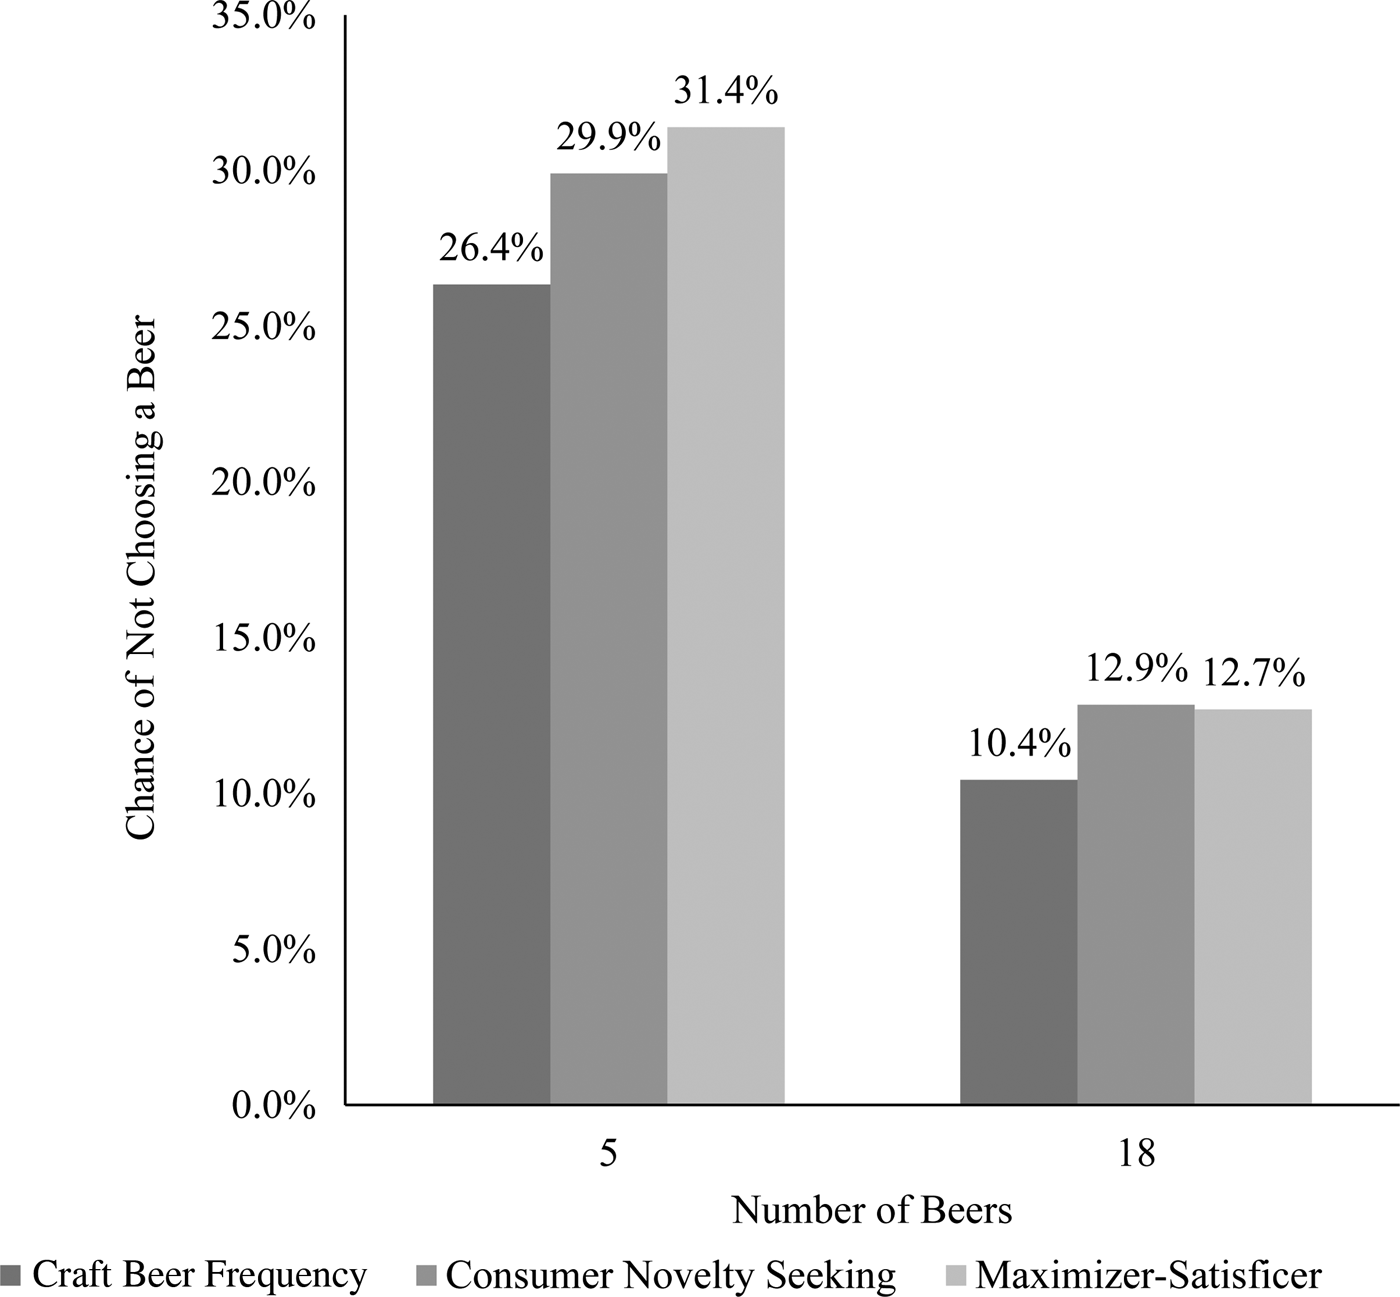
Although the significant interaction effects validated our prior belief that changes in beer choice are influenced by the interaction of the number of beers on the menu, the treatment of the menu, and the type of consumer, the existence of multiple interactions in the model make interpretation of its parameters a challenge. Because of this difficulty, we focus the discussion of our results on the figures that use the results of the regression to plot the effects of increases in the number of options for different values of personality scales and menu treatments. Figure 1 shows the probability of not ordering a beer out of the control menu for the three models, evaluated in each mean personality score. Because the three lines slope downward, this figure suggests that most participants did not exhibit CO. Rather, the probability of non-purchase decreased by approximately 30% when there were 5 beers to almost 10% when 18 beers were included on the control menu.
Probability of Not Selecting a Beer for the Control Menu at the Mean Personality Scale Value

A. Moderating Variables
The fact that most of the participants did not experience CO does not imply the absence of an effect in all subjects. The previous literature suggests that maximizers are more susceptible to CO (Schwartz et al., Reference Schwartz, Ward, Monterosso, Lyubomirsky, White and Lehman2002). It is likely that someone who rarely drinks craft beer might also struggle with an overwhelming number of options. Additionally, because craft beer drinkers are likely novelty seeking in their beer choices, it is possible for neophobic consumers to experience CO even if the effect is absent in the average results.
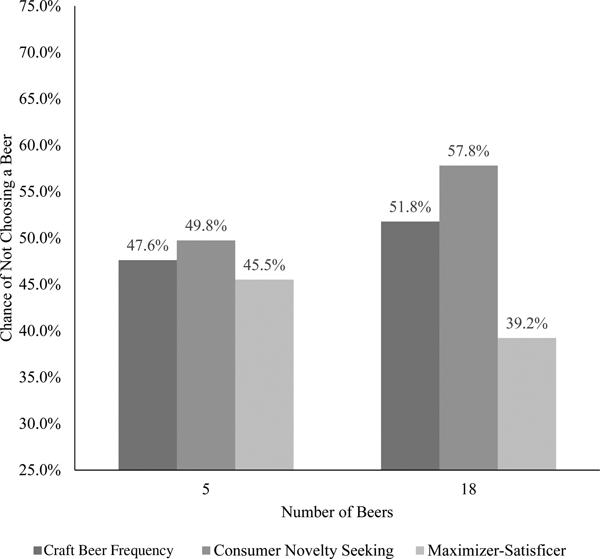
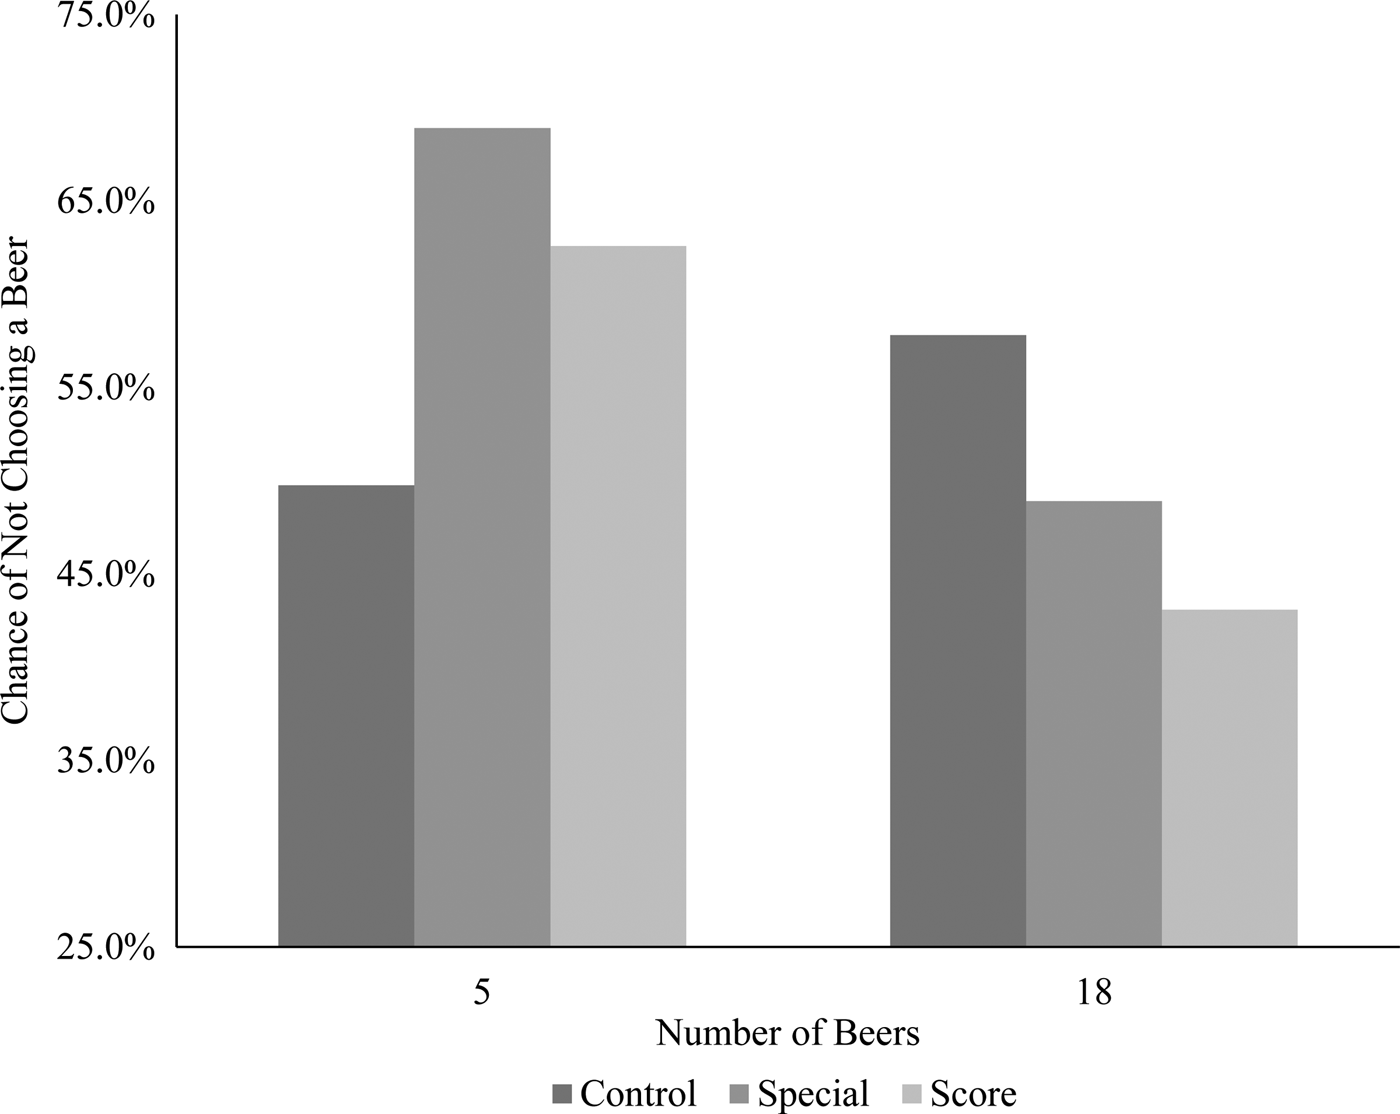
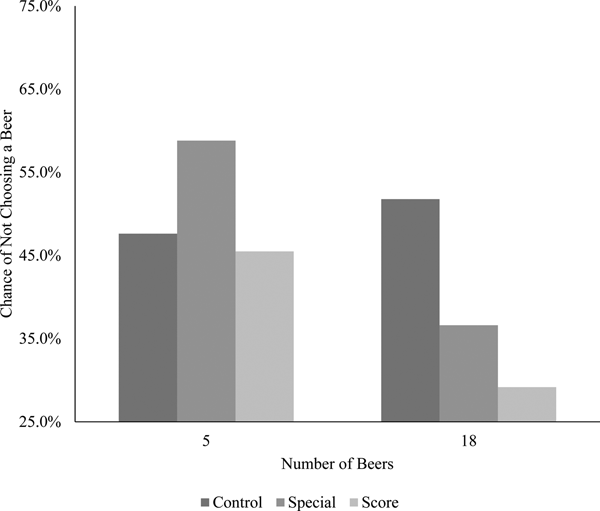
To investigate these notions, Figure 2 shows the probability of not choosing a beer for the consumers most likely to exhibit CO from the models listed in Table 2. Consumers who were the least novelty seeking in their preferences (CNS = 1) experienced the steepest increase in their probability of selecting “none” when the number of options on the control menu increased from 5 options to 18 options. These neophobic participants selected “none” 49.8% of the time when they had 5 options in the control menu, but their probability of no choice increased to 57.8% when 18 options were in the control menu—they suffered from CO. Participants who suggest that they never drink beer exhibited a similar increase in their probability of selecting “none” from 47.6% to 51.8% when the number of options increased from 5 to 18. Conversely, the maximizers did not experience CO, since their probability of no choice actually decreased from 45.5% to 39.2% when the number of options in the control menu increased from 5 to 18 beers.
Probability of Not Selecting a Beer for the Control Menu at the Low Personality Scale Value (Scale = 1)

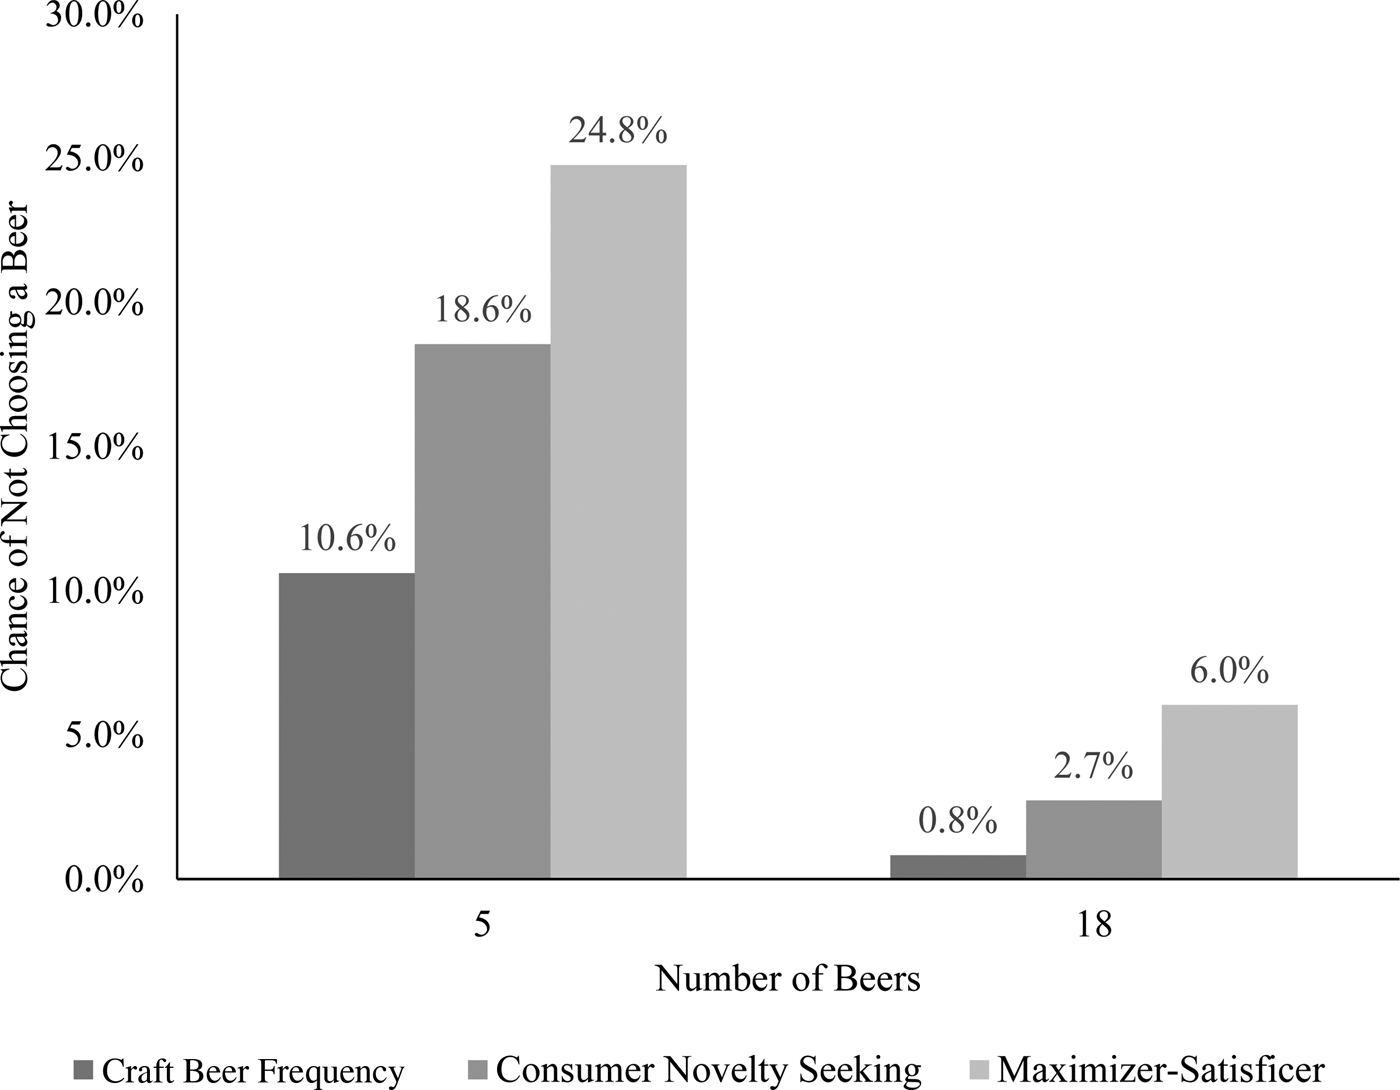
The opposite is true for those with high scores on the scales, as they were unlikely to experience CO. Figure 3 shows the probability of not choosing a beer for consumers who are novelty-seeking, satisficing, and frequently drink craft beer when they are shown the control menus with 5 and 18 beer options. In all cases, increasing the number of options decreased the probability that there was no beer choice. Consumers who were satisficing decreased the most, as their probability of not choosing a beer decreased by 18.7%. However, for all consumers shown in Figure 3, the probability of not choosing a beer was less than 7.0% when there were 18 options on the beer menu, suggesting that they all prefer more options to less options.
Probability of Not Selecting a Beer for the Control Menu at the Maximum Personality Scale Value

B. Treatment Effects
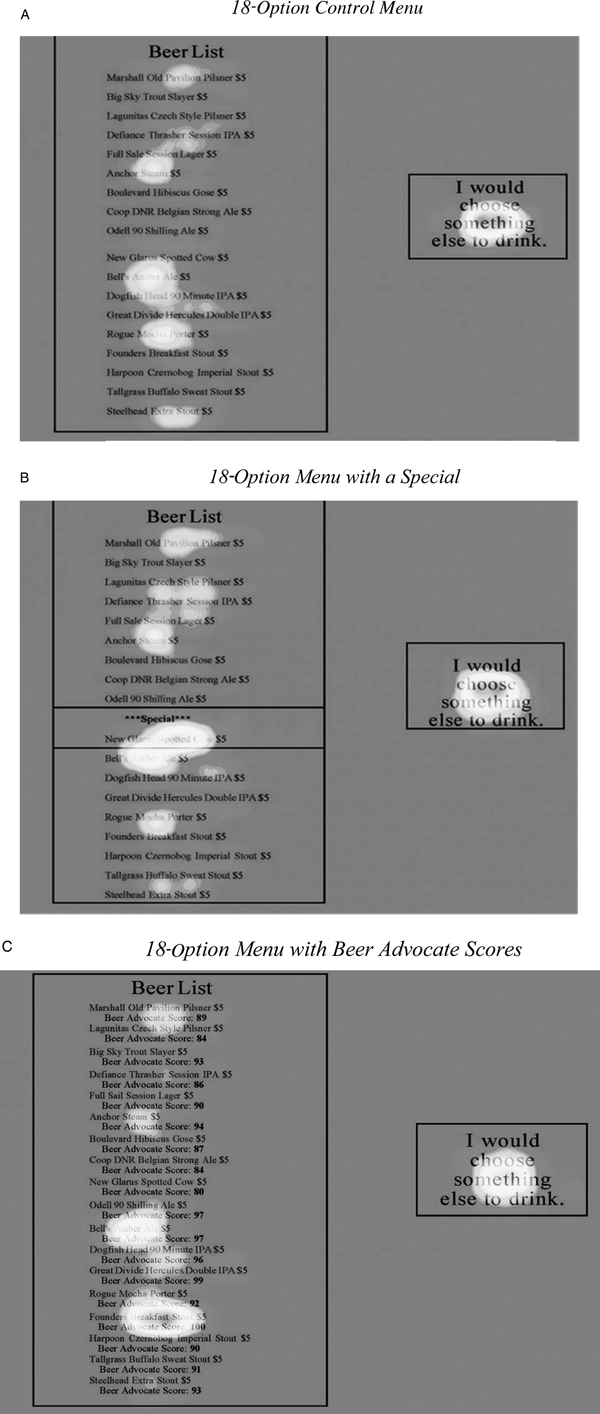
We now test our expectations that primary and tertiary entrepreneurs can reduce the consequences of CO. Figure 4 shows heat maps associated with the frequency of choices (or mouse clicks) for 18-option menus. Comparing Figure 4, Panel A to Panels B and C, we can see that the participants responded to the treatments, as expected. When the New Glarus Spotted Cow was highlighted as the special, more participants chose this option, compared to the control menu where no special was highlighted. When Beer Advocate scores were posted, the highest-rated beers (Founders Breakfast Stout in the 18-option menus and the Great Divide Hercules Double IPA in the 5-option menus) experienced a boost in the selection compared to the control menu with no Beer Advocate scores. In total, the heat maps suggest changes in menu structure influence beer choice.
Heat Maps Displaying the Frequency of Mouse Clicks in Different Treatments

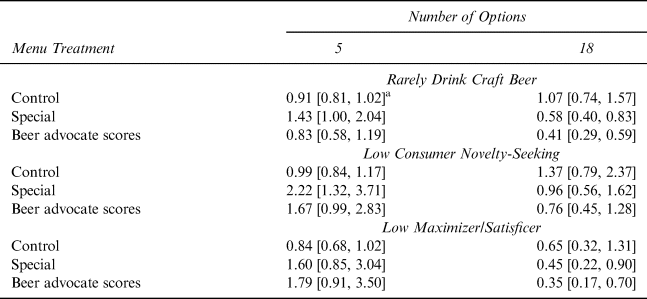
What is more important for this analysis is the effect of the treatments for the participants most likely to exhibit CO. Because we found that low novelty seekers and unfamiliar beer drinkers are most likely to opt out of choosing a beer when there is an increase in the number of beers listed in the control menu, we focus on how those consumers respond to the menu-based nudges. Table 5 presents the estimated odds of not selecting a beer for consumers in our sample most likely to exhibit CO. Even for these consumers, we do not find the effect to be statistically significant, as the 95% confidence intervals overlap for the 5-option and 18-option control menus in the three models. The odds of not selecting a beer decreases for consumers who rarely drink craft beer when a special is included in the menu, and confidence intervals only slightly overlap when Beer Advocate scores are included. Similarly, when the number of options on the menu increases from 5 to 18, the odds of not selecting a beer decreases for low novelty-seekers when specials or Beer Advocate scores were included in the menu. Taken together, these results suggest search cost-reducing nudges implemented by entrepreneurs have the potential to reduce the likelihood of CO being present.
Estimated Odds of Not Choosing a Beer for Consumers Most Likely to Exhibit CO

a Numbers in brackets are 95% confidence intervals.
Figure 5 shows the probability of not choosing a beer for participants who had a Consumer Novelty Seeking score of one for the control menu, as well as the two menu treatments. Again, when low novelty seekers were given the control menu, they experienced CO as their probability of choosing none increased by 8.1%. The search-cost lowering nudges influenced the likelihood of not selecting a beer for low novelty-seekers, thereby eliminating CO. When the special was included in the menu, the probability of choosing none decreased by 20.0% and when the Beer Advocate scores were included, the probability of choosing none decreased by 19.5%.
Probability of Not Selecting a Beer for the Treatments and Control for Participants with Low Consumer Novelty Seeking (CNS = 1)

We also found that participants who do not usually drink craft beer were likely to exhibit CO, as increasing the number of beers from 5 to 18 on a standard menu increased the probability that a rare craft drinker would not choose a beer by 4.2%. Figure 6 shows the probability that these participants do not choose a beer when the control menu is presented, as well as the two treatment menus. A pattern of results similar to those found in customers scoring low in novelty seeking arises. Instead of the apparent CO phenomenon in the control menu, the Special and Beer Advocate scores again reduced the probability of having no choice. When a special was included on the menu, the likelihood that a participant would not choose a beer decreased by 22.2%. Similarly, when Beer Advocate scores were added to the menu, the probability of non-purchase decreased by 16.3%.
Probability of Not Selecting a Beer for the Treatments and Control for Participants Who Rarely Drink Craft Beer (Craft = 1)

V. Conclusion
The primary objective of this study was to determine the prevalence of choice overload in the beer market. Our analysis reveals that, although “more is better” in aggregate, participants who were either neophobic in their novelty seeking or rarely drank craft beer could be susceptible to CO. However, both primary and tertiary entrepreneurs appear to be able to reverse the negative purchasing trend when it does exist.
While this article makes a meaningful contribution to the literature on CO, it also faces several limitations. First, our study utilized a stated preferences design. In a real market environment, CO might be more problematic (Scheibehenne, Greifeneder, and Todd, Reference Scheibehenne, Greifeneder and Todd2009). For example, Malone and Lusk (Reference Malone and Lusk2017) show that, in a context in which consumers are unlikely to seek a variety or are familiar with craft beer, CO might be mitigated by crowd-sourced beer ratings, but not by including a special. In addition, our menus included 5 and 18 options. While the range between these values is likely to induce a choice overload problem, CO is likely to be nonlinear, with 5 and possibly 18 representing the “the edges” of some inverted U-shaped functional form, and therefore, choice overload is not experienced for these sets (e.g., Shah and Wolford, Reference Shah and Wolford2007; Reutskaja and Hogarth, Reference Reutskaja and Hogarth2009). We also designed the experiment to allow participants to consider each option for an infinite amount of time. It is possible that constraining the amount of time for considering choices will increase problems associated with CO (Haynes, Reference Haynes2009; Inbar, Botti, and Hanko, Reference Inbar, Botti and Hanko2011). Furthermore, we assume that choosing a beer is preferred to not choosing a beer. However, this is not always the case, since there is always the potential for purchasing regret or excessive consumption—especially in a market such as alcohol. Finally, we held all prices constant across beers and treatments in an effort to provide the greatest chance of existence of CO in our data. The prices of information conveyed might also be considered as a mechanism that might mitigate CO. Future studies could benefit by allowing prices to change in an effort to reduce CO.
Nonetheless, the results indicate that while CO might be problematic in some markets, it is not necessarily a generalizable characteristic of the beer market. Rather, buyers must exhibit a specific set of conditions for the CO to negatively influence the market process. Even given these conditions, however, entrepreneurs have developed methods to deal with the negative effects of this behavioral anomaly.
Appendix
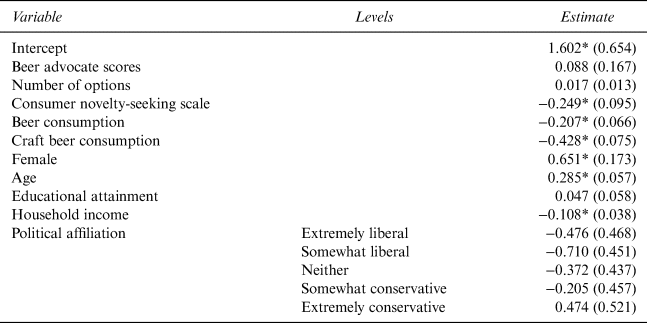
The three measures of consumer heterogeneity (consumer novelty-seeking, maximizer-satisficer scale, frequency of craft beer consumption) are positively correlated with each other. Tables A1 and A2 present the questions used to identify consumer novelty seeking and maximizing behavior. These scales were developed in previous research (Manning, Bearden, and Madden, Reference Manning, Bearden and Madden1995; Schwartz et al., Reference Schwartz, Ward, Monterosso, Lyubomirsky, White and Lehman2002) and are common tools to identify differences in consumer perceptions. For our sample, the mean novelty seeking score was 3.292, while the mean maximizer score was 3.292.
Between Subjects Design
In the first study, participants saw the six conditions, either blocked by the number of options (5-5-5, 18-18-18), or in a fixed sequence of 5-18s. A potential problem with this approach is that behavior of the participants in the next condition is unlikely to be independent of the previous condition. This opens the door to all kinds of alternative explanations, such as the principles of psychological consistency (I have chosen a beer in round 1; why should I defer choice in round 2?). What makes matters worse is that the participants have always started with a 5-options set, which compared to the 18-options set may not have appeared as overwhelming as it would had the 18 options set been shown first. Due to these threats to external validity, we conducted a similar study among the subjects. We used a 2 x 2 design with the factor levels that comprised the number of options (5, 18) and Beer Advocate scores listed (Absent, Present) in a manner that mirrored our approach in the within-subject design. This design among subjects yields roughly 250 subjects per treatment.
Results
As shown in Table A3, even with 1,061 observations, we cannot find a statistically significant effect of our treatments (although we do find effects related to novelty seeking, age, gender, and income). We interpret this finding as an indication that we do not have enough observations (or a powerful enough design) to identify what is likely a small effect related to CO. The fact that we are unable to find statistically significant effects related to our treatments, in our assessment, again justifies our first, more powerful, within-subject experimental design. The novelty seeking scale retains its statistical significance (we should note that there are no significant interactions between novelty seeking and the treatment variables), which again indicates that novelty-seeking consumers might be interested in selecting beers with which they are unfamiliar.
Consumer Novelty-Seeking Scale

Maximizer-Satisficer Scales

Logit Model Estimates Where the Dependent Variable Is the Log Odds of Choosing None