

The island of New Guinea, of which Papua New Guinea occupies the eastern half, is situated at the crossroads between Island south-east Asia and the islands and atolls of the south-west Pacific. Over 40 years of archaeological investigations along the south coast of Papua New Guinea (Fig. 1) has identified a rapid succession of cultural changes during the late Holocene. These investigations have centred on prehistoric trade and exchange, the movement of materials or goods, particularly pottery, between groups as a means of understanding the development of the ethnographically reported large scale trading systems that were operating in the region during colonial contact. One example is the hiri trading system, which involved annual long distance trading voyages by sea, transporting pots from the Port Moresby region to the Gulf of Papua, in exchange for sago (Barton Reference Barton1910; Allen Reference Allen1977a).
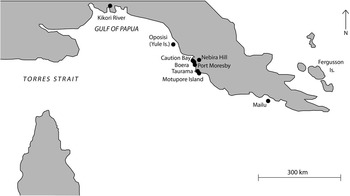
Map of Papua showing sites and places mentioned in the text (adapted from Allen et al. Reference Allen, Summerhayes, Mandui and Leavesley2011, fig. 1)

Inspired by the works of anthropologists such as Bronislaw Malinowski (Reference Malinowski1922), who studied trade and exchange in a Melanesian society, archaeologists have increasingly come to view trade and exchange in social as well as economic terms (Summerhayes Reference Summerhayes2015, 482). Trade and exchange systems may be important for creating and maintaining social networks between communities separated by long distances (Specht et al. Reference Specht, Denham, Goff and Terrell2014, 92). In the case of the hiri trading system, ties that formed between trading partners could extend over several generations, and these ties were considered by informants to be as important as the actual exchange of goods (Oram Reference Oram1982, 17).
A period hypothesised to be key to the development of these long distance interaction networks is the ‘Papuan Hiccup’ (c. 1200–800 cal bp). Events occurring during this period of regionalised socio-economic changes along the entire southern Papuan coast may have had far-reaching implications that led to the extensive exchange systems occurring during the more recent historic period. However, these changes are still poorly understood due to a lack of known archaeological sites dating to this time. The coastal site of Taurama (PNG National Museum and Art Gallery site code: AJA), located 21 km south-east of Port Moresby city (Fig. 1), is a key site for understanding changes that occurred during the Papuan Hiccup because, unlike most other prehistoric sites in the region, it contains evidence of occupation before and after this period. To address the question of whether there is evidence for changes in interaction networks across the Papuan Hiccup, the specific focus of this paper will be mapping changes in the lithic technology at Taurama, including access to raw material sources and technological organisation. A complementary methodological approach of chemical characterisation (portable X-Ray Fluorescence; pXRF) and technological analysis will be employed.
This paper begins with an outline of the cultural sequence of the Papuan south coast, before introducing the site of Taurama. An outline and justification of the methodology employed are then provided, along with the findings of the study. In the concluding section, we move from the observed data to the potential behavioural implications and explore the potential linkage of these behavioural implications to climate change in the Pacific.
THE PAPUAN SOUTH COAST CULTURAL SEQUENCE
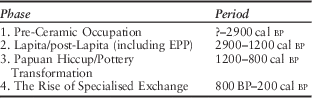
Table 1 presents the current cultural sequence for the area. Similar sequences proposed in earlier papers (Irwin Reference Irwin1991; Summerhayes & Allen Reference Summerhayes and Allen2007) have been modified in light of recent discoveries in the area (David et al. Reference David, McNiven, Richards, Connaughton, Leavesley, Barker and Rowe2011; McNiven et al. Reference McNiven, David, Richards, Aplin, Asmussen, Mialanes, Leavesley, Faulkner and Ulm2011).
The Papuan South Coast Cultural Sequence

Phase 1 represents the sketchy pre-ceramic occupation down to around 2900 cal bp. Since the first systematic archaeological investigations along the Papuan south coast in the 1960s, the investigation of long-term cultural trends has focused on the characteristics of archaeological ceramics (eg, Allen Reference Allen1972; Vanderwal Reference Vanderwal1973; Bulmer Reference Bulmer1978; Irwin Reference Irwin1985; Reference Irwin1991). For four decades, the earliest undisputed evidence of pottery in the area had been dated to around 2000 bp. The appearance of pottery along the coast at this time was thought to reflect a colonising event by Austronesian language speakers descended from the Lapita people who had colonised the virgin Pacific islands and atolls east and south of the main Solomon Island chain several centuries previously (Kirch Reference Kirch1997). Recent finds of mid–late period Lapita pottery at Caution Bay, 20 km north-west of Port Moresby, dated to 2900 cal bp (David et al. Reference David, McNiven, Richards, Connaughton, Leavesley, Barker and Rowe2011; McNiven et al. Reference McNiven, David, Richards, Aplin, Asmussen, Mialanes, Leavesley, Faulkner and Ulm2011), have now, however, provided concrete evidence for an earlier Lapita occupation on the south coast of Papua New Guinea, requiring a re-appraisal of the previous models of culture change in this area.
The similarity of the post-Lapita archaeological ceramic sequences at numerous sites dating from 2000 cal bp along the south coast, along with the presence of West Fergusson Island obsidian (Allen et al. Reference Allen, Summerhayes, Mandui and Leavesley2011), is suggestive of widespread interaction during this time. The related ceramic sequences of the 2nd millennium bp are generally referred to as Early Papuan Pottery (EPP; Summerhayes & Allen Reference Summerhayes and Allen2007, 100).
The term EPP will be used here in the same way as it was used by Summerhayes and Allen (Reference Summerhayes and Allen2007) and Allen et al. (Reference Allen, Summerhayes, Mandui and Leavesley2011). That is, it incorporates the stylistic sequences at Oposisi (Vanderwal Reference Vanderwal1973; Reference Vanderwal1978), Nebira 4 (Allen Reference Allen1972), and Mailu 01 (Irwin Reference Irwin1985). Initially, EPP pottery is decorated with elaborate shell-impressed designs frequently associated with a groove below the rim (Allen Reference Allen1972, fig. 7, 18–20; Vanderwal Reference Vanderwal1973, fig vi-6; 1978, 420; Irwin Reference Irwin1985, 248). Following this initial phase, the shell-impressed designs are replaced by various incised motifs (Allen Reference Allen1972, fig. 7, 1–17; Vanderwal Reference Vanderwal1973, figs vi-7, 8, & 9; Irwin Reference Irwin1985, 248). Late EPP decoration includes patterns ‘gouged’ out of the surface of the vessel prior to firing (Allen Reference Allen1972, fig. 6, 1–8; Vanderwal Reference Vanderwal1973, fig. vi-10). The ‘gouged’ decoration is absent from Mailu 01, which is suggestive of deepening isolation of settlements in the Mailu area from those further west (Irwin Reference Irwin1985, 213). Vanderwal’s (Reference Vanderwal1973) EPP type series remains the most detailed available for this period.
While there are generic similarities in form, method of manufacture and decoration, the exact nature of the relationship between EPP and the Lapita-period ceramics at Caution Bay is still to be fully resolved, and must await further publication of data from the region (Irwin Reference Irwin2012, 10).
The results of physico-chemical analyses of pottery fabrics from a number of EPP sites point to mainly local production, with limited movement of pottery between sites early on in the sequence (Bickler Reference Bickler1997; Summerhayes & Allen Reference Summerhayes and Allen2007, 113). Summerhayes and Allen (Reference Summerhayes and Allen2007, 117) suggest that this may be due to the movement of women (marriage partners) between villages taking pots with them. If women were potters, well-made, elaborately decorated pots could be one signal of the fitness of marriage partners. Such movements should be particularly evident early on in the sequence when the new settlements were still tenuously small. Over time, as settlements grew in size and became more independent, the need for such interaction would have waned (Kirch Reference Kirch2000, 114). Evidence for a decrease in interaction between colonies over time has been found across the Lapita world ibid., 112–14; Summerhayes Reference Summerhayes2000).
Additional support for a decrease in interaction late in the EPP sequence comes from Allen et al. (Reference Allen, Summerhayes, Mandui and Leavesley2011), who reported a decrease in the chemical variability of chert at Oposisi on Yule Island in the late EPP period. This decrease over time suggests the people of Oposisi had access to fewer sources of artefact-quality chert, which does not appear to occur naturally on Yule Island and, consequently, must have been brought to the site from the New Guinea mainland (Allen et al. Reference Allen, Summerhayes, Mandui and Leavesley2011, 74). Allen et al. (Reference Allen, Summerhayes, Mandui and Leavesley2011, 75) also found a slight decrease in the amount of obsidian coming into the site in the late EPP relative to the early EPP.
The EPP peoples’ economic base, like Lapita, was a broad one, relying on horticulture and animal husbandry alongside hunting and fishing (Summerhayes & Allen Reference Summerhayes and Allen2007, 104).
The Papuan Hiccup and the rise of specialised exchange
Beginning around 1200 cal bp there was a widespread and rapid change in socio-economic systems and ceramic design along the southern coast. The EPP ceramic tradition diverged into a number of new, localised ceramic traditions where pots started to resemble local ethnographic wares (Summerhayes & Allen Reference Summerhayes and Allen2007, 100). In each region along the coast the record is somewhat different, suggesting a number of separate local reorganisations that are likely to be causally related due to their contemporaneity (ibid., 101). In the Port Moresby and Yule Island regions, settlement patterns changed (ibid., 101). Occupation at Oposisi and Nebira 4 appears to have ended during this period (Allen Reference Allen2010). Around the same time a vast village complex was established at Boera, perhaps settled by those who abandoned other sites in the region (Swadling Reference Swadling1981, 245). After 800 cal bp there appears to be another shift of the major population in the Port Moresby region, east from Boera to Bootless Inlet. In the Mailu region, on the other hand, Irwin (Reference Irwin1985) noted continuity in settlement patterns across this period.
These changes were accompanied by an apparent discontinuation of the widespread interaction of the EPP phase. There is an absence of Fergusson Island obsidian in Port Moresby and Yule Island sites after c. 1200 cal bp, indicating that the flow of this material as far west as Port Moresby ceased with the demise of EPP (Allen et al. Reference Allen, Summerhayes, Mandui and Leavesley2011, 79).
During and after the Papuan Hiccup period it is thought that the spatially diverse and unspecialised EPP network was replaced by a series of more localised and specialised trade networks along the southern Papuan coast (Allen Reference Allen1984). A key site for understanding these developments is the prehistoric settlement on Motupore Island in Bootless Inlet (Allen Reference Allen1985). The archaeological evidence on Motupore Island suggests the development of a centre specialising in the production of pottery and small shell disc beads for trade (Allen Reference Allen1985; Allen et al. Reference Allen, Holdaway and Fullager1997). Long distance maritime trade is thought to have restarted around 500 years ago (David Reference David2008; David et al. Reference David, Geneste, Aplin, Delannoy, Araho, Clarkson, Connell, Haberle, Barker, Lamb, Stanisic, Fairbairn, Skelly and Rowe2010). Decorative comparisons, as well as pottery sourcing studies, suggest that Motupore pots were being traded over distances at least as far as the later historically documented hiri trade from this time (Allen & Duerden Reference Allen and Duerden1982, 56; Rhoads Reference Rhoads1994, 67). Further to the east, Mailu also emerges as a central place within its local region, with a monopoly on pottery manufacture and sea voyaging, whereas during the EPP period it was just one of a number of local pottery manufacturing centres (Irwin Reference Irwin1985).
The reasons for the changes during the Papuan Hiccup remain an enigma. Previous researchers have looked to migratory movements by external groups into the Port Moresby region to explain the settlement pattern changes that occur there. One possibility is a movement of people from the Massim region to the east, a suggestion supported by perceived similarities between pottery from that region and some post EPP pottery in the Port Moresby region (Bulmer Reference Bulmer1971, 57–60; Reference Bulmer1978, 371–2; Swadling Reference Swadling1981, 242). However, the link is tentative given the dearth of available data from the Massim. Another possibility is a migration by Papuan (non-Austronesian)-speaking groups into the region from further inland (Allen Reference Allen1977b, 38; Swadling Reference Swadling1981, 249). Certainly, at the time of European contact the coastal area around Port Moresby was occupied by communities of both the Austronesian speaking Motu and the Papuan-speaking Koita (Allen Reference Allen1977a; Reference Allen1977b).
Some evidence for a migration of inland Papuan speakers to the coast around this time is present at the Nebira sites. Nebira 4, an EPP site at the foot of Nebira Hill in the Port Moresby region, was abandoned during the Papuan Hiccup. Subsequent occupation at Nebira occurs further up the hill (Nebira 2; see Bulmer Reference Bulmer1978). In terms of the material culture the occupants of Nebira 2 can reasonably be distinguished from the EPP people and identified as Koita people, an interpretation of the site that fits well with oral tradition, for Nebira is known as Koma, the ancestral settlement of the eastern Koita (Allen Reference Allen1977a, 440; Bulmer Reference Bulmer1978, 121). Evidence from stable isotope analysis of skeletal remains from Nebira 2 burials also supports these local oral traditions, as the data parallels ethnographic reports of the diet of the Koita people (Kinaston et al. Reference Kinaston, Buckley, Gray, Shaw and Mandui2013).
Whatever the source, such a population movement may have caused the population of the Port Moresby region to grow beyond the capacity of the previous general economic systems (Allen Reference Allen1977b, 35). Faced with the prospect of reduced resources, Allen (ibid., 39) has argued that the predominant response along the south Papuan coast was for groups to extend their economic catchment areas by intensifying the specialised production of the local area and entering into trading arrangements with other similarly specialised groups of producers, as appears to be the case on Motupore Island.
Sue Bulmer’s Port Moresby region ceramic sequence
Amongst the most archaeologically apparent changes along the south coast at c. 1200 cal bp is the change in ceramic styles. Based on an examination of decorative techniques on sherds acquired during surface collections and excavations at sites across the Port Moresby region, Bulmer (Reference Bulmer1978) defined a number of different ceramic styles and three broad periods of prehistory based on ceramic style change (Table 2). The following discussion of Bulmer’s proposed ceramic sequence provides the basis for the subsequent critique of the Taurama site chronology.
Port Moresby Ceramic Styles (Bulmer Reference Bulmer1978)

Bulmer’s Style I ceramics are equivalent to EPP as defined above, and were in widespread use around the region in the 2nd millennium cal bp (Bulmer Reference Bulmer1978, 340). Subsequently, Bulmer (ibid., 378) suggested a ‘subdivision’ of the region for a period of time based on ceramic styles. She suggested a date for this of around 1000 cal bp, but subsequent work suggests this change occurred closer to 1200 cal bp (Allen Reference Allen2010). Styles II and III are considered by Bulmer (Reference Bulmer1971, 57–60; Reference Bulmer1978, 371–2) to be related to pottery from the Massim region to the east of Port Moresby, reflecting an introduction of people or ideas from that region. This style of pottery was common at Boera and the inland river communities at Nebira and Eriama, but only a small amount was found at Taurama to the south-east (Bulmer Reference Bulmer1978, 378). The dominant ceramic style in the Taurama area at this time was Style IV, which Bulmer (ibid., 319) suggests evolved locally from Style I. Style IV, perhaps further influenced by Styles II and III, then appears to have become the dominant style of ceramics in the Port Moresby region until the Proto-Historic period (c. 500–150 cal bp), when it may again have subdivided stylistically into Styles V and VI (Bulmer Reference Bulmer1978, 378).
In a recent re-appraisal of the ceramic sequences from the southern Papuan coast, Allen (Reference Allen2010) has rejected the contemporaneity of Bulmer’s Middle period ceramic Styles II, III, and IV, suggesting instead that the ceramic styles are sequential. In addition, Swadling (Reference Swadling1981, 242–3) identified aspects of stylistic continuity between late EPP and Styles II and III, which overturned previous ideas of a complete population replacement at this time.
Excavations at the site of Ava Garau, part of the large village complex established at Boera around 1200 cal bp, produced a long in situ sequence that appears to show that Styles II, III, and IV are not contemporary (Swadling Reference Swadling1981, 242; Allen Reference Allen2010, 9). Charcoal from the lowest level at Ava Garau produced a date of 1220±95 bp (SUA-515; Swadling & Kaiku Reference Swadling and Kaiku1980, 86) or 960–1300 cal bp (at 2σ error using Calib 6.1.0). The pottery at the beginning of the sequence matches Bulmer’s (Reference Bulmer1978) description of Styles II and III, while the pottery at the top of the sequence matches the description of Style IV (Swadling Reference Swadling1981, 242; Allen Reference Allen2010, 9). Style IV pottery is found in the earliest deposits on Motupore Island, dated to shortly after 800 cal bp (Allen Reference Allen1977a, 443; Reference Allen2010, table 1). There was subsequently a replacement of this shell-impressed and comb-decorated pottery by incised or stick impressed decoration (ie, Bulmer’s Style V) in the middle and late parts of the Motupore sequence (Allen Reference Allen1977a, 443). This evidence appears to support Allen’s (Reference Allen2010) suggestion of sequential ceramic styles.
TAURAMA
Kirra Beach is located near the western head of Bootless Inlet, 21 km south-east of Port Moresby. This area is remembered in the oral traditions of the Austronesian-speaking Western Motu people who, since European contact, have occupied much of the Port Moresby region coastline, as the site of their foundation village, Taurama (Oram Reference Oram1969, 426; Bulmer Reference Bulmer1978, 258). The Motu oral traditions also suggest that Taurama was settled from nearby Motupore Island (Oram Reference Oram1969, 426). These traditions are supported by the recording of archaeological materials that have been exposed along the beach, including shell middens, stone and shell artefacts, and pottery sherds since at least the 1960s (eg, Lampert Reference Lampert1969). Taurama was vacated prehistorically, ostensibly because of on-going warfare with villages to the east (Oram Reference Oram1969, 427).
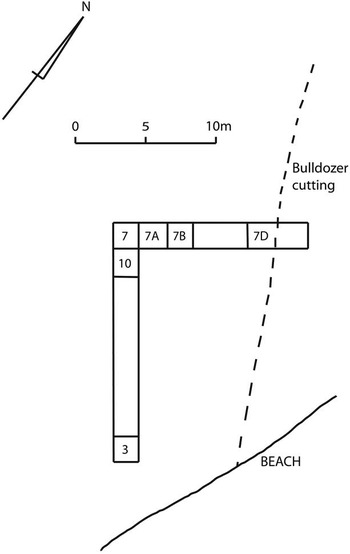
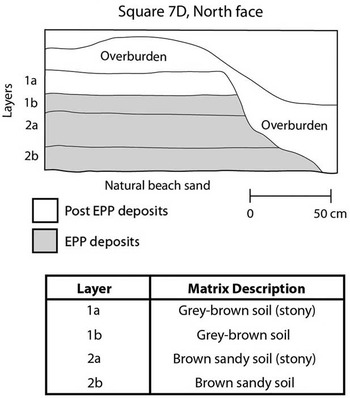
What appeared to be the main settlement area (AJA) at the south-western end of the beach was excavated by Sue Bulmer in 1972 (Fig. 2). The excavation was located there after a bulldozed bank of soil was found to contain a large number of ceramic sherds. It also seemed a likely area for evidence of houses to be found, being flat ground at the base of a hill, affording some protection from the elements (Bulmer Reference Bulmer1978, 265–6). Deposits at the site consisted of two soil horizons (Layers 1 & 2), both subdivided further into two sub-horizons (a & b) (Fig. 3). In both cases, these sub-horizons were differentiated by a noticeably higher amount of natural stone material in sub-horizon a.
Plan of excavations at site AJA (adapted from Bulmer Reference Bulmer1978, fig. 8.4)

Description of stratigraphic layers at Site AJA (adapted from Bulmer Reference Bulmer1978, fig. 8.5b & table 8.3)

The cultural deposits at AJA contain both EPP and later phases. This makes it a key site for understanding the changes that occurred at the end of the EPP. During the EPP occupation the pottery is reminiscent of the Oposisi and Nebira 4 sequences, and the presence of Fergusson Island obsidian indicates that Taurama was part of the larger interaction network in place along the southern Papuan coast during the EPP period.
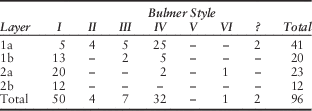
Pottery reminiscent of later (post-EPP) ceramic styles was also found at AJA. Bulmer’s Styles IV and V (Table 2) were the dominant post EPP styles at Taurama, with small numbers of sherds of Style II and III pottery interpreted as having been imported from elsewhere in the region (see above). Based on the stratified deposits of pottery at Taurama, Bulmer (Reference Bulmer1978, 322–3, 374) argued for continuity of occupation at Taurama from c. 2000 cal bp until c. 300 cal bp, with a local stylistic evolution of Style I (EPP) directly into Style IV, perhaps with some influence from imported pottery (Styles II & III). Table 3 gives the distribution of the excavated sherds from AJA attributed to a Bulmer ceramic style. As shown in Table 3, ceramic Style I is the dominant style in Layers 1b through 2b, whereas Style IV is the dominant style in Layer 1a. On this basis it is argued that Layers 2b, 2a, and 1b represent EPP occupation at Taurama and that Layer 1a represents post-EPP occupation. Bulmer (Reference Bulmer1978, 374) bases her argument for the local evolution of Style I into Style IV at Taurama on the general pattern of the application of Style I motifs to early examples of Style IV sherds (ie, those from Layer 1b). A problem with this argument is that it appears to require some ‘cherry-picking’. For example, Bulmer (Reference Bulmer1978, 308) attributes the minority presence of two Style IV sherds and one Style VI sherd in Layer 2a to disturbance by crab burrowing and post-hole digging, and the presence of five Style I sherds in Layer 1a to later garden digging of the upper soils. Yet the minority presence of Style IV sherds in Layer 1b is crucial to her argument and therefore taken as being in situ.
Distribution of Pottery Styles By Stratigraphic Layer At AJA (Adapted From Sue Bulmer’s Unpublished Fieldnotes)

Following Bulmer (Reference Bulmer1978) it is argued here that Layers 2b, 2a, and 1b represent EPP occupation at Taurama and that Layer 1a represents post-EPP occupation. However, on the basis of the Ava Garau findings outlined above, Bulmer’s argument for continuous occupation at Taurama is rejected here in preference of a break in occupation at Taurama around the time of the Papuan Hiccup. This argument is consistent with the presence of the relatively small number of Bulmer Style II and III sherds at AJA compared with Style IV, as the site was presumably not occupied for much of the period in which these earlier styles were in use. The presence of Styles II and III at the bottom of the Ava Garau sequence, with an associated date from charcoal of 1220±95 bp (SUA-515; Swadling & Kaiku Reference Swadling and Kaiku1980, 86) or 960–1300 cal bp (at 2σ error using Calib 6.1.0), shows these ceramics were present in the Port Moresby region by this time, so it is conceivable that a small number of vessels may have reached Taurama before its abandonment around the end of the EPP. The presence of early Motupore-like ceramics (Bulmer’s Style IV) at Taurama taken together with the oral traditions suggests that the area was re-occupied sometime shortly after 800 bp from Motupore Island. This is further confirmed by the presence in surface collections from the site of later Style V sherds, also present on Motupore Island, the decoration of which matches museum examples and ethnographic descriptions of Motu pottery (Bulmer Reference Bulmer1978, 91).
METHODOLOGY
The apparently highly disturbed nature of some of the squares at AJA meant that careful sampling of the site was required. On the basis of the information provided by Bulmer (Reference Bulmer1978), Square 7D (see Figure 2) was considered the least likely to have been disturbed by posthole and burial digging or bioturbation.
Technological analysis
A technological analysis of the chert artefact assemblage from Square 7D was conducted. A total of 779 lithics were analysed. Table 4 provides a breakdown of the assemblage across layers. Flakes were categorised as tools if they showed signs of probable retouch or usewear.
Composition of Flaked Chert Assemblage From Square 7D

It has been shown that stone tool manufacturing strategies are affected by the abundance and quality of the raw materials available (Andrefsky Reference Andrefsky1994a; Reference Andrefsky1994b). In areas where raw material is limited it is expected that use of high quality raw material will be maximised. Given this pattern, the intensity of reduction of chert cores taking place at Taurama could be used as a proxy indicator of changes in the availability of high quality chert. To investigate this further, the numbers of striking platforms and flaking directions on all cores from Square 7D were recorded, as these measures tend to increase as reduction proceeds (Clarkson & O’Connor Reference Clarkson and O’Connor2006, 183).
Characterisation analysis
From the 779 lithics analysed in the technological analysis, a sample of 81 was selected for characterisation analysis using portable X-Ray Fluorescence (pXRF). The sample comprised of 21 artefacts from Layer 1a and 20 artefacts each from Layers 1b, 2a, and 2b. The artefacts from each layer were chosen to incorporate the range of colours present with the intention to investigate whether colour provided evidence of different geological sources.
The term chert herein is used as an umbrella term, referring to a fairly heterogeneous group of sedimentary cryptocrystalline silicates and includes raw materials that may be referred to more specifically elsewhere as flint, agate, jasper, and chalcedony. These materials are composed mostly of silica and various impurities (Luedtke Reference Luedtke1978, 414). These impurities reflect local geologies, creating potential for the discrimination of chert outcrops. It has been demonstrated that chemical differences between chert outcrops are greater than those within outcrops (Ward & Smith Reference Ward and Smith1974; Luedtke Reference Luedtke1978; Reference Luedtke1979). Sourcing chert is difficult and properly requires extensive reference samples from different source locations, something unavailable at present. However, even without such samples, a chemical characterisation can allow the definition of groupings (called Chemical Compositional Reference Units – CCRUs), based on chemical similarity (see Allen et al. Reference Allen, Summerhayes, Mandui and Leavesley2011, 75). Knowing the number of chert sources in a site and the variation in their distributions through time can be useful in modelling social and economic interaction.
The current analysis used the Bruker AXS Tracer III-V portable Energy Dispersive XRF machine at the University of Otago’s Department of Anthropology and Archaeology. A potential problem that arises from the choice of a non-destructive surface analysis technique such as pXRF for the characterisation analysis is weathering on the surface of the chert artefacts. There is a risk that the concentration of some elements may be altered due to weathering (Sheppard & Pavlish Reference Sheppard and Pavlish1992). While weathering is a potential problem, the use of pXRF in the present study is justified on multiple grounds. The material analysed in the present study was on loan, so there was a need to use non-destructive methods of analysis. The Allen et al. (Reference Allen, Summerhayes, Mandui and Leavesley2011) analysis of chert from Oposisi used non-destructive PIXE-PIGME analysis and obtained encouraging results. In the present study, care was taken to use surfaces on which the effects of weathering appeared minimal. Care was also taken to use surfaces with as little curvature as possible to minimise the effects of surface morphology on the count rate.
Given the scarcity of chemical characterisation analyses using cherts, a range of elements were tested for in the current study. A pelletised USGS basalt standard (BHVO-2) was used as a control (McCoy & Athens Reference McCoy and Athens2012, 106) and run prior to each chert run. All samples were run twice on a 300 second count time – testing once for heavy elements and once for light elements. Settings for heavy elements (Mn, Fe, Rb, Sr, Y, and Zr) were 40 kV per channel, filament ADC=24 µA, with a filter (12mil Al + 1mil Ti + 6mil Cu). Settings for light elements (Na, Mg, Si, Al, K, and P) were 15kV per channel, filament ADC=45 µA, under a vacuum with no filter. A lab-specific linear regression was then applied for both settings to provide parts per million (ppm) concentrations. This linear regression was based on nine pelletised international standards (AGV-2, BCR-2, BHVO-2, BIR-1a, DNC-1a, GSP-2, QLO-1, SRM-278, W-2a), which were each shot three times for both settings.
RESULTS
Technological analysis
The Taurama assemblage is best described as a largely amorphous industry consisting of small flakes and cores. The predominant aspect is its small size. The mean weight of complete flakes in the assemblage (n=60) was 1.2 g. The mean length of the complete flakes, measured along the flaking axis from the point of percussion to the termination, was 16.4 mm. The flaking axis was conceptualised as an imaginary line that followed the force wave that flowed from the point of percussion to the distal end of the flake as the flake was struck from the core.
Since use of the term “microlithic” suggests the presence of geometric forms, that term has been avoided here, as it was by Allen (Reference Allen1972, 109) when describing the lithic assemblage at Nebira 4, because there were no true geometric forms present at Taurama. The Taurama assemblage is similar to the lithic assemblages previously described for the EPP sites Nebira 4 (Allen Reference Allen1972) and Oposisi (Allen et al. Reference Allen, Summerhayes, Mandui and Leavesley2011). Despite a change in ceramics as discussed above, the brief description provided here adequately describes the flaked chert assemblages associated with all phases of the Taurama sequence, which is suggestive of some degree of cultural continuity across all phases.
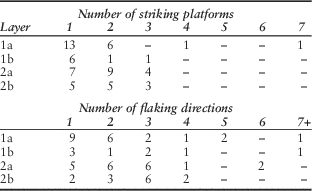
The assemblage contained 62 cores. The cores with the highest numbers of striking platforms and flaking directions tended to come from Layers 1a and 1b (Table 5).
Number of Striking Platforms and Flaking Directions on Cores by Stratigraphic Layer

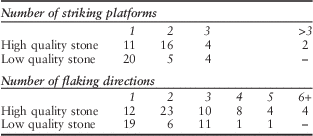
Visual inspection of the chert artefacts in the assemblage showed that they were of variable quality, with a large proportion exhibiting obvious flaws. Artefacts with obvious flaws were considered to be of low quality, the raw material being not as suitable for knapping as those without them. Cherts containing noticeable flaws are more difficult to work because their fracture pathways are less predictable. A general observation made during the analysis was that the cores with the greatest number of striking platforms and flaking directions tended to be of high quality raw material, without any obvious flaws (Table 6). It appears that cores of high quality material were being more intensively reduced in later periods of occupation to maximise use of the material, perhaps because there was less of it available.
Number of Striking Platforms and Flaking Directions on Cores By Raw Material Quality

Characterisation analysis
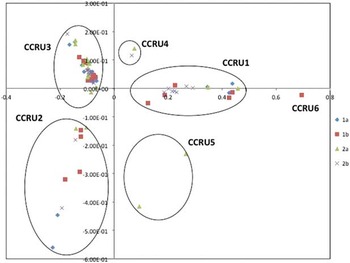
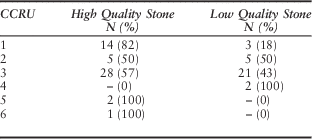
Parts per million (ppm) data included in the statistical analysis are available as a supplementary Appendix. Six plausible CCRUs were identified using Principal Components Analysis (Fig. 4). The distribution of the CCRUs according to stratigraphic layer is shown in Table 7.
Principal Components Analysis plot of cherts analysed using pXRF

Chert CCRUs by Stratigraphic Layer

The CCRU data indicates that during the period of post-EPP occupation of the site (Layer 1a) the number of chert sources exploited appears to have decreased relative to the EPP phase. One source, CCRU3, is the most heavily exploited across all layers. The proportion of chert coming from this group is highest (76%) in the sample from Layer 1a. This source may be local to Taurama, however this would need to be tested by geological survey, which is outside of the scope of the current study.
Attributing CCRUs to source is currently difficult due to a lack of geological samples available from the Port Moresby region. Geological observations in the area have noted the common occurrence of black and yellow lenticular nodules of chert (Glaessner Reference Glaessner1952, 65–6). Overall, this was the most common colour noted in the assemblage. In the pXRF sample 27 pieces were of this colour, 22 of which group into CCRU3. Overall, however, there do not appear to be any strong associations in the Taurama assemblage between colour and CCRU when the number of samples allocated to the CCRU is greater than two. In line with the results of the Allen et al. (Reference Allen, Summerhayes, Mandui and Leavesley2011, 77) study, this result makes evident the weakness of identifying chert sources on the basis of colour alone.
Table 8 presents an analysis of the pXRF sample according to CCRU and quality of the raw material (see discussion above). Of the total 49 pieces of chert in CCRU3, 21 (43%) were of low quality. If CCRU3 represents a non-local source it is expected that this proportion would be much lower, because the transportation of low quality material over long distances to the site would generally not have been cost effective. For all other CCRUs conclusions about source quality are extremely limited by small sample sizes, although the quality of CCRU1 (82%), and CCRU5 and CCRU6 (100%) is generally high. These groups may be amongst the most distant sources of chert being exploited at Taurama. CCRU5 and CCRU6 were not present in Layer 1a.
Pxrf Chert CCRUs According to Raw Material Quality

DISCUSSION
The results of the technological and chemical characterisation analysis of a sample of the flaked chert assemblage from Taurama are generally consistent with each other. Although the small size of the sample is acknowledged, and the conclusions drawn from the data must consequently be circumscribed, there is some support for the conclusion that the intensity of the reduction of chert cores from Taurama (as indicated by the numbers of striking platforms and flaking directions observed on the cores) increased over time at the site, with most of the most reduced cores coming from Layers 1a and 1b. In addition, although the cores in the assemblage were of highly variable quality, the most reduced cores tended to be of high quality raw material, without any obvious flaws.
As acknowledged above, sourcing chert is difficult and properly requires extensive reference samples from different source locations, something unavailable at present. However, even without such samples, a chemical characterisation can allow the definition of CCRUs. Knowing the number of chert sources in a site and the variation in their distributions through time can be useful for modelling social and economic interaction. The CCRU data indicates that the chemical variability of the chert artefacts at Taurama decreased following the Papuan Hiccup which suggests a decrease in the number of separate chert sources being exploited, and greater reliance on one particular source of chert (represented here by CCRU3), certainly of average quality and possibly representing a very local source.
It is generally considered that stone tool manufacturing strategies are affected by the abundance and quality of the raw materials available (Andrefsky Reference Andrefsky1994a; Reference Andrefsky1994b). When access to high quality raw material is restricted it is expected that use of the high quality material that is available will be more intensely reduced. This is a possible explanation for what is being observed at Taurama. The question then is what does this evidence for reduction in chert sources, and an increase in intensity of raw material use during the post-EPP period mean for our understanding of what is happening along the south coast of Papua New Guinea at this time. This is the first time that this type of analysis has been conducted with material from contexts straddling the Papuan Hiccup and the results certainly fit into the ‘bigger picture’ of what was happening along the south Papuan coast during this period, based on previous archaeological research in the region.
It has previously been suggested that a population build-up in the Port Moresby region during the Papuan Hiccup stretched the general economic systems of the EPP to the point of collapse (Allen Reference Allen1977b, 35). One possibility that has already been discussed is a migration by Papuan (non-Austronesian)-speaking groups into the region from further inland (ibid., 38; Swadling Reference Swadling1981, 249). Certainly, at the time of European contact the coastal area around Port Moresby was occupied by communities of both Austronesian-speaking Motu and the Papuan-speaking Koita (Allen Reference Allen1977a; Reference Allen1977b).
The hypothesised population build-up in the Port Moresby region may have effected changes in the number of sources available to the post-EPP inhabitants of Taurama in multiple ways. One possibility is a reduction in the scale of trade and exchange networks. Although ancient trade and exchange are often associated with rare and exotic valuable materials known to have restricted distributions (eg, obsidian, jade, and precious metals), most interaction would have involved the movement of more rudimentary materials or goods (Summerhayes Reference Summerhayes2015, 481). While chert is a fairly widely dispersed resource compared to obsidian, and most social units probably had direct access to a source (Sheppard Reference Sheppard1996, 101), the maintenance of social networks may have been regarded at least as important as the goods or materials moving between groups, just as they were in the hiri trade system (Oram Reference Oram1982, 17). If one of the main impetuses for the scale of interaction during the EPP phase was to maintain gene flow (Summerhayes & Allen Reference Summerhayes and Allen2007, 117), the population build up in the region during the Papuan Hiccup would certainly have reduced the need to look outside of the region for marriage partners. A long history of interaction ‘has undoubtedly moved the Koita “culturally” [and genetically] closer to the Motu than the Koiari, from whom they broke away’ (Swadling Reference Swadling1981, 249). This possibility is supported by the apparent collapse of the long distance EPP interaction networks, indicated by the absence of Fergusson Island obsidian in Port Moresby sites after c. 1200 bp (Allen et al. Reference Allen, Summerhayes, Mandui and Leavesley2011, 79), and the divergence of the widespread EPP style into multiple localised styles (Summerhayes & Allen Reference Summerhayes and Allen2007, 100). Smaller scale, more specialised, intra-regional networks probably replaced them (Allen Reference Allen1977a; Reference Allen1977b; Reference Allen1984; Reference Allen1985).
Although the similarity of locally made pottery at a number of EPP sites is consistent with the interaction hypothesis just outlined, it is also possible that chert was procured directly from the source. If this were the case, a population build-up was likely to have cut off access to some sources as new groups moved into the region and claimed ownership of surrounding land. A larger population may also have led to the quicker exhaustion of some of the higher quality chert sources.
Potential linkage to ENSO
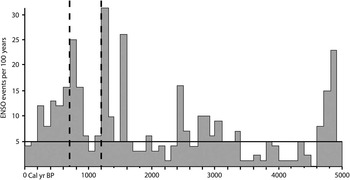
Environmental change has gained popularity as an explanation of system change in archaeology over the last 15 years (eg, Rowland Reference Rowland1999; deMenocal Reference deMenocal2001; Berglund Reference Berglund2003; Anderson et al. Reference Anderson, Chappell, Gagan and Grove2006; Turney & Hobbs Reference Turney and Hobbs2006; Nunn et al. Reference Nunn, Hunter-Anderson, Carson, Thomas, Ulm and Rowland2007; Sim & Wallis Reference Sim and Wallis2008; Allen Reference Allen2010; Field & Lape Reference Field and Lape2010; Wilmshurst et al. Reference Wilmshurst, Hunt, Lipo and Anderson2011; McNiven et al. Reference McNiven, De Maria, Weisler and Lewis2014). This represents a theoretical shift away from the previously dominant paradigm that saw humans as the principal agents of change in the mid–late Holocene (Rowland Reference Rowland1999, 12–13). The reason for this shift is the increased awareness and understanding of regional environmental variability during the mid–late Holocene and how this correlates with system changes in past societies. The strongest natural fluctuation of regional climate on interannual time scales is the El Niño-Southern Oscillation (ENSO) phenomenon (Specht et al. Reference Specht, Denham, Goff and Terrell2014, 95). ENSO events are associated with reduced sea-surface temperature (SST) and lower rainfall in the western Pacific and higher than normal SST and rainfall in the eastern Pacific (Chappell & Grove Reference Chappell and Grove2000). While there is still plenty to learn, research over the last decade suggests a marked increase in ENSO activity in the last 5000 years, which reaches an apex in the 2nd millennium cal bp and subsequently declines towards the present (Moy et al. Reference Moy, Seltzer, Rodbell and Anderson2002; Gagan et al. Reference Gagan, Hendy, Haberle and Hantoro2004; Conroy et al. Reference Conroy, Overpeck, Cole, Shanahan and Steinitz-Kannan2008). The model by Moy et al. (Reference Moy, Seltzer, Rodbell and Anderson2002) of ENSO activity is based on the sediment record from Laguna Pallcacocha in the Ecuadorian Andes. Their data are presented as the number of ENSO events in 100-year overlapping periods (Moy et al. Reference Moy, Seltzer, Rodbell and Anderson2002, fig. 1a). This graph has been reproduced in other papers (eg, Anderson et al. Reference Anderson, Chappell, Gagan and Grove2006, fig. 3; Allen Reference Allen2010, fig. 7) and is reproduced here as Figure 5. As can be seen, this model suggests that there have been three 100-year periods in the last 2000 years when 25 or more ENSO events occurred within the space of a century. Two of these three periods correspond with the proposed population shifts and ceramic sequence disruptions c. 1200 cal bp and c. 700 cal bp, suggesting that perhaps there is a link between cultural and climate change along the Papuan south coast (Allen Reference Allen2010, 13).
Frequency of ENSO events per 100-year intervals. The dotted lines at 700 cal bp and 1200 cal bp indicate sequence disruptions discussed in text. The solid horizontal line denotes the minimum number of events in a 100-year window needed to produce ENSO band variance. This model was originally published by Moy et al. (Reference Moy, Seltzer, Rodbell and Anderson2002); this version of the model is adapted from Allen (Reference Allen2010).

The Port Moresby environment
The size and topography of the island of New Guinea is sufficient to produce significant local variations in climate. The Port Moresby region is the driest part of the island; annual rainfalls of less than 1000 ml are unknown, except in this region (McAlpine et al. Reference McAlpine, Keig and Falls1983, 2). Although only 9° south of the equator, the predominant cover is savannah grassland, rather than the tropical rainforests found elsewhere along the coast (Allen Reference Allen1984, 415). Climate in the Port Moresby region is controlled primarily by two alternating wind systems. The majority of the region’s low rainfall occurs during the north-westly monsoon season from December through to April (Allen Reference Allen2010, 11). During this season, mean weekly rainfall generally exceeds evaporation, but for the remainder of the year, when cooler and drier south-easterly trade winds predominate, the reverse is the case (McAlpine et al. Reference McAlpine, Keig and Falls1983, 135, fig. 8.1), resulting in the regular occurrence of droughts ‘of such a nature as to severely limit the potential for agricultural production without irrigation’ (McAlpine et al. Reference McAlpine, Keig and Falls1983, 137). This data indicates that the food quest of the inhabitants of the Port Moresby region is particularly susceptible to fluctuations of regional climate.
In 1997–8 a particularly severe ENSO event was felt in Papua New Guinea, bringing widespread drought conditions, increased fires, crop failures and food shortages, and drying up of local water sources (Bourke Reference Bourke2000). Between April and October 1997, the Port Moresby region received about 70% less rainfall than the long term mean for this period (Bourke Reference Bourke2000, 151) which, as has been shown, is already associated with the regular occurrence of drought conditions. The hypothesised coastward migration by the ancestors of the Papuan-speaking Koita people c. 1200 cal bp may have been driven by a reduction in the carrying capacity of their territories.
The establishment and subsequent abandonment of most of a vast village complex in the Boera area may be better understood in light of the environmental fluctuations noted in Figure 5. The area, close to the Caution Bay area where Lapita communities had resided up to almost a thousand years earlier, was probably at least partly favoured because of its proximity to fishing grounds reputed to be the richest along the central south Papuan coast (Swadling Reference Swadling1981, 245). The rarity of mid–late Motupore-like wares (Bulmer’s Style V ceramics) at Boera suggests that this area had been largely abandoned early on in the Motupore sequence (Swadling Reference Swadling1981, 245). This could be related to a decline in the fecundity of the fishing grounds after 800 cal bp. Significant impact on marine ecology and a reduction of available subsistence resources has been linked to ENSO events (Hawkins et al. Reference Hawkins, Roberts and Clark2000; Jaksic Reference Jaksic2001; Stenseth et al. Reference Stenseth, Mysterud, Ottersen, Hurrell, Chan and Lima2002; Swales et al. Reference Swales, Storey, Roderick and Figa1999). The maintained ENSO band variance for the following 500–600 years indicated in Figure 5 (a period covering the length of occupation of Motupore Island) might have been a contributing factor to the over-exploitation of marine resources that Allen (Reference Allen1985) hypothesised drove the subsequent development of specialised production on Motupore Island as a means of accessing inland resources.
If this correlation between climate and culture change is so, why is there no apparent system disruption in Port Moresby around 1500 cal bp, during the third century of high ENSO frequencies noted in Figure 5? Here we may look at possible evidence for ENSO influence from the sites of Taurama and Oposisi.
There are interesting parallels between the chemical characterisation results reported from Taurama and Oposisi (Allen et al. Reference Allen, Summerhayes, Mandui and Leavesley2011). At Oposisi, the highest chemical variability in chert samples is evident at the beginning of the occupation sequence c. 2000 cal bp. There is also a subsequent peak in the variability of the cherts sampled from Oposisi Layer 2A (Allen et al. Reference Allen, Summerhayes, Mandui and Leavesley2011, table 7). Charcoal from Layer 2A at Oposisi produced a radiocarbon date of 1639±30 bp (Wk-21612; Allen et al. Reference Allen, Summerhayes, Mandui and Leavesley2011, table 3) or 1418–1622 cal bp (at 2σ error using Calpal).
At Taurama, the pXRF sample of cherts from Layer 2a shows the highest chemical variability (Table 3). Unfortunately there are no associated radiocarbon dates reported for this layer. Given these results, a mid-EPP period of particularly high mobility or interaction in the Port Moresby and Yule Island regions cannot be ruled out.
As already noted, the fluctuations in climate associated with severe ENSO events even today have the potential to significantly impact the food quest in the Port Moresby region of Papua New Guinea. Extrapolating back into prehistory there is certainly no reason to doubt that such events could have severely impacted populations as well. In such situations the social networks maintained by ongoing interaction are essential strategies for coping with potential disaster (Specht et al. Reference Specht, Denham, Goff and Terrell2014).
As well as the observation of an increase in chemical variability in cherts c. 1420–1620 cal bp (2σ), Allen et al. (Reference Allen, Summerhayes, Mandui and Leavesley2011, 77) noted a major increase in chert volume at Oposisi compared with lower layers. As already noted, this material must have been coming from the New Guinea mainland. At Taurama, Layer 2a, where the pXRF analysis indicated the highest chemical variability, also contains the highest number of flakes and cores (Bulmer Reference Bulmer1978, fig. 8.16). It is assumed that there would have been a corresponding increase in perishable (food) resources arriving at the site, of which little trace could be expected in the archaeological record.
While the proposed scenario is informed by an awareness of contemporaneous environmental fluctuations, if it is correct this was an example of established social systems coming into effect to counter the impact of environmental change on a society. This example acts as a warning to archaeologists against the adoption of overly simplistic ‘environmentally deterministic’ models for explaining system change.
It has been suggested that the marked changes to interaction or mobility around 1200 cal bp can be related to the apparent population build up along the coast at this time. Why did not a similar population movement occur c. 1500 cal bp? It is possible that a large-scale population relocation from further inland did occur around this time. David (Reference David2008) identified a major pulse of intensive prehistoric occupation in the Kikori River region in the Gulf of Papua beginning c. 1450 cal bp. At this point the first evidence of village (as opposed to cave or rockshelter site) occupation, and the first evidence of a sustained human presence in the region, appears in the archaeological record (David Reference David2008, 468).
CONCLUSION
The data from Taurama has for the first time allowed a study of changes in mobility or interaction before and after the Papuan Hiccup of 1200–800 cal bp. This was not possible at Oposisi, as occupation appears to have finished there by 1200 cal bp. The data from Taurama shows an apparent decrease in the scale of mobility or interaction post-Papuan Hiccup. This is consistent with previous data and models regarding the nature of the Papuan Hiccup in the Port Moresby region. A period of high mobility or interaction dated to c. 1500 cal bp at Oposisi may also be evident at Taurama and may be causally related to a contemporaneous period of high ENSO activity.
ACKNOWLEDGEMENTS
Susan Bulmer and her family kindly made the Taurama assemblage available for study. Sue, along with the likes of Jim Allen, Brian Egloff, Geoff Irwin and Ron Vanderwal, was one of the pioneers of South Papuan archaeology, who by the late 1970s had made the prehistoric sequence of this region perhaps the best known in Melanesia. A current refocus on the region is building upon that pioneering work. All unpublished drawings and notes are reproduced with Sue’s permission. We also thank two anonymous reviewers for feedback on drafts of the article, and acknowledge the editorial direction provided by Julie Gardiner.
ONLINE SUPPLEMENTARY APPENDIX
Chert ppm data – To view supplementary material for this article, please visit http://dx.doi.org/10.1017/ppr.2015.14.