Introduction
Salinity is one of the predominant abiotic stresses that adversely affect plant growth and productivity. It reduces agricultural crop production, particularly in arid and semi-arid areas (Royo and Abio Reference Royo and Abió2003; Seleiman et al., Reference Seleiman, Aslam, Alhammad, Hassan, Maqbool, Chattha and Battaglia2022). Soil salinity has intensified due to unsustainable irrigation practices, saline groundwater intrusion and rising oceanic tides, posing a serious challenge to global food security and reducing arable land (Ganie et al., Reference Ganie, Dey and Mondal2016). Currently, approximately 20% of irrigated lands worldwide are affected by salinity, significantly limiting food security (Okon OG, 2019). Projections suggest that by 2050, this figure could rise drastically, further threatening global food systems (Shrivastava and Kumar, Reference Shrivastava and Kumar2015).
Salt stress induces multiple physiological disruptions, including osmotic stress, ion toxicity and oxidative damage, which compromise plant growth and development (Parihar et al., Reference Parihar, Singh, Singh, Singh and Prasad2015). Salinity exposure affects early growth stages by reducing germination percentage (GP), seedling emergence and root-shoot elongation (Akbarimoghaddam et al., Reference Akbarimoghaddam, Galavi, Ghanbari and Panjehkeh2011; Vibhuti et al., Reference Vibhuti, Bargali and Bargali2015). Poor germination can lead to poor crop establishment in the field, limiting the crops’ ability to cope with environmental stress (Finch-Savage and Bassel, Reference Finch-Savage and Bassel2016). Plants grown under salt stress experience Na+ and Cl− ion toxicity, suffer from nutrient imbalances and endure physiologically dry soil conditions (Arif et al., Reference Arif, Singh, Siddiqui, Bajguz and Hayat2020). Salinity-induced ionic stress causes premature leaf senescence and ultimately causes plant death (Hussain et al., Reference Hussain, Zhang, Chen, Li, Hussain, Altaf, Chen and Dai2024). The net photosynthetic rate, net CO2 assimilation rate, transpiration rate and stomatal conductance were also significantly affected in different crops under saline conditions (Arfan et al., Reference Arfan, Athar and Ashraf2007). A significant decrease in the absorption of essential elements due to a decrease in osmotic pressure has been observed as a secondary effect of salinity on plant growth (Cantabella et al., Reference Cantabella, Piqueras, Acosta-Motos, Bernal-Vicente, Hernández and Díaz-Vivancos2017). Furthermore, the disturbed homeostasis in plants triggers an oxidative burst, which leads to the accumulation of reactive oxygen species (ROS), and the imbalance between ROS accumulation and scavenging leads to disturbed metabolism in plants (Parihar et al., Reference Parihar, Singh, Singh, Singh and Prasad2015).
Given the increasing impact of salinity on global agriculture, there is an urgent need to develop salt-tolerant crop varieties. Out of the various known approaches for improving crop productivity in saline environments and mitigating the negative effects of salinity on crop growth and yield, the development of salt-resistant cultivars through molecular or traditional breeding is considered one of the most effective due to its long-term benefits (Ledesma et al., Reference Ledesma, Lopez, Ortiz, Chen, Korth, Ishibashi, Zeng, Orazaly and Florez‐Palacios2016). Therefore, breeding tolerant genotypes remains a crucial approach to combat salt stress, enabling breeders to develop genotypes that are better adapted to saline soils (Oyiga et al., Reference Oyiga, Sharma, Shen, Baum, Ogbonnaya, Léon and Ballvora2016). However, systematic screening of different varieties for salt tolerance is essential to identifying superior genotypes for breeding programs (Shelke et al., Reference Shelke, Nikalje, Suprasanna, Rajwade and Bhargava2017).
Wheat, the world’s second most important cereal, is a major primary food source globally. Data from 2023 suggest that global wheat production was approximately 783 million metric tons, which suggests its importance as a staple crop that meets global food demands and calls for maintaining the production even under conditions of stress (Food and Agriculture Organization of the United Nations, 2023). Due to climate change and environmental variability, abiotic stresses such as soil salinity have intensified globally, necessitating urgent efforts to develop resistant wheat varieties. Different wheat genotypes differ in response to salinity; hence, evaluating cultivars released for cultivation in a region for their tolerance is the first step to identify the varieties that can be recommended for cultivation in affected areas (Ashraf et al., Reference Ashraf, ESMA, Gheith and Suleiman2015). A few salt-tolerant bread wheat genotypes have been identified to date, such as KRL 210 and PBW 803. KRL-210, a commercial salt-tolerant wheat cultivar developed at Central Soil Salinity Research Institute, Karnal, India, has the yield potential of 3–5 tonnes/ha in soil with pH 9.3 and electrical conductivity (EC) up to 6 dS · m−1 (Sheoran et al., Reference Sheoran, Kumar, Sharma, Prajapat, Kumar, Barman, Raju, Kumar, Dar, Singh and Sanwal2021). PBW 803, developed by Punjab Agricultural University (PAU), Ludhiana, India, is specifically bred for cultivation in saline soils. This variety is known for its superior adaptability and performance under salinity stress. Furthermore, PBW 725, also developed by PAU, serves as a salt-sensitive genotype, providing critical insights for comparative studies in salinity tolerance (Kumar and Kaur, Reference Kumar and Kaur2022).
Another wheat genotype, Berbet, has gained popularity among farmers due to its adaptability to marginal environments and has demonstrated potential for cultivation in salinity-stressed areas but remains highly vulnerable to stripe and leaf rust, leading to reduced yield. The rust-resistant genes Lr57/yr40 were introgressed in the Berbet background (unpublished) using marker-assisted selection at PAU. Therefore, the present study aimed to test the salt tolerance ability of 78 introgression lines of variety Berbet under laboratory as well as field conditions and compare them against known salt-tolerant varieties in order to screen high-performing Berbet cultivars. This will enable their effective utilization in breeding programs aimed at developing rust-resistant, salt-tolerant Berbet cultivars, ensuring stable wheat yields under saline conditions.
Materials and methods
Plant material
Seeds of wheat variety Berbet and its introgression lines (Berbet lines having gene Lr57/yr40, referred to as Berbet-ILs) and relevant commercial cultivars (Berbet, KRL 210, PBW 803 and PBW 725) were procured from the Department of Plant Breeding and Genetics, PAU, Ludhiana. The Berbet-ILs were developed by the Department of Plant Breeding and Genetics, PAU, Ludhiana, through marker-assisted selection, where rust-resistant genes were introgressed into the Berbet background using donor lines, such as PBW 820, BWL 6293 and BWL 6846, and were advanced to F5 generation. These lines were designed to combine rust resistance with desirable agronomic traits, forming the basis of evaluating their salt tolerance in this study. A total number of 82 lines (78 Berbet-ILs and 4 cultivars including Berbet, KRL 210, PBW 803 and PBW 725) were used in this study.
Seedling evaluation
The seedling stage was evaluated at PAU, Ludhiana, under controlled conditions. Seeds were surface sterilised with 0.1% mercuric chloride (HgCl2) solution for 2–3 minutes, followed by rinsing with autoclaved distilled water three times, and then air dried. On moist, sterile germination paper, 20 seeds of each line were planted (Choudhary et al., Reference Choudhary, Kaur, Sharma and Kumar2021). The papers were rolled, placed in bins and allowed to germinate. For stress conditions, the seeds were treated with saline water (150 mM NaCl) and compared to seeds treated with double-distilled water as a control. The seedlings were raised in under controlled conditions of a plant growth chamber (16-h light/8-h dark photoperiod, temperature 25°C [±2°C] and 80% relative humidity). The experiment was organized in a complete randomized design in three replications. Twelve-day-old seedlings were evaluated for various morpho-physiological traits.
GP was recorded at 12 days after sowing as follow:
 \begin{align*}& {\text{Germination Percentage}} \nonumber\\
&\quad = \frac{{{\text{Total number of seeds germinated}}}}{{{\text{Total no}}{\text{. of seeds sown}}}} \times 100\end{align*}
A seed was considered germinated when plumule and radicle emerged and were >2 mm long.
Root length (RL) and shoot length (SL) were measured at 12 days using a centimetre scale for 20 seedlings from each replicate. Root fresh weight (RFW) and shoot fresh weight (SFW) were recorded in grams using a weighing balance. For shoot dry weight (SDW) and root dry weight (RDW), the root and shoot were oven dried for 3 days, and then their biomass was noted in grams. Vigour index I (VI I) and vigour index II (VI II) were calculated using the following formulae (Abdul-Baki and Anderson, Reference Abdul-Baki and Anderson1973):
 \begin{align*}{\text{Vigour Index (I)}} &= {\text{Seeding length (cm)}}\nonumber\\&\quad \times {\text{Germination Percentage (\%)}}\end{align*}
 \begin{align*}{\text{Vigour Index (II)}} &= {\text{Seeding dry weight (g)}} \nonumber\\
&\quad \times {\text{Germination Percentage (\%)}}\end{align*}
Field evaluation under salt stress conditions
Berbet-IL’s and relevant cultivars were sown in the field during the 2020–21 and 2021–22 seasons at the Regional Research Station (30°11ʹ8″ N latitude and 74°56ʹ52″ E longitude), Bathinda, Punjab, India. At Bathinda, saline plots have been maintained for the last 10 years by regularly irrigating the plots with tubewell water (TW) having EC of 3.8–4.2 dS · m−1, and residual sodium content (RSC) of 1.42 meql−1, which enhances soil salinity (salt stress). In control, the seeds were sown in plot, which has been irrigated with canal water (CW) having EC of 0.3–0.4 dS · m−1 and RSC of 0.3 meql−1. The soil had a sandy loam texture, with saline plots having a pH 8.2 ± 0.2 and organic matter content of 0.5 ± 0.1%, while control plots had a pH of 7.6 ± 0.1 and organic matter content of 0.8 ± 0.1%. Seeds were sown with 30 cm row spacing, and crops were managed following the “Standard Package of Practices” by PAU, Ludhiana (Kumar and Kaur, Reference Kumar and Kaur2022).
The total leaf chlorophyll content was measured as the SPAD value of flag leaves of tagged plants at 10 days after anthesis (DAA), 20 DAA and 30 DAA using the Soil Plant Analysis Development (SPAD) meter (Minolta SPAD 502 Plus). Readings were taken from the upper, middle and lower parts of the leaf, and the mean was recorded. At maturity, agronomic and physiological traits were evaluated from three randomly tagged plants per treatment in each replication. Days to flowering (DTF) were recorded as the time when 50% of spikes showed anther extrusion, while physiological maturity (days to maturity, DTM) was noted when 50% of plants reached maturity. Plant height (PH) was measured from the ground to the tip of the spike (excluding awns) using a meter scale, and the average was expressed in centimetres. Yield attributes were assessed from the same tagged plants: spikelets per spike (SPS) and grains per spike (GPS) were counted, while 1000-grain weight (TGW) and grain yield (GY) were determined by threshing and weighing grains, with results recorded in grams. Harvest index (HI) was calculated using the following formula:
 \begin{equation*}{\text{Harvest index}} = \frac{{{\text{Grain yield}}}}{{{\text{Biological yield}}}} \times 100\end{equation*}
Biological yield represents the weight of unthreshed plants.
Statistical analysis
The data were evaluated using two-way analysis of variance (ANOVA) in SAS software version 9.4 (SAS Institute, NC, USA) (SAS 2013). The analysis of data aimed to find variation (P ≤ 0.01) among lines and between treatments (control and salt stress) at confidence level 1% and 5%. Tukey’s HSD test was used for post hoc comparisons.
The Salt Tolerance Index (STI) was calculated according to (Ali et al., Reference Ali, Salam, Azhar and Khan2007) using the formula:
 \begin{equation*}{\text{STI}} = \frac{{{\text{Value of trait under stressed condition}}}}{{{\text{Value of trait under controlled condition}}}}\end{equation*}
Pearson’s correlation analysis was conducted using the psych package (Revelle, Reference Revelle2023), and visualizations were generated using the corrplot package (Wei and Simko, Reference Wei and Simko2021) in RStudio (Posit Workbench, Version 2023.09.0+463) with R 4.3.1 (R Core Team, 2023).
The STI was further assessed using the membership function value (MFV) based on the fuzzy comprehensive evaluation method. The MFV for salt tolerance was determined using the equation proposed by Chen et al. (Reference Chen, Min, Yasir and Hu2012) and Ding et al. (Reference Ding, Yang, Wei, Yuan, Yin and Wang2018):
 \begin{equation*}{X_i} = \frac{{X - {X_{\min }}}}{{{X_{\max }} - {X_{\min }}}} \times 100\end{equation*}
where Xi is the MFV corresponding to the STI for a given line, X is the actual calculated value of STI for a given line, X max is the maximum STI value observed across all lines and X min is the minimum STI value observed across all lines.
The average MFV for each trait was computed, ranging from 0 (lowest tolerance) to 1 (highest tolerance). Higher MFV values indicated greater salt tolerance. Genotypes were classified into five categories – highly salt-tolerant (HST), salt-tolerant (ST), moderately salt-tolerant (MST), salt-sensitive (SS) and highly salt-sensitive (HSS) – based on mean MFV values for each cluster. Hierarchical cluster analysis (HCA) was performed in RStudio (Version 2023.06.0+421, “Mountain Hydrangea”) to establish these categories.
Results
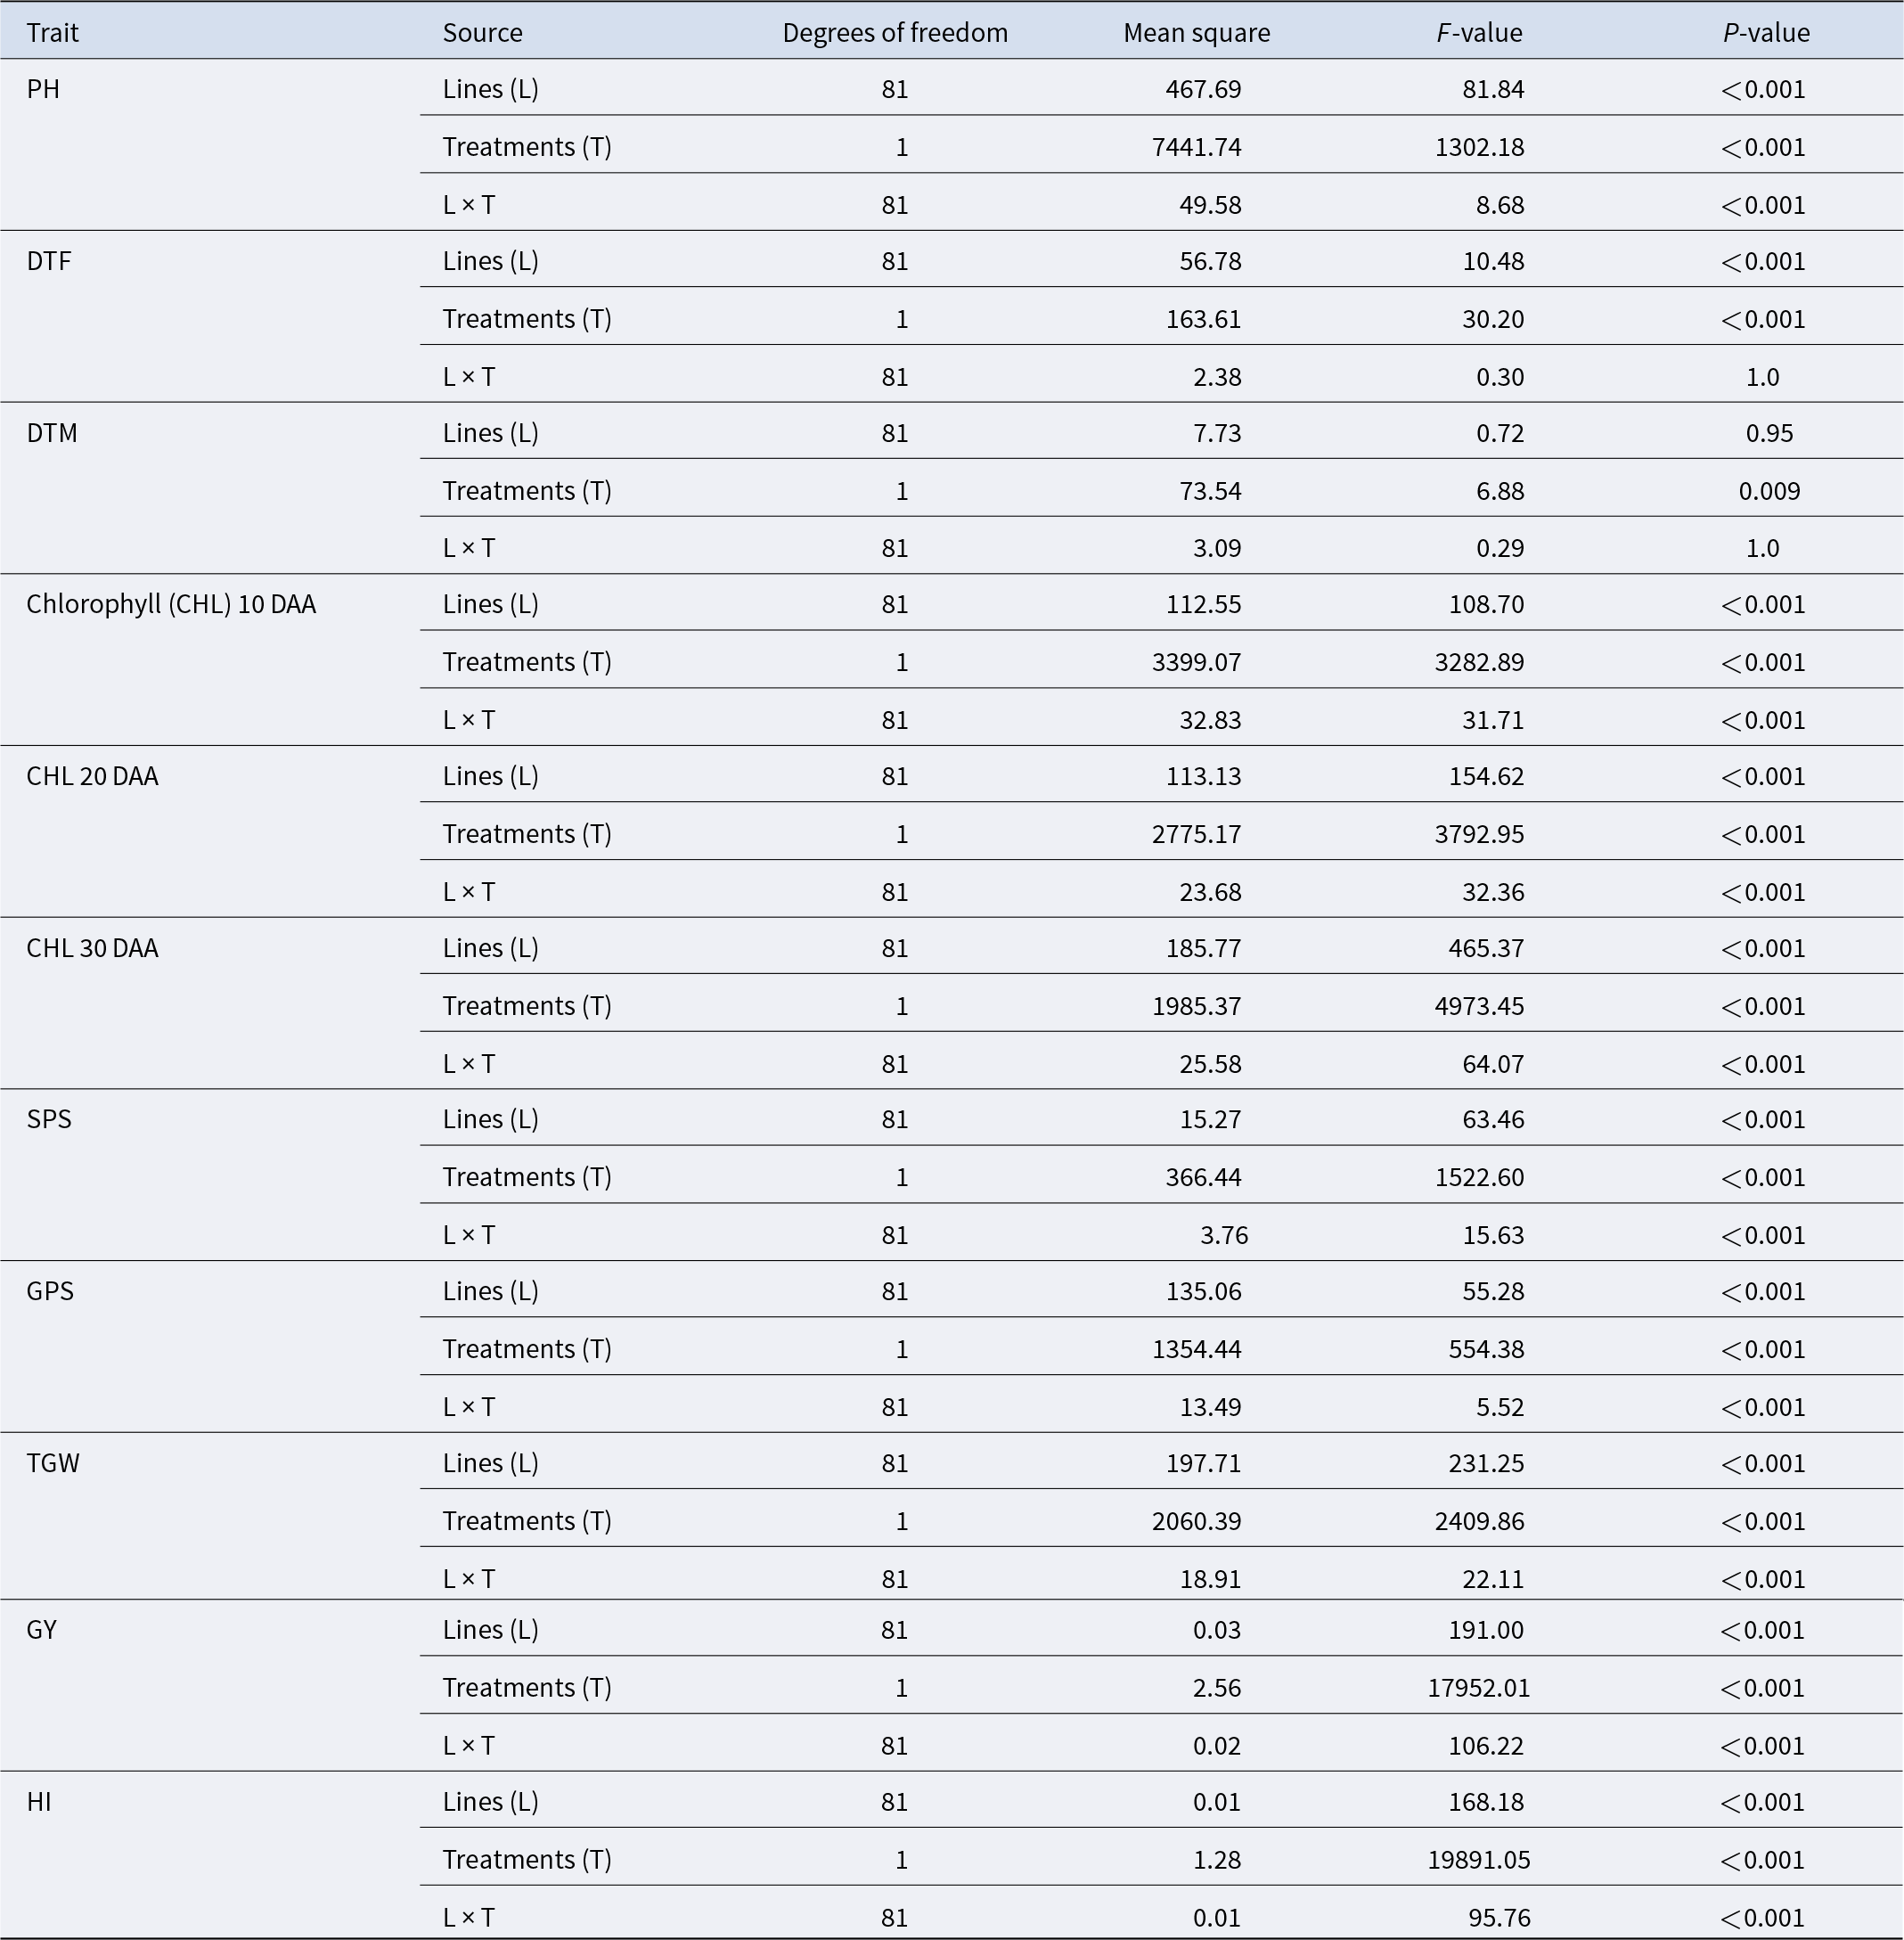
Significant variation in morpho-physiological and agronomical traits was observed in the wheat germplasm set (Tables 1 and 3). ANOVA indicated strong effects of lines (L) and treatments (T) across all traits (P < 0.001), except for DTM (P = 0.95). Treatment effects were significant for all traits. Line × treatment interactions (L × T) were significant for most traits (P < 0.001) but non-significant for DTF and DTM (P = 1.0)
Analysis of variance of morpho-physiological traits in seedlings of Berbet-ILs and selected wheat cultivars raised under control and saline conditions in the laboratory environment

Statistical significance: P < 0.05 (significant), P < 0.01 (highly significant), P < 0.001 (very highly significant). P ≥ 0.05 indicates no significant difference.
Effect of salt stress on percent germination and seedling traits
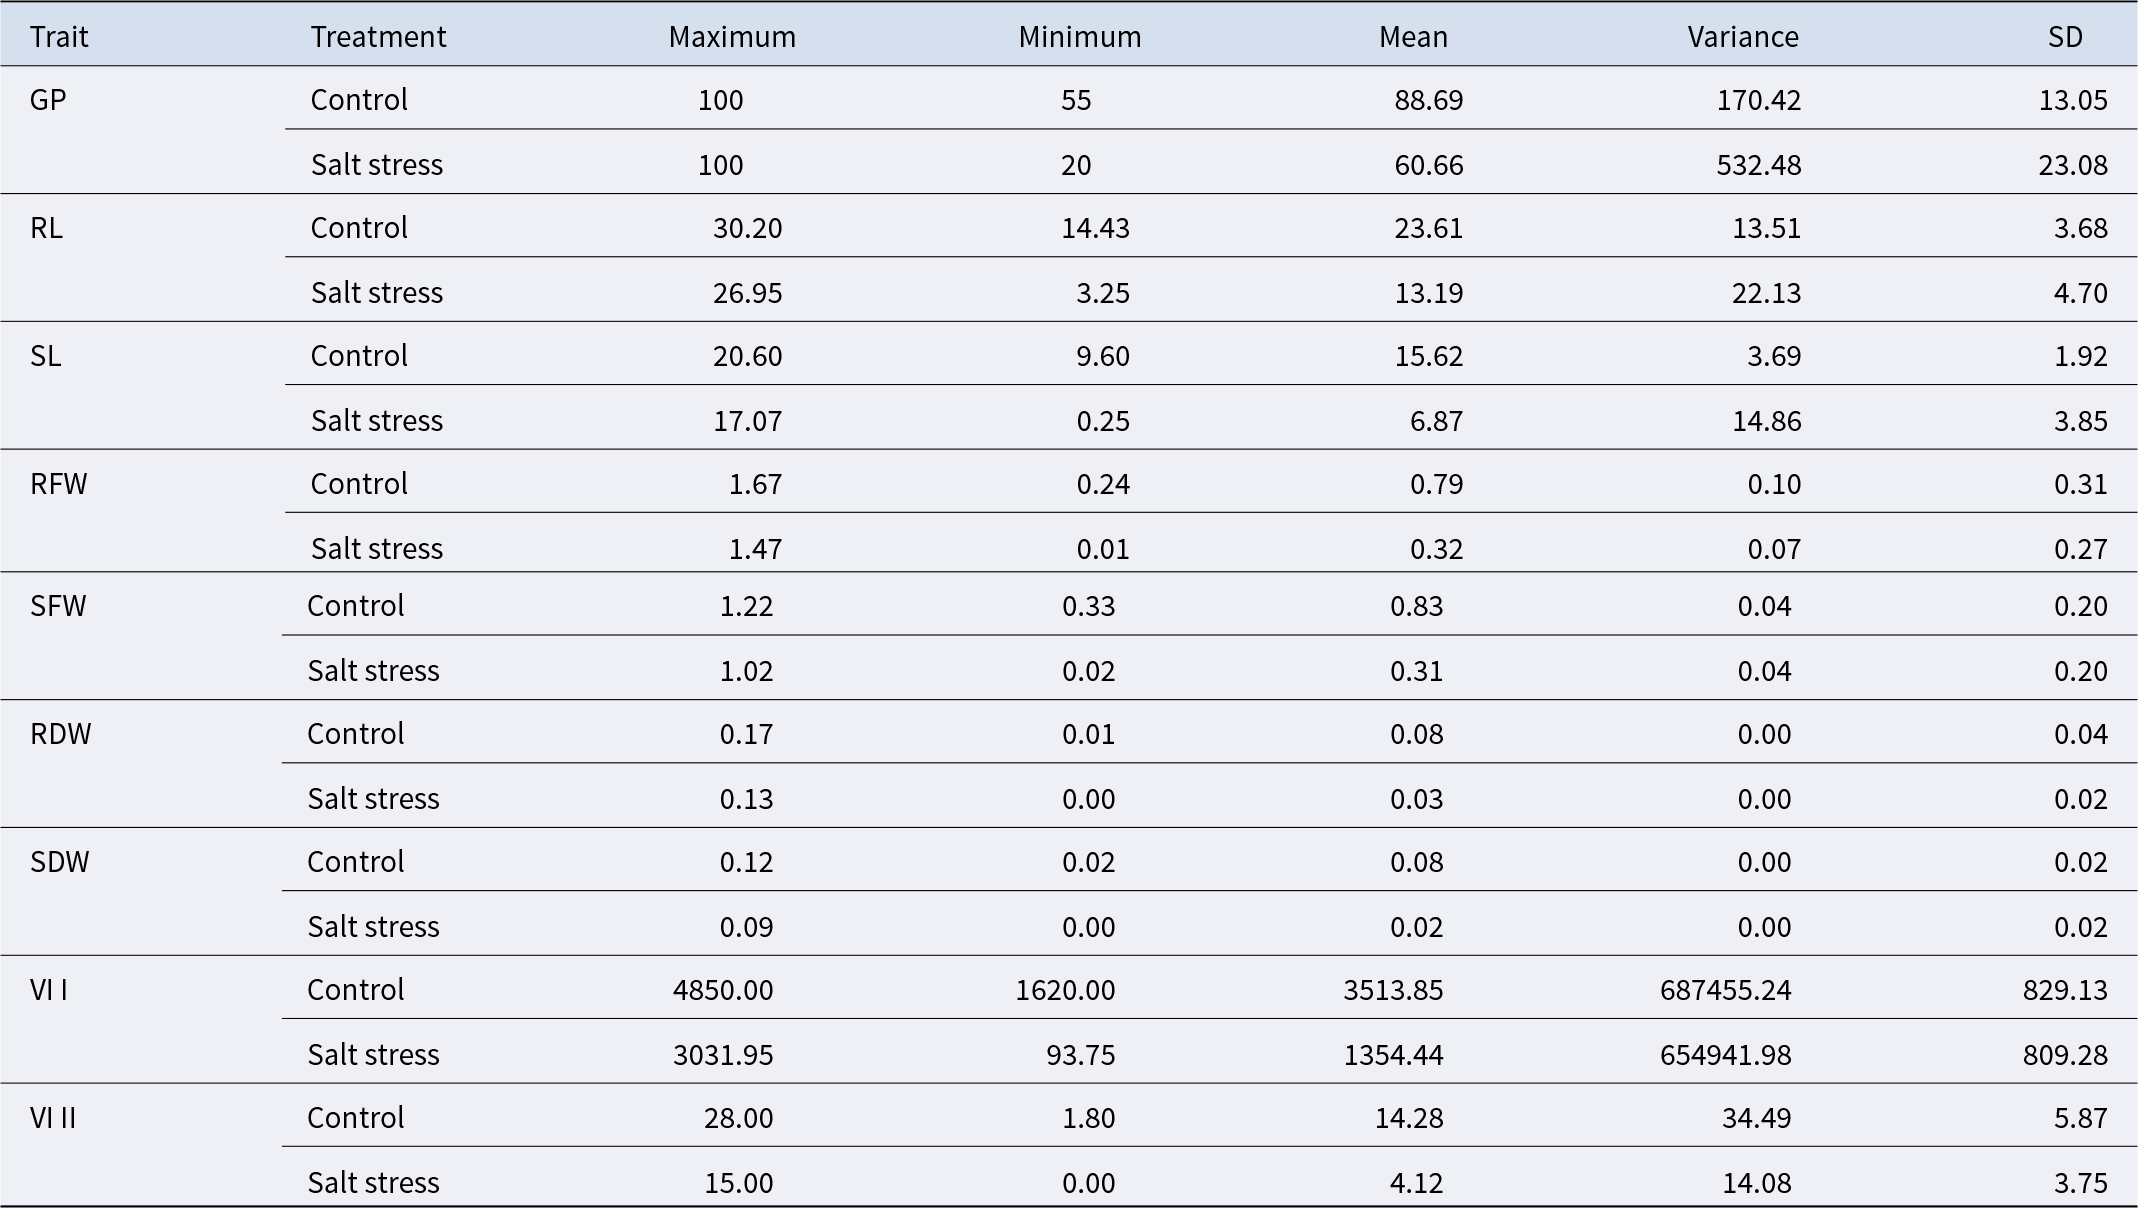
Germination percentage varied from 55% to 100% in different lines and cultivars under control conditions, with an average of 88.56%. Under salt stress, it ranged from 20% to 100%, with an average of 60.49% (Table 2). Lines L46-48, L50 and L78 showed 100% germination under salt stress. The minimum percent germination (20%) was recorded in lines L19, L21, L23 and L25. Among the cultivars, PBW 803 exhibited the highest germination rate (85%), followed by KRL 210 (80%). PBW 725 had the lowest (60%) under saline conditions (Supplementary Table S1).
Summary statistics of morpho-physiological traits in seedlings of Berbet-ILs and selected wheat cultivars raised under control and saline conditions in the laboratory environment

Seedlings exhibited a significant reduction in RL and SL. RL ranged from 14.43 to 30.2 cm with an average value of 23.60 cm under control, and 3.25 to 26.95 cm with an average value of 13.69 cm under salt stress (Table 2). Similarly, SL varied from 0.25 to 17.07 cm under saline conditions. On average, RL and SL declined by 42% and 56.55%, respectively (Table 2). Line L1 exhibited high salt tolerance, with only 12.44% and 15.67% reductions in RL and SL, respectively. In contrast, L44 showed the greatest reduction, with 80.71% and 95.02% reductions in RL and SL, respectively. Among cultivars, PBW 803 exhibited minimal reductions in SL (17.32%) and RL (25%), while PBW 725 showed the highest decline (54.07% in RL and 52.33% in SL) (Supplementary Table S1). Similarly, there was significant reduction in SFW, SDW, RFW and RDW under salt stress conditions. The RFW and SFW ranged from 0.01 to 1.06 g and 0.02 to 0.9 g, respectively, under salt stress (Table 2). L1, L6, L8–L10, L47 and L72 lines showed meagre effect on RFW and SFW (>10%) under saline conditions. Among cultivars, PBW 803 and KRL 210 showed maximum seedling fresh weight (RFW and SFW), while PBW 725 showed minimum seedling weight. The RDW and SDW varied from 0.01 to 0.17 g and 0 to 0.13 g, respectively, in control, and ranged from 0 to 0.17 g and 0 to 0.13 g, respectively, under salt stress (Table 2). Lines L1 and L44 were least affected by salinity, whereas L10, L6, L78 and L48 showed only 16% reductions in dry weight. The average RDW decreased by 61.73% (from 0.08 to 0.03 g), and SDW decreased by 58.27% (from 0.08 to 0.02 g) under saline conditions (Supplementary Table S3).
Salt stress caused a significant reduction in VI I and VI II. Seedling VI I and VI II varied from 1620 to 4850 and 93.75 to 3031.95, respectively, in control and ranged from 1.80 to 28 and 0 to 15, respectively, under salt stress (Table 2). Maximum reduction in VI I was observed in L21 (95.67%), L19 (95.25%) and L44 (93.16%), whereas L6 showed the smallest reduction (27%). PBW 803 exhibited the least decline in VI I (33.22%), while PBW 725 showed the highest (72%).
Effect of salt stress on SPAD value, phenological and agronomical traits
Chlorophyll content (SPAD values) at 10, 20 and 30 DAA showed significant variation. Under control conditions, the mean SPAD values were 45.36 at 10 DAA, 35.05 at 20 DAA and 29.84 at 30 DAA, while under salt stress, they were 39.71 at 10 DAA, 26.04 at 20 DAA and 21.73 at 30 DAA (Table 4). The SPAD values ranged from 38.70 to 52.85 at 10 DAA, 18.97 to 48.57 at 20 DAA and 11.85 to 37.46 at 30 DAA in control conditions. Under salt stress, the range varied from 25.35 to 49.80 at 10 DAA, 18.83 to 42.50 at 20 DAA and 10.86 to 30.57 at 30 DAA. SPAD values significantly decreased at 10 DAA (7.03%) and 30 DAA (16.66%), but the reduction was non-significant at 20 DAA (2.8%) (Table 3). L27 and L76 exhibited the greatest SPAD reduction (50%), while L17 and L78 showed minimal decreases (≤10%). Among cultivars, PBW 803 had the highest SPAD values, followed by KRL 210 and Berbet, while PBW 725 had the lowest (Supplementary Table S5).
Analysis of variance for SPAD values and agronomic traits of Berbet-ILs and selected wheat cultivars under control (canal water, CW) and saline field (tubewell water, TW) conditions

Statistical significance: P < 0.05 (significant), P < 0.01 (highly significant), P < 0.001 (very highly significant). P ≥ 0.05 indicates no significant difference.
Summary statistics of SPAD value and agronomical traits of Berbet-ILs and selected wheat cultivars under control (canal water, CW) and saline field (tubewell water, TW) conditions

DTF of plants in Berbet-ILs and cultivars in saline soil is represented in Table 4. In control, lines L1 and L78 took maximum days (100 days) to flowering, and L16–L18 took minimum days (89 days) to flowering. In saline soil, the plants flower earlier in comparison with plants grown in control, which might be to escape stress. Wheat lines grown in saline soil flowered 3 days earlier from 97 days in control to 94 days in saline soil. A similar trend was observed in days taken to maturity by plants. The plants grown in saline soil took less time to mature. DTM varied from 128 to 131 days in control, and 123 to 129 days in saline soil (Table 4). Thirty-four lines exhibited earlier maturity, while lines L1, L10, L18, L27–L28, L44–L47 and L78 took more time to mature in saline soil. Among the cultivars, Berbet matured the earliest (126 days), followed by PBW 725 (123 days). In contrast, the salt-tolerant cultivars PBW 8023 and KRL 210 took 128 days to mature (Supplementary Table S5).
ANOVA showed significant differences for PH among lines and cultivars in response to TW irrigation used for creating salinity stress in field (Table 3). PH ranged from 74.85 to 120 cm with an average value of 101.01 cm grown in field irrigated with CW, and 73.50 to 115.25 cm with a mean value of 96.03 cm in TW-irrigated field (Table 4). On average, PH reduced by 4.9%, from 101.01 cm in control to 96.3 cm in saline soil. Lines L1, L10, L37, L46, L47, L57 and L77–L78 exhibited minimal reduction (about 1%) in PH under saline conditions, which was comparable to the salt-tolerant cultivar PBW 803 (Supplementary Table S4). The number of SPS and GPS ranged from 15.5 to 24.0 and 48.30 to 76, respectively, in soil with EC = 0.3–0.4 dS · m−1 and 12.3 to 22 and 44 to 69.30, respectively, in soil with EC = 3.8–4.2 dS · m−1 (Table 4). The number of SPS and GPS decreased significantly under salt stress, with a significant interaction effect indicating different tolerance levels among lines (Table 3). In the majority of lines, the SPS and GPS were unaffected or showed minimal reduction under the saline stress. L1, L6, L10, L13, L53, L45, L47 and L72 showed minimal reductions, comparable to PBW 803 (<1%). The largest reductions were observed in L14 (30.51% SPS, 18.52% GPS) and L42 (29.17% SPS, 18.31% GPS) (Supplementary Table S6).
TGW varied from 26.03 to 55.53 g with a mean value of 39.69 g in CW-irrigated soil and 23.13 to 53.17 g with a mean value of 34.66 g in saline soil (EC 3.8–4.2 dS · m−1). In saline soil, the TGW was reduced by 14.29% from 39.06 g in control to 34.66 g in saline soil (Table 4). Lines L6, L14, L78, L22 and L11 exhibited the highest TGW in saline soil, whereas L13 had the lowest. Among cultivars, PBW 803 had the highest TGW in saline soil. The mean values of GY and HI are represented in Table 4. GY ranged from 0.72 to 0.32 and 0.23 to 0.53 in control and saline soil, respectively. A significant decline in GY was observed under saline soil. L45 exhibited no decrease in GY under saline conditions, whereas L65, L28, L53, L29 and L13 had reductions exceeding 50%. Cultivar PBW 803 exhibited maximum GY in saline soil, and only a 30% decline was observed compared to control soil (Supplementary Table S6). Mean HI values were 0.34 (control) and 0.23 (saline soil). The highest HI under saline conditions was recorded in Berbet, L45 and L47, while a significant reduction was observed in plants grown in plots irrigated with TW.
Correlation analysis
Pearson’s correlation analysis was conducted to explore relationships among seedling traits under both control and saline conditions (Fig. 1). Pearson’s correlation results highlighted a positive correlation across the STI of all traits. The STI of VI I displayed a strong positive correlation with GP (r = 0.88), SL (r = 0.72) and RL (r = 0.71). The STI of RFW (r = 0.3) and RDW (r = 0.2), however, showed weak correlations with SL. VI II correlated positively with the STIs of SFW (r = 0.81), SDW (r = 0.76), RFW (r = 0.68) and RDW (r = 0.6). Further analysis was also conducted to probe the associations between agronomical traits (Fig. 2). A very strong positive correlation (r = 0.89) emerged between STI of GY and HI. The STI of GY correlated strongly with the STI of SPS (r = 0.82), and moderately with the STIs of TGW (r = 0.73), GPS (r = 0.63) and PH (r = 0.5). A correlation of r = 0.57 was observed between the STI of DTM and the STI of DTF. The least pronounced positive correlation occurred between the STI of TGW and the STI of GPS (r = 0.024), while a negligible negative correlation was noted between the STI of PH and the STI of GPS (r = − 0.085).
Heat map illustrating the correlation of Stress Tolerance Index (STI) values for RL- Root Length, SL- Shoot Length, GP- Germination Percentage, VI I- Vigour Index I, VII I- Vigour Index II, RFW- Root Fresh Weight, SFW- Shoot Fresh Weight, RDW- Root Dry Weight and SDW- Shoot Dry Weight of Berbet-ILs and selected wheat cultivars under control and saline conditions raised in laboratory conditions.

Heatmap illustrating the correlation of Stress Tolerance Index (STI) values PH- Plant Height, DTF- Days to Flowering, DTM- Days to Maturity, SPS- Spikelet Per Spike, GPS- Grain Per Spike, TGW- Thousand Grain Weight, GY- Grain Yield and HI- Harvest Index of Berbet-ILs and selected wheat cultivars under control (Canal Water) and saline (Tubewell Water) field conditions.

Cluster analysis
Cluster analysis was used to find the genotypes that are similar or homogenous among each other. The MFV of each parameter and the mean MFV were determined. The HCA was evaluated using the complete linkage method. HCA was performed by using the data recorded under both laboratory (Fig. 3) and field conditions (Fig. 4). Based on the means of MFV, each dendrogram was divided into five subgroups (HSS, SS, MST, ST and HST) under both conditions. Based on clusters, 33 HST, 20 ST, 2 MST, 8 SS and 20 HSS genotypes were recognised under lab conditions, while 18 HST, 28 ST, 17 MST, 5 SS and 15 HSS were identified under field conditions. The mean MFV value for HST ranged from 0.85 to 0.77; for ST it was from 0.76 to 0.65; for MST from 0.64 to 0.48; for SS from 0.18 to 0.34; and for HSS from 0.074 to 0.16 for both conditions.
Hierarchical clustering based on the furthest neighbour to determine the salt tolerance potential of Berbet-ILs as well as cultivars of wheat at seedling stage under controlled conditions in laboratory.

Hierarchical clustering based on the furthest neighbor to determine the salt tolerance potential of Berbet-ILs and selected wheat cultivars under control (Canal Water) and saline (Tubewell Water) field conditions.

Discussion
Salt stress tolerance is a complex biological phenomenon influenced by various physiological and genetic factors (Ali et al., Reference Ali, Salam, Azhar and Khan2007; Mehta et al., Reference Mehta, Muthusamy, Singh and Sharma2021). Salinity affects wheat growth from the early seedling stage to yield reduction at maturity (Balandrán-Quintana et al., Reference Balandrán-Quintana, Mercado-Ruiz and Mendoza Wilson2015; Marchenkova et al., Reference Marchenkova, Davydova, Chaidar, Orlova, Kazachenko, Gracheva and Shirokolava2017). In the present study, Berbet introgression lines (Berbet-ILs) were evaluated for salt tolerance at both the seedling stage under laboratory conditions and the adult plant stage in the field. The seedlings were screened based on the parameters studied like GP, SL, RL, SFW, SDW, RDW, VI I and VI II. Based on preliminary trials, 150 mM NaCl was identified as the optimal screening concentration. Choudhary et al. (Reference Choudhary, Kaur, Sharma and Kumar2021) also evaluated elite wheat germplasm for salt tolerance at the seedling phase and identified a similar NaCl concentration as optimal for inducing stress in wheat. Choudhary et al. (Reference Choudhary, Kaur, Sharma and Kumar2021) reported significant genetic diversity in wheat germplasm across growth stages, with salinity negatively affecting all traits. Similarly, the present study found that genetically diverse Berbet-ILs exhibited varied responses to salt stress, confirming previous findings on substantial genotypic variability in wheat’s salinity tolerance (Ehtaiwesh et al., Reference Ehtaiwesh, Sunoj, Djanaguiraman and Prasad2024; Patwa et al., Reference Patwa, Pandey, Gupta, Yadav, Meena, Ram and Singh2024).
Germination is a critical stage in plant establishment, as poor germination can compromise crop stand and reduce GY. The results of the present study indicated a significant decline in GP with increasing osmotic stress, which can be attributed to hindered water uptake and subsequent growth retardation (Tarchoun et al., Reference Tarchoun, Saadaoui, Mezghani, Pavli, Falleh and Petropoulos2022). Many studies on salt tolerance in crops have focused predominantly on GP, which considered salt to have a detrimental impact on GP (Badridze et al., Reference Badridze, Weidner, Asch and Börner2009; Kononenko et al., Reference Kononenko, Dilovarova, Kanavsky, Lebedev, Baranova and Fedoreeva2019; Mubushar et al., Reference Mubushar, El-Hendawy, Tahir, Alotaibi, Mohammed, Refay and Tola2022). The results of GP in the present study helped in screening certain resilient lines, such as L46–L48, L50 and L78, which achieved 100% GP even under salt stress. This suggests that these genotypes possess adaptive mechanisms, such as enhanced α-amylase activity and improved water uptake, which are crucial for seed germination under saline conditions (Silva et al., Reference Silva, Araújo, Silva, Amaro, Dias and Dias2019; Lu and Fricke, Reference Lu and Fricke2023).
Increased salinity has been shown to inhibit seedling growth, due to disruptions in cell division and elongation (Byrt et al., Reference Byrt, Munns, Burton, Gilliham and Wege2018). Variations in RL and SL under saline conditions suggest the deleterious impact of salinity on growth (Reddy et al., Reference Reddy, Kim, Yoon, Kim and Kwon2017). Genotypes like L1 demonstrated minimum reduction in SL and RL, suggesting that it might possess mechanisms to alleviate the impediments to root and shoot elongation posed by salinity (Panta et al., Reference Panta, Flowers, Lane, Doyle, Haros and Shabala2014).
Another imperative factor of salt tolerance is biomass accumulation; less the reduction in biomass, more the tolerance ability (Zhao et al., Reference Zhao, Gao, Zhang, Zhang, Zheng, Rong and Zhao2021; Majeed et al., Reference Majeed, Ismail, Al-Burki, Abed and Al Jibouri2022; Olimjonova et al., Reference Olimjonova, Djabbarov and Sobirov2024). Salinity-induced osmotic stress often reduces SFW, RFW, RDW and SDW due to diminished soil water potential, causing reduced plant turgidity (Tao et al., Reference Tao, Ding, Li, Zhu, Guo and Zhu2021). In this study, genotypes L1, L6, L8–L10, L44, L47 and L74 exhibited minimal reductions in biomass, performing comparably to known salt-tolerant cultivars. These findings align with research showing variability in biomass retention under salt stress (Olimjonova et al., Reference Olimjonova, Djabbarov and Sobirov2024). While the reduction in SDW and SFW in other lines grown in salt aligns with the study of Ghazaryan and Harutyunyan et al. (Reference Ghazaryan, Harutyunyan, Khachatryan, Singh, Minkina, Rajput and Movsesyan2023), Mahboob et al. (Reference Mahboob, Rizwan and Irfan2023), Hussain et al. (Reference Hussain, Khan, Anjum, Masood and Khan2021) and Zeeshan et al. (Reference Zeeshan, Lu, Sehar, Holford and Wu2020), the reduction in biomass is primarily due to stomatal closure limiting photosynthesis (Wang et al., Reference Wang, Li, Wei, Li, Zuo and Liu2019) and disruptions in metabolic pathways (Ibrahimova et al., Reference Ibrahimova, Zivcak, Gasparovic and Rastogi2021). Elevated salt levels can also induce nutrient imbalances, affecting growth (Shabala and Cuin, Reference Shabala and Cuin2008).
The interactions between genotype, environment and their effects on agronomical traits highlight the complexity of plant responses to salinity and other environmental stresses (Munns and Tester, Reference Munns and Tester2008). This complexity underscores the challenges faced in breeding, as genotypic performance can vary across environments (Blum et al., Reference Blum, Klueva and Nguyen2001). The observed earlier flowering in L8, L17, L35, L64 and L74 under saline conditions, deviating by 3 days from the control, might be an adaptive response, allowing plants to avoid the detrimental effects of prolonged salt exposure as observed in tomato plants (Sun et al., Reference Sun, Wang, Liu, Fang, Sun, Bao and Ma2024). Reduced DTM in L60 helped in screening it to be salt susceptible, as genotypes allocate most of their resources to coping with stress and completing their life cycle before the onset of stress (Blum et al., Reference Blum, Klueva and Nguyen2001). Such adaptive responses have been noted in crops facing diverse stressors such as drought, heat and salinity (Shavrukov et al., Reference Shavrukov, Kurishbayev, Jatayev, Shvidchenko, Zotova, Koekemoer, De Groot, Soole and Langridge2017). The decline in SPAD values as indicated in some lines is an indirect measure of chlorophyll content, from 10 to 30 DAA in both environments, which affirms the sensitivity of photosynthetic machinery to salinity (Shah et al., Reference Shah, Houborg and McCabe2017). Therefore, the lines with the maximum decline in the SPAD value were screened as salinity susceptible lines in the present study. Salinity stress impacts chlorophyll by lowering its concentration and affecting the entire process of photosynthesis (Taïbi et al., Reference Taïbi, Taïbi, Abderrahim, Ennajah, Belkhodja and Mulet2016). This reduction could arise from altered chlorophyll synthesis, increased degradation due to salt-induced chlorophyllase activity or a decrease in leaf area crucial for photosynthesis (Xu et al., Reference Xu, This, Pausch, Vonhof, Coburn, Comstock and McCouch2009; Abdel Latef et al., Reference Abdel Latef, Abu Alhmad, Kordrostami, Abae and Zakir2020). The stable SPAD values at 20 DAA suggest a possible short-term adaptive or acclimation phase against salt stress, as observed in recent studies (Afsar et al., Reference Afsar, Bibi, Ahmad, Bilal, Naqvi, Baig, Shah, Huang and Hussain2020; Afzal et al., Reference Afzal, Alghamdi, Migdadi, El-Harty and Alghamdi2022).
The reduction in PH under saline conditions observed in this study aligns with literature findings, emphasizing the inhibitory effect of salinity on vegetative growth due to osmotic and ionic imbalances (Saddiq et al., Reference Saddiq, Iqbal, Hafeez, Ibrahim and Raza2021). Reduced height was observed in L11 and L18, while L1, L10, L37, L46, L47, L57 and L77–L78 maintained higher PH under salt stress, likely due to better biomass accumulation (Zeeshan et al., 2019). Similar reductions in PH due to salinity have been documented in brinjal (Solanum melongena L.), broad beans (Vicia faba L.) and rice (Oryza sativa L.) (Puvanitha and Mahendran, Reference Puvanitha and Mahendran2017; Ayub et al., Reference Ayub, Mehmood, Hayat, Shahzad and Ahmad2020; Abdel Latef et al., Reference Abdel Latef, Tahjib-Ul-Arif and Rhaman2021).
Selection for wheat based solely on GY is relatively simple yet unsuccessful. Therefore, wheat breeders must determine the factors contributing to GY (Zarei et al., Reference Zarei, Cheghamirza and Farshadfar2013). GY is a complex trait influenced by SPS, GPS and TGW, making these key indicators for selection under salinity stress (Moustafa et al., Reference Moustafa, Ali, Kamara, Awad, Hassanin and Mansour2021). Salinity reduced spike and seed numbers, reflecting the negative impact on reproductive structures (Seleiman et al., Reference Seleiman, Aslam, Alhammad, Hassan, Maqbool, Chattha and Battaglia2022). In salt-sensitive lines like L13, significant decreases in TGW highlight the sensitivity of the grain-filling process to salinity, driven by reduced photosynthesis, nutrient imbalances and hormonal disturbances (Tavakkoli et al., Reference Tavakkoli, Rengasamy and McDonald2010; El Sabagh et al., Reference El Sabagh, Islam, Skalicky, Raza, Singh, Hossain and Hossain2021). The significant reductions in GY and HI in some lines in the present study under saline conditions align with research showing salinity’s detrimental effects on GYs, attributed to compromised photosynthesis, respiration and nutrient uptake (Farooq et al., Reference Farooq, Hussain, Wakeel and Siddique2015). The positive correlations between various traits under salt stress, particularly the strong association between GY and other agronomic traits, are invaluable for breeding programs. Such correlations can guide marker-assisted selection of specific markers linked to salt tolerance in wheat. (Czyczyło-Mysza et al., Reference Czyczyło-Mysza, Tyrka, Marcińska, Skrzypek, Karbarz, Dziurka, Hura, Dziurka and Quarrie2013)
The mean MFV, a quantitative classification technique, is widely utilized for ranking salt tolerance across genotypes. Ding et al. (Reference Ding, Yang, Wei, Yuan, Yin and Wang2018) classified 300 sweet sorghum germplasms into four salt tolerance groups, while Hu et al. (Reference Hu, Wu, You, He and Qian2018) identified 88 salt-tolerant Brassica napus cultivars. This study used MFV to categorize wheat genotypes based on tolerance at both seedling and adult stages. This study used MFV to categorize wheat genotypes into five groups –HST, ST, MST, SS and HSS – at both seedling and adult stages under laboratory and field conditions. Notably, wheat lines exhibiting stable tolerance across environments are strong candidates for further biochemical and physiological investigations to elucidate adaptive mechanisms. These promising genotypes should be considered as donor parents for breeding programs focused on improving wheat’s salinity tolerance.
Conclusions
Newly developed Berbet-ILs were evaluated for salt tolerance at both seedling and adult plant stages. The adverse effects of salt stress were evident under both laboratory and field conditions. The genotypes exhibited varying levels of tolerance due to their genetic makeup and environmental factors. This study suggests that seedling screening can be effectively used for the rapid selection of salt-tolerant wheat genotypes, which were further validated in field conditions. Lines L1, L6, L10, L45, L47, L72, L76, L77 and L79 consistently exhibited salt tolerance comparable to established salt-tolerant cultivars PBW 803 and KRL 210. These salt-tolerant genotypes should be further examined for their biochemical and physiological responses to stress and can serve as donor parents in wheat breeding programs aimed at enhancing salinity tolerance.
Supplementary material
The supplementary material for this article can be found at https://doi.org/10.1017/S1479262125000115.
Acknowledgements
I appreciate the collaborative efforts of my co-authors and the guidance of my supervisor in bringing this research to fruition.
Author contributions
A.S. and P.G. conceived and designed the research. P.S. conducted the experiments, collected and analysed the data. A.S. and P.G. helped in conducting the trial at Bathinda. P.S. and P.G. wrote the primary draft of the manuscript. P.G. and A.S. reviewed and improved the manuscript.
Funding statement
This research received no external funding.
Conflict of interest
The authors declare no conflict of interest.
Data availability
The data supporting the findings of this study are available from the corresponding author upon reasonable request.