
1. Introduction
The following report outlines the activities and funding of academic law libraries in the UK and Ireland in the academic year 2008/2009. The figures have been taken from the results of a postal questionnaire undertaken by Information Services staff at Cardiff University on behalf of the British and Irish Association of Law Librarians (BIALL).
This survey has been run on an annual basis since 1996 and reported in The Law Librarian and latterly in Legal Information Management. It is sponsored either by the Society of Legal Scholars (SLS) or by BIALL.
I shall attempt to draw comparisons with previous surveys where helpful. In particular “2008” refers to the 2007/2008 data (Clinch, Reference Clinch2009), “2007” refers to the 2006/2007 data (Clinch, Reference Clinch2008) and “2005” to the 2004/2005 data (Clinch, Reference Clinch2006). All the previous surveys referred to are referenced at the end of the report.
2. Methodology
The survey methodology followed the format of previous years. In January 2010 a questionnaire was dispatched to 111 institutions in the UK and Ireland, an increase of three in the number surveyed. These were two universities in the north of England and one in the Midlands which offered undergraduate law courses for the first time during 2008/2009. As in the past, research centres with no students or only small numbers of postgraduates where the main university law library was invited to respond to the survey, were excluded. For similar reasons, the Oxbridge college libraries were excluded but, as usual, responses from the Bodleian and Squire Law Libraries were invited. The text of the questionnaire was made available on the BIALL website at www.biall.org.uk.
3. Response rates
This year 92 forms were returned representing a response rate of 82.9%, a slight increase on last year's 82.4%, and only a little short of the record of 85.4%, set in 2003/2004. I am grateful to all those law librarians who took the time to respond. Unfortunately, there is a core of institutions which rarely if ever make a return – you know who you are! The return of the response rate to above 80% and to around record level is very welcome and should permit the presentation of a reasonably accurate picture of academic law libraries in the British Isles.
To help detect patterns in law library provision, the data have been analysed, as in previous years, by type of institution:
• “Old” universities incorporated before 1992
• “New” universities incorporated in or after 1992
• Institutes of higher education and other types of institution
Forty-six old universities responded (45 last year), as did 41 new universities (40 last year) and 5 other institutions (4 last year). The response profile has changed very little and ought not to have affected comparisons with past results.
4. Definitions
In many of the following sections, the survey responses are analysed using range, mean and median.
• The range indicates the smallest and the greatest value of the responses and helps us understand the diversity of responses.
• The mean has been calculated by adding up all the responses and dividing by the number of responses to get an “average”. The mean can be distorted by one or two responses which are very large or very small.
• The median is the mid-point and is calculated through ordering the responses by size from the smallest to the greatest and finding the middle response. There will be an equal number of responses below the median and above the median and so it provides a benchmark of what a “typical” university is doing.
All percentages from this point onwards have been rounded to the nearest whole number.
5. Student numbers
A representation of the number of law students served by the libraries helps in understanding the framework in which provision is made and can assist librarians in comparing their provision with institutions of similar sizes.
Respondents were asked to indicate the total number of taught course students (bodies, not FTEs) in the Law School enrolled on exempting undergraduate law degrees or professional or academic postgraduate courses in law. All ninety-two respondents gave figures for student numbers, ranging from 74 to 6,570 (40 to 6,968 in 2008). The median number of law students was 694 (702 in 2008). The mean number however was 902 (886 in 2008).
Respondents in old universities reported student numbers between 75 and 1,626 (40 to 2,002 last year), with a mean of 785 (782 last year) and a median of 717 (731 last year). In new universities, the range was 74 to 3,200 (95 to 2,730 last year), with a mean of 827 (last year: 765) and a median of 600 (last year: 586). Amongst the five other institutions, the number of students varied hugely as usual and included three small schools and the two largest law schools in the survey, with numbers ranging from 220 to 6,570. The mean was 2,581 and the median was 362, a decrease of 22% in the mean and a huge 88% fall in the median on last year.
Ninety or 98% of respondents (87 or 98% in 2008) offered an exempting undergraduate law degree. Thirty-four or 37% of respondents (30 or 34% in 2008) hosted the Legal Practice Course (LPC), Bar Vocational Course (BVC) or Diploma in Legal Practice (Scotland). This represents 24% of old university respondents, 51% of new universities and 40% of other institutions. Twenty-nine or 32% (26 or 29% in 2008) of respondents provided courses leading to other law professional awards, such as the Common Professional Examination or Institute of Legal Executives qualification. Fifteen percent of old universities, 46% of new universities and 60% of other institutions ran such courses. The final category was for other taught courses, such as LLM, which led to a postgraduate award in law. Eighty-two or 89% (80 or 90% in 2008) of institutions ran these postgraduate taught courses, including 94% of old and 88% of new universities and 60% other institutions.
The movements in the percentages of respondents offering particular courses this year, as compared with last year, are very small.
Respondents also indicated whether the law school enrolled students onto research courses, such as those leading to PhD and MPhil. Sixty-seven or 73% (67 or 75% in 2008) of institutions indicated that they did. Eighty-nine percent (2008: 91%) of old universities, 63% (2008: 65%) of new universities and 0% (2008: 0%) of other institutions had such students. Research students were not included in the count of law students detailed above.
In 2007 the figures indicated a 13% rise in institutions responding to the survey enrolling PhD and MPhil students, with the bulk of the increase occurring in old universities. This year, as in 2008, the figures have stabilised except for small decreases in the number of both old and new universities enrolling such students.
6. Location of the law library
Respondents were asked to indicate, from a list, which most closely matched the circumstances in their institution.
• 37% had a single law library in a location separated from other subject collections (30% in 2008). Of these, there were 24 (2008: 17) old universities, 9 (2008: 9) new and 1 (2008: 1) other institution.
• 33% had a law collection not so separated but shelved so as to form a single identifiable unit (39% in 2008). These included 15 (2008: 20) old universities, 13 (2008: 14) new and 2 (2008: 1) other institution.
• 23% had several law collections each in a different location (23% in 2008). These included 4 (2008: 6) old, 15 (2008: 12) new universities and 2 (2008: 2) other institutions.
• 8% had a law collection dispersed wholly or partly among other subject collections (8% in 2008). Of these, 3 (2008: 2) were old universities, 4 (2008: 5) were new universities and 0 (2008: 0) other institutions.
Fifty-two percent of old universities responding had a single and separate law library, while 22% of new universities and 22% of other institutions had a single and separate law library.
Thirty-three percent of old universities described their law collection as being shelved so as to form a single identifiable unit but not separate from other collections. Thirty-two percent of new universities described their law collection in a similar way, and 40% of other responding institutions.
Nine percent of old universities had several law collections, each in a different location, but 37% of new universities and two other institutions (40%) reported several collections. Last year, 13% of old universities and 30% of new universities and two higher education institutions had this arrangement. As in past surveys, the main reason for more than one law collection was the establishment of a separate library targeted at vocational course students, such as those on the LPC or BVC, in addition to a main law collection. Other respondents mentioned other reasons for separate locations: for module texts while main law materials are held elsewhere, for Asian materials regardless of subject and separate collections for graduate diploma students.
The comments to the SLS Statement of Standards 3.1 (Society of Legal Scholars, 2009) on space and physical facilities require "the housing of all relevant collections … as a unified whole in one place …" This year the figures suggest that this criterion was not met by at least the 8% of institutions reporting dispersed collections. Seven percent of old universities, 10% of new universities and 0% of higher education institutions had law collections wholly or partly dispersed among other subject collections. Last year the figure was also 8% of institutions overall; in detail, in 2008, 4% of old, 13% of new and 0% of other institutions had dispersed collections.
Although the general response profile for different types of institution has altered little between last year's and this year's surveys, the actual institutions responding are different and are the most likely reason for the changes noted.
7. Legal databases
Contrary to the rest of the questionnaire, respondents were asked to indicate their legal database subscriptions at the present time, rather than in the year 2008/2009. The results below therefore show the position in February 2010.
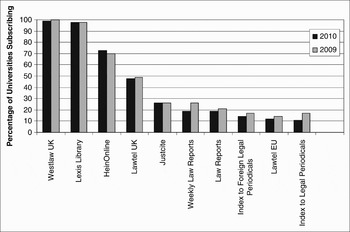
As in recent years, all respondents gave details of subscription databases used in connection with the teaching and research work of the law school. The ten most frequently mentioned law databases are displayed in the graph.
Top 10 legal databases

The law databases' academic market is still fluid but much less so than several years ago and about the same as last year. Only 11% of respondents (10% last year and 26% the year before) were planning new subscriptions before the end of July 2010 and 26% (24% last year and 30% the year before) noted planned or recent cancellations before the financial year end.
A small number of law databases continue to dominate the market. Westlaw UK was taken by every respondent bar one (99%) and Lexis®Library was taken by all bar two (98% of respondents). Last year Westlaw UK was taken by all respondents and Lexis®Library by all bar one (98%). HeinOnline retained its market position being taken by 67 or 73% of respondents, keeping the third position it gained in 2007. Lawtel UK held on to 4th place but with a slightly reduced percentage of respondents, with 44 or 48% of respondents (last year: 44 or 49% of respondents) taking the database.
Of the other databases mentioned by respondents falls were recorded by Justis Law Reports, Justis Weekly Reports, Index to Legal Periodicals and Index to Foreign Legal Periodicals. Justis English Reports held its ground, even though it is available free elsewhere. Justcite also remained stable in 5th position. Lawtel EU remained in the top ten, taken by 12% of respondents (2% down on 2009). European databases in general continue to show weakening demand this year.
Looking at the returns for Westlaw UK in more detail, one respondent reported plans to extend the coverage of their subscriptions in the year to July 2010. Three respondents (2008: 8) subscribed to Westlaw IE (Irish Law). All were based in the Irish Republic (2008: 4) but only two subscribed to Westlaw UK (2008: 8).
Respondents were asked to indicate the subscriptions they took to particular parts of the Lexis®Library product. Journals on Lexis®Library continued to be the most popular product, taken by 97% of respondents. Cases on Lexis®Library was second most popular, taken by 95% of respondents (2009: 83%). Third most popular Lexis®Library product was UK Parliament (Legislation) taken by 89% (2009: 79%), followed by International Materials, taken by 82% of respondents (2009: 80%). Halsbury's Laws was fifth, taken by 75% of respondents (2009: 73%).
Encyclopaedia of Forms and Precedents in electronic format was taken by 47% of respondents (2009: 44%). No other Lexis®Library products were taken by 10% or more respondents. The next most popular were Employment Law by 8% of respondents to Lexis®Library products (2009: 6%) followed by Tax and Local Government modules both on 4%. Family & Child Law by Civil Procedure 3% (2009: 5%) and Company Law, Commercial Law, Civil Procedure and the Current Awareness modules, all on 3%. A further 15 Lexis®Library databases were each mentioned by less than 3% of respondents. Two respondents hoped to take out subscriptions to unspecified Lexis®Library databases before July 2010. On the other hand, two respondents mentioned cancelling Lexis®Library modules, specifically mentioning the Legislation module and the International module, the latter on the ground of ‘high price and low usage’.
HeinOnline retained its third position with a 73% share of the market (2009: 70%). No new subscriptions or cancellations were mentioned by any respondent.
Lawtel UK slipped slightly, dropping to 48% of respondents, from 49% last year. Kemp on Lawtel was listed by 4 respondents. No respondents hoped to increase the coverage of their existing subscription to Lawtel UK by July 2010. Six respondents were considering cancelling Lawtel UK by July 2010 due to budgetary constraints.
Justis Weekly Law Reports was subscribed to by 17 institutions, representing a fall to 19% of respondents (2009: 26%), and 3 respondents noted they hoped to cancel their subscription by July 2010. The main reason given was that the reports were available on Westlaw UK (last year, the same number of possible cancelled subscriptions and the same reasons were cited). Another Justis product, The Law Reports, was also taken by 17 respondents or 19%, a continued fall over the last few years (2009: 21%). Two respondents cited availability elsewhere as the reason for hoping to cancel The Law Reports by July 2010. Three respondents said they took all Justis products. Nine respondents (2009: 8) took the English Reports, still the most popular product apart from Weekly Law Reports and The Law Reports. But, one respondent was hoping to cancel their subscription to The English Reports as it is available free on HeinOnline and through BAILII. International Law Reports was taken by 4 respondents. JustCite remained stable and was mentioned by 24 or 26% (2009: 26%), but 4 respondents were considering cancelling the subscription on the grounds of insufficiently unique content. 10 other products were each taken by no more than five respondents each.
Subscriptions to the Current Legal Information (CLI) database continue to decline, down from 88% of respondents subscribing in 2000 to just 6 respondents or 7% in February 2010.
Databases of European legal information continue to be casualties in the changing academic legal database market. Eurolaw has slipped down the list again, subscribed to by just 3 respondents or 3% (2009: 8%), and three respondents planned to cancel Eurolaw before July 2010. Lawtel EU was taken by 11 respondents or 12% (2009: 14%). Two respondents planned to cancel Lawtel EU by July 2010 because of duplication of materials elsewhere and lack of use. Other full text EU databases were taken by only 7 respondents, the equivalent of 8% of respondents (2009: 8%). They included European Sources Online (5 respondents).
The median number of legal database subscriptions taken in responding law libraries in February 2010 was 4, the same as in the two previous years. The numbers of legal databases offered by institutions ranged from 2 to 72 (2009: 2 to 64).
Other than the databases already discussed in detail, the following databases were mentioned by (10%) or more respondents:
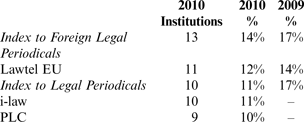
Other databases mentioned were Casetrack, Kluwer International Arbitration and Oxford Reports on International Law (6 respondents each).
As an indication of the broad range of databases thought to be relevant to the study of law in UK universities, a total of 91databases other than those already featured were each mentioned by under 10% of survey respondents (2009: 100 databases).
Virtually all databases were accessed via the internet. Only two respondents were taking databases in CD-ROM format (Current Legal Information and a Justis product). The transfer from CD-ROM to the internet has been rapid and is now almost complete. In 1999 just 32% of legal databases were internet based.
8. Other databases
In addition to law databases, law schools use a range of more general information databases, such as the newspapers, which are of relevance to students in a wide range of disciplines. Fifty-one respondents (56%) noted other subscription databases which contribute significantly to the teaching and research work of their law school. This showed a small rise from the 52% recorded last year.
The EBSCO journal subscription service was mentioned by 12 institutions and IBSS (International Bibliography of the Social Sciences) by just 7 respondents. ISI Web of Science service, the most widely used of the general databases mentioned last year, held on to this position with 42 respondents (46%) mentioning the service this year (44 or 49% last year).
By February 2010, 50 or 54% of law schools served by responding libraries used a web-based combined newspaper database to access the full range of newspapers (2008: 50 or 56%). The three main suppliers were Nexis UK used by 30 respondents (2009: 30), Proquest with 9 respondents (2009: 11), Factiva with 7 respondents (2009: 7), Infotrac with 4 respondents (2009: 3), Gale with 2 respondents (2009: 2) and Newsbank with 1 respondent (2009: 2). No other newspaper databases were mentioned. The results for 2009 indicate the continued popularity for Nexis UK, with only slight changes in the subscriber newspaper databases used to contribute significantly to teaching and research in the law school.
ASSIA was mentioned by 29 respondents (32%), a slight fall on the 38% recorded last year.
Bookdata was used by 3% of law schools (2008: 7%). Forty-two respondents mentioned a total of 49 (2009: 41) other cross-disciplinary or social science indexes or electronic journal providers which contributed significantly to the teaching and research work of the law school. Criminal Justice Abstracts was mentioned by 17% of respondents, EBSCO Academic Search or Business Source Premier by 13% of respondents, JSTOR by 10% and IBSS by 8%.
9. Expenditure
Ninety-one of the 92 respondents were able to provide total expenditure figures for 2008/9.
9.1 Total expenditure on law materials
Total expenditure on the acquisition of law materials ranged from £34,097 to £1,177,057 (2008: £19,671 to £1,082,096). Mean expenditure was £163,898 (2008: £145,531), a 12.6% rise on 2008, which more than redresses the 1.5% rise in the mean last year, after annual increases in mean expenditure of around the 5% mark in the years before then.
It is helpful in understanding these changes to compare the expenditure in the different types of institution.
Old universities 45 responses (2008: 42)
Range £54,258 to £632,450; median £158,245, up 21% on 2008; mean £172,527, up 13% from last year. Seventy-five per cent of old universities spent at least £98,649 (up 9.6% on last year) and 25% spent more than £198,664 (up 7.8% on last year).
New universities 41 responses (2008: 40)
Range £34,097 to £416,000; median £116,452, up 28% on 2008; mean £123,650, up 20% from last year. Seventy-five per cent of new universities spent at least £74,885 (up 17.5% on last year) and 25% spent more than £155,741 (up 11% on last year).
Other institutions 5 responses (2008: 4)
Range £449,304 to £1,177,057; median £68,588, down over 84% on 2008; mean £416,289, down over 14% from last year. Seventy-five per cent spent at least £99,521 (up 90.5% on last year) and 25% spent more than £954,462 (down 5.4% on last year).
The results are surprising given the financial climate. The increases in general expenditure figures are well beyond the rate of inflation and beyond even the rates of increase reported in these law library surveys over the last five or more years. The largest rates of increase are found in the new universities. The figures for other institutions are severely distorted due to the small number of responses within this sub-group.
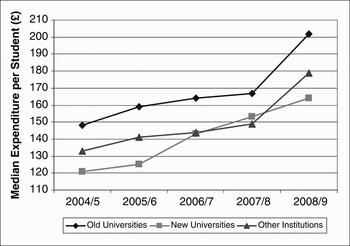
For each law student in a typical university (looking at the median) £173 was spent on law materials. This is a 7% increase on the figure for 2008 and a return to the rates of increase enjoyed before then. However, the rate of increase has not been evenly distributed across the higher education sector. In an old university, median spend per student was £202 (2008: £167) but for a student in a new university the median was £164 (2008: £153), a gap between old and new universities of 23%. In other types of institution the median spend per student was £179 (2008: £149). As graph 2 illustrates, the gap between old and new universities fluctuates over time but widened considerably in 2008/2009 due to the increase in median expenditure in old universities. Per capita expenditure at other types of institution has increased considerably and returned to its position above that for new universities.
Library materials expenditure per student

Taking the mean, rather than the median, the pattern is of a narrowing of the gap between sectors. Mean law materials expenditure per student in old universities was £218, up 2% from 2008 whereas in new universities it was £207, a 24% increase on 2008. In other types of institution the mean spend per student was £181 (2008: £192), but these results have been calculated over just five respondents, two more than last year.
9.2 Monograph expenditure
Ninety respondents provided details of spending on books, up on the 85 last year. Some respondents had difficulty providing a discrete and accurate figure for law expenditure alone owing to the way the university or college budget is divided amongst subject areas.
Expenditure on monographs ranged from £2,441 to £231,996 (2008: £3,328 to £233,605), with a mean of £34,381, a rise of nearly 5% on 2008 and a median of £23,755, a rise of 11% on last year. During the period of the latest survey, the average price of British academic law books rose by 5.1% overall (LISU, 2009). In the previous year a 16% rise in prices was recorded. The figures appear to indicate that after several years in the mid-2000s when average prices see-sawed, price fluctuations have calmed. The rises in institutional budgets for the purchase of law monographs in 2008/2009 matched national movements in the cost of law monographs.
In 2009, on average, monograph acquisitions accounted for 22% of total law material expenditure (2008: 24%; 2007: 24%). The proportion of total expenditure spent on books ranged from 4% to 100% with a median of 20% (2008: 4% to 100%, median 22%; 2007: 6% to 57%, median 22%).
Analysed by type of institution the figures for monograph expenditure were:
Old universities 44 respondents (2008: 42)
Range £8,982 to £92,646; median £30,174, a rise of 12.4% on last year; mean £38,254 a rise of 8.4% on 2008. Mean of 24% of total law material expenditure (2008: 28%; 2007: 26%).
New universities 41 respondents (2008: 39)
Range £2,441 to £116,700; median £20,400, up 20.9% on 2008; mean £25,152, up 7.1% on last year. Mean of 20% of total law material expenditure (2008: 21%; 2007: 22%).
Other institutions 5 institutions (2008: 4)
Range £3,536 to £231,996; median £25,034 a fall of 66%; mean £75,963, a fall of over 22% on last year. Mean of 21% of total law material expenditure (2008: 16%; 2007: 20%).
The figures for old and new universities show a marked rise in expenditure on monographs while other institutions recorded considerable falls, the latter probably due to the small number of returns. However, the percentage of total law expenditure devoted to monographs has fallen amongst both old and new universities and is at the lowest proportion of total expenditure recorded in these annual surveys. The proportion spent on monographs by the small number of other types of institution has risen.
9.3 Serials expenditure
Eighty-seven of the 92 respondents who gave any financial figures were able to provide a figure for their spending on serials, up on the 81 respondents last year. The questionnaire defined serials as law journals, statutes, law reports and loose-leaf updates.
As a mean, serials accounted for 56% of total law materials expenditure, up slightly on last year but still below the levels reported up to 2004 (2008: 55%; 2007: 56%). The proportion of expenditure given to serials ranged from 17% to 93% (2008: 11% to 90%; 2007: 25% to 78%) with a median of 55% (2008: 55%; 2007: 56%). Overall, serials expenditure ranged from £9,229 to £800,061 (2008: £2,887 to £733,507), with a median of £64,749 (2008: £55,905) and a mean of £96,234 (2008: £88,794), the median up 15.8%, and the mean up 8.3%, both making steeper the established upward trend.
Overall, whilst the actual amounts spent on serials have risen, the percentage of total law expenditure spent on these materials is only marginally more than in 2007/2008. However, when analysed by type of institution the results given below indicate a variable pattern:
Analysed by type of institution the figures were:
Old universities 42 responses (2008: 39)
Range £25,151 to £449,100; median £89,242, up 4.6% on last year, continuing the reversal of the downward trend established between 2004 and 2007; mean £103,391, up 6.4% continuing the rising trend established in 2007. Mean of 57% of total law material expenditure (2008: 54%; 2007: 56%).
New universities 40 responses (2008: 38)
Range £10,914 to £260,400; median £56,399, a rise of 18% on last year, continuing the upward trend established in 2007; mean £68,471, up 22% on last year. Mean of 54% of total law material expenditure (2008: 51%; 2007: 54%).
Other institutions 5 responses (2008: 4)
Range £9,229 to £800,061; median £55,114, a fall of 78.5% on last year; mean £258,239, a fall of nearly 29% on last year. Mean of 57% of total law material expenditure (2008: 65%; 2007: 64%).
The indicators for old universities show considerable rises in the actual sums spent on serials and in the proportion of the total budget spent on this type of material. New universities increased the actual sums spent quite dramatically but the proportion of total budget spent on serials increased only a few percentage points. All the results for other institutions are affected by the small number of institutions in the profile.
9.4 Database expenditure
Databases accounted for 24% of total law materials expenditure in the mean, ranging from 8% to 77% and with a median of 21% (2008: mean of 23%, median of 20%; 2007: mean of 20%, median of 17%). Of the 85 responses (2008: 73), expenditure ranged from £9,705 to £180,623 (2008: £4,808 to £138,321) with a median of £25,126 (2008: £18,415), a massive 36% increase on last year, and a mean of £37,365 (2008: £27,092), up 38% on last year, a staggering upward trend.
Analysed by type of institution the figures were:
Old universities 39 respondents (2008: 34)
Range £9,705 to £147,000; median £28,861, up 51% on last year; mean £39,248, 55% up on last year. Median 20% and mean 23% of total law material expenditure (2008: 15% and 18%; 2007: 15% and 17% respectively).
New universities 41 respondents (2008: 35)
Range £9,969 to £135,981; median £23,436, up 31% on 2008; mean £31,341, up 30% on last year. Median 23% and mean 27% of total law material expenditure (2008: 25% and 27%; 2007: 22% and 23%).
Other institutions 5 respondents (2008: 4)
Range £9,843 to £180,623; median £15,039, a fall of 76% on 2008; mean £72,088, a rise of 5% on last year. Median 18% and mean 20% of total law material expenditure (2008: 16% and 17%; 2007: 14% and 13%).
Spending on databases in both old and new universities is up on last year, most markedly amongst old universities, where the median and mean are up over 50%. Across all sectors the median and mean percentage of total law material expenditure on databases has increased, apart from the median expenditure in new universities.
Last year the question was posed: ‘are the falls in the percentage of total law material expenditure devoted to serials being matched by an increase in the percentage of total expenditure being devoted to databases?’ This year the question should focus on the decreased percentage spent on monographs.
Respondents were asked to distinguish, if possible, between expenditure on locally stored databases such as CD-ROMs and expenditure on remote, in effect web-based, databases.
9.4.1 Expenditure on web-based databases
For most institutions the figures for web database expenditure do not include broad-based electronic information such as ISI Web of Science, newspaper databases or electronic journals which, although used by law staff and students, are usually funded outside the law budget for use by students across all subject disciplines.
Eighty respondents (2008: 73) noted expenditure on web databases ranging from £9,705 to £180,623 (2008: £4,808 to £138,321), with a median of £23,864, up nearly a staggering 30% on 2008, and a mean of £33,609, up 24% on last year. Amongst respondents providing this detailed information, web databases accounted for a mean of 23% of law material expenditure and a median of 21%, (2008: 22% and 19%; 2007: 20% and 17% respectively).
9.4.2 Expenditure on CD-ROM databases
Just 1 respondent (2008: 2) reported expenditure on CD-ROMs or other locally-stored databases. The sum was £695.
9.5 Other expenditure on law materials
Twenty-one respondents noted “other” expenditure, three more than last year. Expenditure ranged from £36 to £49,747 (2008: £15 to £48,731) with a median of £2,140 (2008: £1,939), a 10% rise, and a mean of £6,090 (2008: £6,311), a fall of 4%. Seven respondents spent the money on binding, and nine on inter-library loans (three mentioned both). E-books or E-journals (mentioned four times), copyright licences (mentioned twice), Athens costs, back issues, standing orders, BIALL subscription and to pay for ‘exchange rate variance’ were each mentioned once.
9.6 Expenditure to support a LPC or BVC or Diploma in Legal Practice (Scotland)
At the request of BIALL questions were asked for the first time relating to expenditure on library materials specifically to support the LPC or the BVC or the Diploma in Legal Practice (Scotland). These courses require the use of practitioner materials and databases and are usually considered to be more expensive to support than undergraduate or even taught postgraduate courses such as the LLM. As far as it is possible to ascertain, no concrete evidence for these assertions has been published previously.
9.6.1 Who responded and student numbers
As noted in section 5 above, 34 institutions which responded to the survey offered these vocational courses. Twenty-one provided details of the number of students at their institution following vocational law courses during 2008/2009. They comprised 4 old universities and 17 new universities only. No other institutions completed the questions relating to LPC/BVC/LPD courses.
The number of students ranged from 17 to 650 with a median of 91 and a mean of 166. Amongst the 4 old universities the number of students ranged from 88 to 557, with a median of 180 and mean of 251. The number of students at the 17 new universities ranged from 17 to 650, with a median of 89 and mean of 146. Twelve institutions were unable to provide figures and one failed to respond to this section.
9.6.2 LPC/BVC/DLP total expenditure on law materials
Twenty respondents were able to provide total expenditure figures for 2008/2009. They comprised 4 old universities and 16 new universities. 12 further respondents were unable to extract expenditure figures for these specific courses from the total law library budget. One failed to respond.
Total expenditure on the acquisition of law materials for vocational training courses ranged from £9,581 to £272,833, with a median expenditure of £39,537 and a mean of £65,748.
Most respondents providing expenditure figures for library materials to support vocational courses were new universities. Since the number of old universities responding to the survey was so small, no calculations were undertaken on expenditure by different types of higher education institution.
For each vocational course law student in a typical institution following the LPC or BVC or DLP (looking at the median) £435 was spent on law materials. This is considerably higher than the median spend of £173 across all courses noted in section 9.1, above. Taking the mean rather than the median, the per capita spend was even higher at £546.
There does appear to be some justification then, for the view that postgraduate vocational courses require much greater levels of expenditure on library materials than other courses. Further, it is likely that the figures do not portray accurately the entire expenditure required to support these courses, for expenditure on general law databases, available to students on all law courses, is not usually proportionately re-allocated to the budget heads for the vocational courses, but paid for centrally.
9.6.3 LPC/BVC/DLP monograph expenditure
Eighteen respondents provided details of spending on books. They comprised 4 old universities and 14 new universities. Expenditure on monographs ranged from £1,000 to £79,178 with a mean of £11,338 and a median of £7,683.
9.6.4 LPC/BVC/DLP serials expenditure
Seventeen respondents were able to provide a figure for their spending on serials. They comprised 4 old universities and 13 new universities. The questionnaire defined serials as law journals, statutes, law reports and loose-leaf updates. Serials expenditure ranged from £3,865 to £163,400 with a median of £23,600 and a mean of £45,803.
9.6.5 LPC/BVC/DLP database expenditure
Reliable database expenditure figures were difficult to obtain. In some institutions the cost of the major, general law databases (such as Lexis®Library and Westlaw UK) comes from the overall law budget for all courses and it is not possible to allocate a cost to a particular course. In some institutions expenditure on databases specifically to support vocational courses may be restricted to particular practitioner libraries or modules (such as Halsbury's Laws or Archbold), while in others even expenditure on these is folded into the cost of the overall subscription. For these reasons, the figures provided here and in sections 9.6.6 and 9.6.7 should be treated with caution.
Fourteen respondents provided figures for database expenditure regardless of medium. The figures ranged from £400 to £54,352, with a median of £9,317 and a mean of £18,208.
9.6.6 LPC/BVC/DLP expenditure on web-based databases
Eleven respondents provide expenditure figures on web-based databases alone. The figures ranged from £2,011 to £54,352 with a median of £9,687 and mean of £19,432.
9.6.7 LPC/BVC/DLP expenditure on CD-ROM databases
Three respondents, all new universities, reported expenditure on CD-ROMs or other locally-stored databases. Expenditure ranged from £400 to £1,319, with a median of £695 and a mean of £805.
9.6.8 LPC/BVC/DLP other expenditure on law materials
Three respondents, 2 old universities and 1 new university, noted “other” expenditure, ranging from £663 to £8,830, with a median of £1,200 and a mean of £3,564. One respondent provided details of the use to which the money was put: binding.
10. Sources of income
10.1 All courses
Ninety (2008: 82) respondents gave details of the source of the funds from which law material expenditure was met. The greatest proportion of acquisitions was funded from general library funds and all except nine institutions responding received at least part of their income this way. Using the mean, 86% of old universities', 86% of new universities' and 82% of other institutions' income for law library materials was from general library funds (86%, 81% and 78% last year). When the median is used the figures are 90%, 99%, 88% (2008: 82%, 95% and 100%). As in past years, some libraries in all categories obtained considerable funds from outside the usual main source of general library funds.
Law schools contributed to funding the acquisition of law materials in 47 institutions (2008: 44). As has been noted in previous survey reports, a considerable number of law schools make no such contribution (47% this year, 48% in 2008). Fifty-nine per cent (2008: 53%) of old university law schools, 44% (2008: 45%) of new university law schools and 40% (2008: 50%) of other institutions' schools contributed something.
Of the law schools that contributed, the amount ranged from £1,434 to £731,868 (2008: £404 to £785,634). The median contribution was £18,000, a fall of nearly 25% following on from a 17% fall the year before. The mean was £53,354, down 7% on last year.
For the libraries that received funds from the law school, these funds represented a mean of 27% of the total income for the purchase of law materials, with a median of 17% (28% and 24% last year). The percentage contributions by law schools based in old and new universities were further apart this year. Of the old university law schools who contributed anything, the mean contribution represented 23% of the funds for library materials (2008: 25%), while new university law schools contributed 28% (2008: 28%). Two ‘other’ institutions received funds from the law school and the mean was 75% (2008: 75%).
In old universities, median law school funding for law materials was £12,566, down 25% on last year. The mean was £40,940, up 4% on last year. In new universities the comparative figures were a median of £19,250, down 46% on last year (which itself was a 45% fall on the year before) and a mean of £37,707, down 5% on 2008.
Overall, about the same percentage of law schools as last year contributed to funding the acquisition of law materials, though there are variations between the sectors, with a substantial rise in the percentage of old university law schools contributing. The actual amount contributed by law schools was considerably lower, gauged on most indicators, than last year. The pattern across the three sectors indicates that, as in past years, new university law schools contributed the largest proportion to the law library budget. On average, law schools in old universities contributed a smaller proportion to the total law materials budget, but this year there were more of them making a contribution than in the past.
Eleven institutions (2008: 6) reported receiving income from other university budgets for law materials. For these seven old universities and four new universities, the amount of income from these sources ranged from £9,103 to £187,875 (2008: £2,146 to £42,752).
One old university and one other type of institution reported funding from user charges (2008: 1). The sums were £11,510 and £14,000 respectively (2008: £12,003).
Finally, eight institutions (2008: 4) reported receiving financial contributions towards law materials from outside bodies. The sums ranged from £714 to £218,800 (2008: £5,826 to £119,000) with a median income of £12,450 (2008: £11,727) and a mean income of £38,681 (2008: £37,070). Of these, seven were old universities, one was a new university.
10.2 Targeted funding from the law school
Two further questions sought to explore whether law schools paid for specific materials or services.
The first question asked respondents to indicate whether specific types of materials were paid for by the law school. Thirty five respondents (38%) replied in the positive (2008: 40, 45%). By far the most frequently mentioned was payment of, or contributions towards, the cost of electronic databases – 23 respondents (2008: 20). Fourteen respondents noted that the law school contributed towards the cost of law books, journals or reports (6 in 2008) ranging from research journals to multiple copies of textbooks. Library materials for the Legal Practice Course or Bar Vocational Course were mentioned specifically by six respondents (11 in 2008).
In the second question in this section, respondents were asked to indicate whether the law school contributed to law library expenditure other than for the purchase of law materials. Eight respondents (8 in 2008) received this additional funding. Six indicated the amount of the contribution, ranging from £150 to £46,047 (2008: £2,112 to £50,000). The highest figure was at an old university where the Law School paid for staff salaries for a legal practice library. Other respondents received funding towards the cost of staff salaries ranging from £29,853 to £40,120. In addition, four received funding for other purposes: library staff training, library staff weekend teaching, the maintenance of a law resources room, additional wiring for lap-tops and the purchase and installation of a plasma screen.
10.3 Income to support a LPC or BVC or Diploma in Legal Practice (Scotland)
At the request of BIALL questions were asked for the first time relating to income for the purchase on library materials specifically to support the LPC or the BVC or the Diploma in Legal Practice (Scotland).
As noted in section 5, above, 34 institutions offered these courses but only 11 respondents gave details of the source of the funds from which law material expenditure was met. Twelve respondents were unable to supply figures on income because either it was not possible to identify library income specifically intended to support these courses or the budget was held by the teaching school and not library staff. One institution failed to respond.
Eleven (2 old universities and 9 new universities) received funding from general library funds with sums ranging from £4,434 to £61,712, with a median of £34,915 and a mean of £30,362. Within 10 institutions no income to support these courses came from general library funds. This is not unexpected, for these postgraduate courses develop student income which is frequently retained by the law school. Fourteen institutions (4 old universities and 10 new universities) received income from law school funds ranging from £9,581 to £272,833, with a median of £35,753 and a mean of £58,890.
Two institutions, both new universities, received income from other institutional budgets (£61,876 and £100,000 respectively).
No other sources of income were mentioned.
11. Staffing
The responses to the questions on staffing provide a picture of the number and qualifications of library staff in academic law libraries. The definition of law library staff provided in the questionnaire was the same as for the previous surveys. To be included in the survey, library staff were to spend 50% or more of their working time on the care and servicing of the law collection. Eight (9%) of the 92 responding institutions had no staff which met this criterion (2008: 7 or 8%). Of these, 3 (2008: 2) were old universities and 5 (2008: 5) were new universities. The results continue the slightly worsening trend begun in 2007. In a number of instances respondents mentioned that law was just one of a number of subjects for which a team of librarians was responsible, but no one spent the requisite 50% or more of their time on law alone.
For the 84 respondents (2007: 76) with staff who met the criterion, the full time equivalent (FTE) number of staff ranged from 0.5 to 25.8 (2008: 0.5 to 28.10) with a median of 1.5 (2008: 1.5) and a mean of 3.3 (2008: 3.0). Thirty-nine per cent (2008: 36%) had exactly one FTE member of law library staff.
As in previous surveys, old universities ranged most widely in the number of law library staff and 24% had four or more FTE (2008: 27%), continuing the declining trend in numbers over the last few years, compared to 5% of new universities (2008: 5%).
The median for old universities' FTE law library staffing was 2.0 (2008: 2.0) with a mean of 3.9 (2008: 3.8). The median for new universities was 1 (2008: 1) and the mean was 1.6 (2008: 1.7). The five other institutions were very varied in their staffing levels, from 1 to 21.9 FTE. Two of the five had over 20 staff.
The staffing picture includes only a few minor changes. Respondents were asked for the FTE number of staff in professional, clerical and other posts.
11.1 Professional posts
Of the 84 institutions which had staff with the care and servicing of the law collections as their sole or principal function, thirteen (6 old universities and 7 new universities) did not have a professional post (2008: 3). Overall, then, of the 84 responding law libraries with staff who met the definition, 85% had a designated professional who could dedicate a significant proportion of their time to the needs of the law service (2008: 89%). This continues a distinct downward trend, noted from 2005 onwards.
The number of professional FTE posts ranged from 0.5 to 8.9 (2008: 0.5 to 8.9) but 60% of institutions (2008: 55%) with any professional posts had exactly one FTE.
In the old universities, 21 of the 46 respondents had exactly 1 FTE, with 7 institutions with less than 1 FTE; 12 had more than one and the maximum was 8.90 FTE professional posts. The mean for old universities was 1.5 FTEs (2008: 1.5 FTEs). As in the results for the last two years, there were no respondents without a professional post depending on a member of clerical staff with a LIS qualification. Overall, the results are broadly similar to last year.
In the new universities, 24 of the 41 respondents had exactly 1 FTE professional post, 4 had fewer and 6 had more, comprising 3 with 2 FTE and 1 with 2.5 FTE. The mean for new universities was 1.1 FTE. These results are broadly similar to last year. In the other institutions, two had exactly 1 FTE and the other two had more, to a maximum of 15.9 FTE.
11.2 Clerical posts
Turning to clerical posts, 46 institutions had clerical staff who met the definition given in section 11. Of the other 38 who had library staff but no clerical staff, 13 were old universities, 23 were new universities and 2 were ‘other’ institutions.
For those that did have clerical staffing, numbers ranged from 0.25 to 16.40 (2008: 0.5 to 16.20), with a median of 1.50 (2008: 2.0). Sixty-seven per cent of old universities reported clerical staff for law as opposed to just 29% of new universities (2008: 67%, 30%). As found in past years, old universities typically had larger numbers of clerical staff. Six of the 31 old universities with clerical staff had four or more such staff and the mean was 3.5 FTEs, whereas of the 12 new universities with clerical staffing none had four or more FTE. Two of the five other institutions with clerical staff for law had four or more FTE – they both have law libraries scattered across the regions of England.
A partial explanation for the large difference between the presence of clerical staffing in old and new universities can be drawn from the location of the law library. Of the 19 (2008: 19) institutions with more than 2 FTE clerical staff, 15 (79%) had a law library located separately from other collections (2008: 68%). Ten institutions (67%) were in old universities. Where there is a separate law library, staffing is less likely to be shared between subjects and circulation and other activities will be dedicated to the law collections. It is noteworthy however, that 32% of respondents who had a single law library in a separate location had professional staff but no clerical staffing or “other” staff dedicated to the law service (a return to 2007 levels).
11.3 Staff employed in other posts
Eight institutions (2008: 10) noted law library staff, other than clerical or professional staff, who met the criterion noted in section 11 above. Of these, 5 were old universities and 3 were new. FTE numbers of such staff ranged from 0.35 to 1.0 (2008: 0.35 to 1.0). Their duties were specified by just three respondents and included assistant manager, shelver and learning advisor.
11.4 Qualifications of staff
Respondents were asked to indicate how many of the staff whose principal function was the care of the law collections had a professional librarianship or information science (LIS) qualification or an academic or professional qualification in law.
Eighty-three respondents or 90% (2008: 81 or 91% of all respondents) had at least one member of staff who had a LIS qualification, although for 12 institutions this was less than one full-time member of staff (2008: 10). Forty-six (2008: 49) institutions had exactly one FTE member of staff with a LIS qualification and 9 (2008: 7) had three or more FTE staff with such a qualification, up to a maximum of 15.5 FTE (2008: 17.4 FTE). Of the nine institutions which did not have any law library staff with a LIS qualification, four were old universities and five new. No institutions had law library staff employed in a professional librarian post, without a LIS qualification.
Twenty one of the 92 respondents representing 23% of institutions (2008: 25%) had staff with an academic or professional qualification in law. This is a further fall from the highest percentage which was recorded in 2007, to below levels seen before 2007. Fifteen (2008: 19) had at least one member of staff so qualified, but 12 (2008: 14) of these had exactly 1 FTE staff member with a law qualification. As found in past surveys, library staff with law qualifications were much more common in old universities. Looking at only those institutions which had any staff which met the criterion noted in section 11 above, in old universities 35% (2008: 40%) of law libraries had law qualified staff, compared to new universities where only 10% (2008: 9%) had law qualified staff. One (2008: 2) of the five other institutions had such staff. The fall in law qualified staff has been most noticeable amongst old universities. Overall, 76% of the libraries with law qualified staff were in old universities, one percent lower than last year.
12. Legal research skills instruction
User training in law libraries is investigated by this survey every other year. Legal research skills training is defined for the survey in terms of instruction, for example, in how to understand legal abbreviations and in the use of particular law publications or databases. It is not concerned with induction tours, basic introductions to the library or the library catalogue. All 92 (2007: 79) respondents completed this part of the questionnaire this year. One institution responded that no legal research skills instruction was provided.
12.1 Who provides the instruction?
In 96% (2007: 96%) of institutions law library staff were involved in providing legal research skills training. Only in 2 new universities and 1 other institution were library staff not involved. Law School lecturing staff were involved in the training in 72% (2007: 83%) of institutions. Other staff, including other professional library staff and IT training officers in the law school, were involved in 3% (2007: 6%) of institutions. Several of the database providers now offer free training to staff and students and so the survey asked whether such external trainers were used for legal research skills instruction. 55% (2007: 69%) of respondents' institutions took advantage of such free training. In addition, Lexis student associates contributed to training in 51% (2007: 40%) of institutions.
In 8% (2007: 10%) of institutions, the law library staff alone provided legal research skills instruction. In a further 65% (2007: 6%) of institutions, the law library staff's contribution was supplemented by external trainers or student associates employed by a database supplier. Law library staff with or without the assistance of external trainers or student associates had sole responsibility for the training in 30% of old universities, 24% of new universities and no other institutions (2007: 16%, 17% and 0%).
In 71% of institutions (79% in 2007), provision was a joint responsibility between the law library and law school lecturing staff. However, in 52% (2007: 69%) of institutions legal research skills instruction also involved other staff or external trainers.
The figures suggest that the law library and law school continue to work together to develop students' legal research skills in a very large number of universities and other institutions, aided in just over half by trainers or student associates from the large database providers. Since the last survey two years ago, the use of free training by database providers appears to have declined by as much as 14% whilst the use of student associates has increased (by 11%). The number of law library staff having sole responsibility for legal research skills training has fallen again, but by less than occurred between 2005 and 2007. The overall picture is of a greater mix of contributors to legal research skills training in institutions, but librarians still retain a key role in the overwhelming majority.
12.2 For which courses is instruction provided?
Respondents indicated for which courses legal research skills instruction was provided by library staff.

In most responding institutions, law library staff were involved in legal research skills instruction for undergraduates, and now also in instruction for vocational courses. The proportion of institutions where library staff were involved in legal research skills instruction for undergraduates was stable, whilst there has been since 2007 a considerable increase in involvement in postgraduate vocational courses. Involvement with postgraduate taught courses has slipped a few points but involvement with training research postgraduates has increased markedly. All the trends continue to be encouraging.
12.3 Integration with the teaching curriculum
Respondents were asked in which courses the library's contribution to legal research skills instruction was timetabled and incorporated within the curriculum of study.

The levels of integration of the library's contribution have slipped a little for undergraduate, other taught postgraduate (LLM) and research courses. However, the integration of their contribution within postgraduate vocational courses has been extremely successful.
12.4 How much teaching does a student receive?
To understand how much training each of the courses noted above actually receive, respondents were then asked to note the number of timetabled contact hours of legal research skills instruction a student would receive from library staff over the duration of the whole course of study. Contact hours were defined as the length of time an individual student would spend receiving direct timetabled teaching or tutorial guidance. Only those sessions incorporated into a curriculum of study were to be included. As some respondents know, on receipt of their return I made rigorous enquiries to try to ensure all were reporting on the same basis.
For the 81 respondents (2007: 70) who noted contact hours for undergraduates, hours ranged from 1 to 12 (2007: 0.5 to 12), with a mean of 3.8 hours (2007: 3.7) and a median of 3 hours (2007: 3). Undergraduates in 53% (2007: 53%) of respondents' institutions received between 2 and 4 hours instruction from the law library staff. Thirty-four respondents (2007: 22) noted contact hours with library staff for students on the LPC, BVC, CPE, Legal Executives and other postgraduate professional courses. Hours ranged from 1 to 13 (2007: 1 to 18), with a mean of 3.5 hours (2007: 2.9) and a median of 2.5 hours (2007: 2). Sixty-eight institutions (2007: 59) gave contact hours for other taught postgraduate students. These ranged from 1 hour to 10 hours (2007: 0.5 to 8), with a mean of 3 hours (2007: 2.6) and a median of 2 hours (2007: 2). Finally, 40 respondents, comprising 29 old universities and 11 new universities (2007: 30 respondents (26 old universities and 4 new) gave research postgraduates between 1 hour and 40 hours of legal research skills instruction (2007: 1 to 10), with a mean of 3.5 hours (2007: 1.5) and a median of 2 hours (2007: 1).
The amount of teaching received by an undergraduate or a taught course postgraduate (LLM) from library staff appears to have stabilised. However, increases were noted for postgraduate vocational course students and research postgraduates.
12.5 How many hours do librarians spend delivering legal research skills instruction?
Respondents were asked to indicate the number of law library staff hours spent in delivering legal research skills instruction during the year. Preparation time was excluded. Eighty-four institutions responded (2007: 75), with figures ranging from 2 hours to 280 hours (2007: 1 to 248). Eighteen respondents (2007: 14) spent under 10 hours teaching, 11 of whom were old universities and 7 new (2007: 9 old, 5 new). At the other end of the scale, 6 respondents (2007: 7), of whom 3 were old universities (2007: 7) and 3 new universities spent over 100 hours on instruction. The overall mean was 42 hours (2007: 38). The mean for both old and new universities was 43 hours, but other institutions returned a mean of 9 hours (2007: old 39 hours, new 37 hours; no statistics for other institutions). The overall median was 27 hours (2007: 22).
On most measures librarians appear to be spending more hours teaching than previously and, whilst in 2007 greater amounts of teaching were being undertaken within old universities, a balance between old and new universities appears to have been established.
12.6 Method of delivery
Respondents were asked to indicate, for the instruction featured in section 12.2 above, which methods of delivery were used.
As in the three previous surveys, IT or database workshops were the most popular method of delivery, used by 81% of all respondents, representing a considerable increase on the 60% reported in 2007. They were used most frequently for taught course postgraduate courses, where 70% of respondents used workshops followed by undergraduate teaching with 68% of respondents using the method. Referring to the 2007 results, this is a reversal of the popularity of the delivery method for the two types of course. IT or database workshops were used less with postgraduate professional training courses, where only 61% of respondents used this method of delivery. Database workshops were used by 39% of respondents for research postgraduates and, as in past years, this was the most popular delivery method for this group of students.
Overall, large group sessions were the next most popular method of delivery used by 69% of respondents (2007: 46%). They were most often used for undergraduate level teaching, where 67% of respondents used this method (2007: 69%), closely followed by other postgraduate taught courses with 42% of respondents using this delivery method (2007: 67%) and postgraduate professional courses (41%).
Locally produced online tutorials were used by 40% of responding institutions for legal research skills instruction (2007: 19%). This method of delivery showed a similar, considerable increase in use over 2007, as was found for IT or database workshops. Online tutorials were used across all courses but especially with undergraduates, where 33% of respondents used this method of delivery (2007: 24%), and postgraduate professional courses, with 30% of respondents (2007: 24%). Twenty-one per cent of respondents used them with taught postgraduates and just 9% of respondents used online tutorials with research postgraduates (2007: 0).
Small group sessions based in a seminar room, rather than an IT room, were used by librarians in 26% of institutions (2007: 33%). They were used most frequently for taught postgraduates by 25% of respondents (2007: 28%), then for undergraduates by 23% of respondents (2007: 28%), postgraduate professional training by 17% of respondents (2007: 29%). As in the past they were least often used for research postgraduate training, where the method was used in 13% of cases (2007: 20%).
Student workbooks, which enable hands-on self-paced learning, were used by just 19% (2007: 16%). They were used by 16 institutions (2007: 16) for undergraduates, by 8 institutions for postgraduate taught courses (2007: 2 institutions), by 9 institutions for postgraduate professional courses (2007: 9 institutions) and by 1 institution with research postgraduates (2007: 0).
Video was used by only 4% of respondents (2007: 4%) and most often for undergraduate training in 5% of courses (2007: 7%).
Ten per cent (2007: 8%) of respondents noted other methods. Six noted one-to-one training (used as part of various courses but especially with research postgraduates) and one noted a paper-based library exercise (for undergraduates).
12.7 Information literacy
As in 2005 and 2007 we asked two survey questions specifically referring to the Association of College and Research Libraries' (ACRL) Competency Standards (American Library Association, 2000) and the SCONUL Standards and the integration of these principles within the undergraduate law curriculum.
Ninety institutions responded (2007: 75), of which only 31 or 34% did (2007: 30 or 40%). Of those institutions that did, 26 or 81% (2007: 26 or 87%) embedded the principles within a law course whilst 5 or 16% (2007: 4 or 14%) embedded them within a generic information literacy programme. One respondent (3%) embedded the principles in both types of programme (2007: none).
These questions were first posed in 2005. The results for 2007 showed an increase in the number of institutions integrating information literacy principles within the law undergraduate programme. The latest figures indicate the number has slipped back somewhat. In 2009, a lower percentage of institutions than before were integrating IL principles but, of those that did, 81% were doing so as part of the law programme, though this is 6% fewer than in 2007.
13. Overseas links
At the request of BIALL questions were asked for the first time to explore whether institutions provided law courses overseas and, if so, the nature of the support the UK-based library and information service was required to provide to the overseas organisation and its students.
Of the 92 institutions which responded 19 or 21% did provide law courses overseas, either by means of a partnership with an overseas institution or by franchise. They were 8 old universities and 11 new universities. The courses offered by respondents were located in 16 countries: Malaysia (4 respondents), Greece and Hong Kong (3 each), China and India (2 each), Albania, Belgium, Bermuda, Cayman Islands China, Czech Republic, Eire, Ethiopia, France, Guernsey, Russia, Singapore (all one each).
None of the 19 institutions aimed their courses at pre-degree level. Ten focused on undergraduate and 13 on postgraduate level courses.
The most frequent type of support provided by library and information staff was providing e-mail support for overseas registered students in finding resources (11 respondents), providing access to new electronic resources (7), providing technical assistance to overseas library and information staff (6), creating lists of materials to be purchased by the overseas institution (5), setting up a subscription to new electronic materials and providing access to existing electronic resources online (both twice each), and the purchase and shipping out of print materials or providing access to support materials via the VLE (both mentioned once).
Other forms of support provided including occasionally making photocopies of articles (1), face-to-face training sessions provided by the UK law librarian to students in Belgium (1) or Ethiopia (1) or Guernsey (1), developing web pages and contributing to course materials on finding legal resources (1), collating material to set up a print library and liaising between a British book supplier and the partner institution (1). Three institutions provided no support at all.
14. Conclusion
The very good response rate of 82.9% this year should ensure the results presented here provide a reasonably accurate picture of the state of academic law libraries in the United Kingdom.
A development which will be approved of by the SLS is the finding that, as last year, just 8% of academic law libraries appear not to meet Standard 3.1 on space and physical facilities, set out in the SLS Statement of Standards (2009 version).
Westlaw UK, Lexis®Library and HeinOnline remained the top three subscribed, law database services. Between them they provide the full text of legislation in force, and many core and background law reports and journals. Clearly some institutions are carefully analysing where similar materials can be obtained at lesser or no cost. Respondents mentioned as coming in for scrutiny some of the Justis products which are available elsewhere on general databases. Databases which carried exclusively EU materials slipped down the rankings and also were mentioned for cancellation.
Turning to library expenditure, surprisingly, in the harsh financial climate of 2008/2009, the key indicators show significant rises in spending, above the retail price index and academic book price inflation. Expenditure per student increased dramatically. Whilst all types of material have been beneficiaries, monographs appear to show the least rise on the previous year whilst databases the most, generally up well over a staggering 33%. The figures for expenditure on vocational law courses were obtained for the first time in these annual surveys and, whilst not offering a complete and wholly accurate picture for the reasons stated in the body of the report of the survey, tend to show that per student head these courses are over 250% more expensive to support than all courses combined.
Nearly half of all law schools continued to make a contribution towards funding the acquisition of law materials, a lower figure than in the past, and this year the amounts contributed have generally fallen, some quite dramatically. On average, where a law school makes a contribution it constitutes around a quarter of the library's total income for the purchase of materials.
On the staffing side the reported changes were minor but there was a continuing, small but worrying increase in the number of institutions where there was no member of staff who devoted 50% or more of their time to the care and maintenance of the law collection. Responsibilities were being diluted by individuals either acquiring additional subjects or operational responsibilities or working as part of team serving a wider faculty.
Little change was reported in the qualifications held by staff. However, the percentage of staff with a law qualification fell back once again and was lower than in some past years, at 23%.
Law librarians in almost all responding institutions continued to be involved in providing legal research skills training. Most often it was in partnership with law lecturers and, in an increasing number of institutions, in a programme involving student associates appointed by the major database providers. Librarians were involved in training for all types of course though not all their contributions were integrated with the law teaching curriculum. The amount of teaching received by students stabilised after the rises recorded in 2005 and 2007, except for increases noted for postgraduate vocational and research students. On most measures librarians were spending more time teaching than previously. The considerable increase in the use of the VLE as a delivery medium is notable but, face-to-face contact through IT or database workshops, is still the most popular delivery method. The integration of information literacy principles within the law undergraduate programme has, unfortunately, suffered a reversal after the rises reported for 2007.
A minority of responding institutions had links with overseas institutions and a wide variety of types of support were reported, ranging from e-mail support to overseas students in finding resources, to face-to-face training sessions abroad – how lucky!
Acknowledgements
This has been the last survey I shall direct since I retire in July 2010. I wish to place on record my thanks to all the assistants who have worked with me on the surveys which began in this format in 1996, but especially Jenny Smith, who has once again provided diligent support, contacting respondents to clarify their answers or complete missed questions. She also carefully keyboarded answers, compiled and ran expertly the SPSS software programs which provide the results here presented. In answer to some enquiries as to why we do not use Survey Monkey or similar software, many of the statistical manipulations employed in the survey analysis, especially cross-tabulating answers by the type of institution, and which I believe best illuminate differences across the varied academic law library sector, cannot be undertaken using simple survey software.
I also acknowledge the continued support and encouragement of my manager at Cardiff University, Duncan Montgomery; the willingness of the Society of Legal Scholars and British and Irish Association of Law Librarians to finance the work and permit the creation of a body of detailed, statistical data about one particular type of academic library, which I believe is not only unique within law subject librarianship across the world, but also unique across all disciplines.
Finally, my thanks to all those who have taken the time to respond to the survey. I appreciate the burden it places on respondents since I complete much of the return for Cardiff! Nevertheless, I hope you all feel the effort is worth it, especially in these difficult financial times, and find value in the data here presented when required to ‘state a case’ or compare your services against a reliable benchmark.