INTRODUCTION
Schistosomiasis is a life-threatening parasitic disease with more than 200 million people infected worldwide (King, Reference King2009; Dewals et al. Reference Dewals, Marillier, Hoving, Leeto, Schwegmann and Brombacher2010). Upon infection, adult worms of Schistosoma japonicum produce hundreds of eggs per day and some of these eggs are trapped in the microvasculature of the liver, inducing a strong granulomatous response and associated fibrosis (Pearce and MacDonald, Reference Pearce and MacDonald2002). The primary cause of morbidity and mortality in human schistosomiasis is the formation of liver egg granulomas and secondary hepatic fibrosis (Wilson et al. Reference Wilson, Mentink-Kane, Pesce, Ramalingam, Thompson and Wynn2007; Chu et al. Reference Chu, Li, Wu and Shen2008; Aly et al. Reference Aly, Hendawy, Ali, Hassan and Nosseir2010).
Studies have shown that granuloma inflammatory reaction and fibrosis in liver tissue would continue to be aggravated, even after efficacious schistosomicides had been administered (Cioli and Pica-Mattoccia, Reference Cioli and Pica-Mattoccia2003; Southgate et al. Reference Southgate, Rollinson, Tchuem Tchuente and Hagan2005; Gryseels et al. Reference Gryseels, Polman, Clerinx and Kestens2006). Furthermore, resistance to praziquantel, which is the main treatment for schistosomiasis, has been reported (Ross et al. Reference Ross, Bartley, Sleigh, Olds, Li, Williams and McManus2002; Burke et al. Reference Burke, Jones, Gobert, Li, Ellis and McManus2009). Therefore, interventional control of liver granuloma formation and fibrosis becomes another key therapeutic strategy after efficacious killing of the parasite by schistosomicides for schistosomiasis management. However, to date, no anti-fibrosis drug with low toxicity and high efficiency has been developed against schistosomiasis.
In the murine model, mice infected with S. japonicum develop an early Th1 cytokine response with a severe liver granulomatous inflammatory response. However, the subsequent hepatic fibrosis is due to the chronic production of Th2-type cytokines (e.g. IL-13, IL-4) in response to the parasite eggs (Reiman et al. Reference Reiman, Thompson, Feng, Hari, Knight, Cheever, Rosenberg and Wynn2006). Recent studies have identified hepatic macrophages, the main cellular constituent of granulomas, as critical regulators of liver fibrosis by selective depletion of hepatic macrophages (Duffield et al. Reference Duffield, Forbes, Constandinou, Clay, Partolina, Vuthoori, Wu, Lang and Iredale2005; Wynn and Barron, Reference Wynn and Barron2010). Macrophages can be polarized into 2 major subsets, designated as classically activated macrophages (CAMs) or alternatively activated macrophages (AAMs). CAMs are induced upon stimulation with inflammatory cytokines such as the dominant Th1-type cytokine, IFN-γ, inducing the expression of nitric oxide synthase-2 (NOS-2) which generates nitric oxide (NO) in S. mansoni-infected mice. In contrast, AAMs are the product of IL-4, IL-13 and IL-21 signalling inducing the expression of arginase-1 (ARG-1), macrophage mannose receptor (MMR) and chitinase-like molecule (YM1) (Pearce and MacDonald, Reference Pearce and MacDonald2002; Wilson et al. Reference Wilson, Mentink-Kane, Pesce, Ramalingam, Thompson and Wynn2007; Dewals et al. Reference Dewals, Marillier, Hoving, Leeto, Schwegmann and Brombacher2010; Stolfi et al. Reference Stolfi, Caruso, Franze, Sarra, De Nitto, Rizzo, Pallone and Monteleone2010). Thus NOS-2 has been regarded as a biomarker of CAMs (Fong et al. Reference Fong, Bebien, Didierlaurent, Nebauer, Hussell, Broide, Karin and Lawrence2008), and ARG-1, MMR, YM1 have been considered to be specific markers of AAMs; in particular, ARG-1 has been shown to play a decisive role in the functional activities of AAMs (Reyes and Terrazas, Reference Reyes and Terrazas2007; Dewals et al. Reference Dewals, Marillier, Hoving, Leeto, Schwegmann and Brombacher2010). Studies suggested that AAMs may be important regulators of fibrosis via ARG-1 activation (Hesse et al. Reference Hesse, Modolell, La Flamme, Schito, Fuentes, Cheever, Pearce and Wynn2001). ARG-1 and NOS-2 compete for their common substrate, L-arginine in macrophages. L-arginine can be hydrolysed by ARG-1 to urea and L-ornithine, and then L-ornithine can be further metabolized to produce polyamine and proline. The proline is an essential amino acid that is involved in collagen production and, therefore, in the development of fibrosis in the liver during schistosomiasis (Hesse et al. Reference Hesse, Modolell, La Flamme, Schito, Fuentes, Cheever, Pearce and Wynn2001), while polyamine might benefit growth of the parasite (Abdallahi et al. Reference Abdallahi, Bensalem, Augier, Diagana, De Reggi and Gharib2001) and stimulate liver fibrosis through producing an environment favourable for fibroblast replication and collagen deposition (Shearer et al. Reference Shearer, Richards, Mills and Caldwell1997). L-arginine can also be oxidized by NOS-2 to L-citrulline and NO, and the latter can restrain hepatic fibrosis (Pearce and MacDonald, Reference Pearce and MacDonald2002; Wynn et al. Reference Wynn, Thompson, Cheever and Mentink-Kane2004). These data suggested that AAMs may represent a critical regulatory system during fibrogenesis and a potential anti-fibrosis drug target during schistosomiasis.
Paeoniflorin (PAE, C23H28O11), as a monoterpene glucoside, is the main component of total glucoside of paeony extracted from the root of Paeonia lactiflora, which is one of the well-known herbs in China, Japan, Korea and other Asian countries. Preparations of many traditional Chinese herbs used in anti-hepatic fibrosis contain Paeonia lactiflora. The total glucoside of paeony, containing more than 90% PAE, was approved for marketing in China (Zhang et al. Reference Zhang, Wei, Wang, Wang, Chen, Chen, Wu and Hu2008). Both the total glucosides of paeony and PAE are reported to have anti-inflammatory and immune-regulatory effects (Yamahara et al. Reference Yamahara, Yamada, Kimura, Sawada and Fujimura1982; Tsuboi et al. Reference Tsuboi, Hossain, Akhand, Takeda, Du, Rifa'i, Dai, Hayakawa, Suzuki and Nakashima2004). Our previous studies in mice demonstrated that PAE significantly ameliorates liver granuloma and fibrosis of schistosomiasis japonica mice through regulating IL-13 or TGF-β1 signalling in hepatic setellate cells (HSCs) from mice (Chu et al. Reference Chu, Luo, Li, Gao, Yu, Wei, Wu and Shen2007, Reference Chu, Li, Wu and Shen2008; Li et al. Reference Li, Shen, Zhong, Peng, Wen, Li, Luo and Wei2010). However, it is unknown whether PAE attenuates hepatic granuloma and fibrosis through regulating IL-13 signalling in AAMs, as well as in HSCs, from schistosomiasis japonica mice.
In this work, we observed alternative activation of macrophages in mice liver during Schistosoma japonica infection, and identified the effect of PAE on the alternative activation of macrophages through regulating IL-13 signalling in vivo and in vitro. Our study showed that IL-13 signalling played a key part in the alternative activation of macrophages, meanwhile we found for the first time that PAE inhibited the alternative activation of macrophage not only through reducing production of IL-13 from lymphocytes, but also through repressing phosphorylation of JAK2 and STAT6 in IL-13 signalling, which might contribute to attenuate liver granuloma and fibrosis in schistosomiasis japonica.
MATERIALS AND METHODS
Animals and treatment
Six to eight-week-old female BALB/c mice (21–25 g) were obtained from the Laboratory Animal Center of Anhui Province, China. These mice were housed under controlled conditions (22 °C±2°C; 65% ± 15% relative humidity; 12 h-12 h light-dark cycle). The animals received standard food and water ad libitum. Then the mice were randomly divided into 3 groups, each group containing 12 mice: model group, PAE group and control group. In the model group, each mouse was infected transcutaneously with approximately 30 S. japonicum cercariae. In the PAE group (Xuancheng BaiCao Plants Industry and Trade Co., Ltd, China; purity 98%) group, each infected mouse was given PAE (60 mg/kg/day) orally on 12 days post-infection (p.i) for 44 consecutive days. In the control group, the mice were neither infected nor given PAE orally. Except for the PAE-treated infected mice, the other mice were synchronously given the same volume of solvent orally. The cercariae were obtained from laboratory-raised and infected Oncomelania hupensis (Jiangsu Institute of Parasitic Diseases, China). All mice were sacrificed under anaesthesia at 8 weeks p.i. All experiments were approved by the institutional animal care and use committee.
Hyaluronic acid radioimmunoassay
Blood samples were collected from the 3 groups of mice from the retro-orbital sinus under anaesthesia, followed by incubation at 37°C for 30 min and centrifuged for 10 min at 1200 g. Serum was collected and the hyaluronic acid (HA) content was determined by the addition of 125I-labelled HA-binding protein according to the manufacturer's instructions (Beijing North Institute of Biological Technology, China), using a Gamma radioimmunoassay counter (GC-911, UCTC Chuangxin Co., Led, China).
Parasitological parameters
Hepatic and portal mesenteric vessels were perfused to recover schistosome worms for subsequent counting (Duvall and DeWitt, Reference Duvall and DeWitt1967). Results are expressed as the number of worms per mouse.
Hepatic tissue was digested in 4% potassium hydroxide solution at 37°C for 18 h to count schistosome eggs (Cheever et al. Reference Kononen, Bubendorf, Kallioniemi, Barlund, Schraml, Leighton, Torhorst, Mihatsch, Sauter and Kallioniemi1994). Results are expressed as the number of eggs per gramme of liver.
Tissue microarray technique
A significant advantage inherent in the technique is that each tissue sample is treated under identical conditions, maintaining experimental uniformity. Liver specimens were fixed in 4% (v/v) paraformaldehyde in PBS, then dehydrated in a graded alcohol series, and embedded in paraffin. The details of this technique have been previously described (Kononen et al. Reference Kononen, Bubendorf, Kallioniemi, Barlund, Schraml, Leighton, Torhorst, Mihatsch, Sauter and Kallioniemi1998). Tissue microarrays were constructed using a manual tissue arraying instrument (Beecher, Silver Spring, MD, USA). A hole (diameter=0·6 mm) was punched into a recipient paraffin microarray block (receiver block). A cylindrical core tissue biopsy specimen, 0·6 mm in diameter, was chosen at random from the paraffin-embedded liver tissue block (donor block), and then was punched and transferred to the receiver block hole. This process was repeated until all the tissue biopsy specimens from the donor blocks were deposited into the receiver blocks. Three cylindrical core tissue biopsy specimens were chosen at random from different sites of each donor block. After finishing the receiver blocks, multiple 4-μm tissue microarray sections were cut from the receiver blocks with a microtome, mounted on microscope slides, and then deparaffinized with xylene and rehydrated in graded alcohols. Three microarray sections (microscope slides) were chosen at random from each receiver block, and 5 photographs were taken from non-overlapping and non-adjacent regions of each liver tissue section for subsequent histological and immunohistochemical analysis.
Liver histological examination
Granuloma diameters were measured from haematoxylin and eosin-stained sections using a calibrated measuring eyepiece. The diameters of the 10 largest granulomas in each liver tissue section were measured and mean granuloma diameter and standard deviation (±1 s.d.) were calculated for each group of mice. Only granulomas appearing as circular in section were measured. Granulomas adjacent to areas of hepatocyte necrosis were excluded from diameter measurement. Masson's trichrome staining was used to demonstrate collagen deposition (Ouyang et al. Reference Ouyang, Guzman, Desoto-Lapaix, Pincus and Wieczorek2009). Collagen expression was quantitatively estimated by mean optical density (MOD) under a light microscope and with computer image analysis system (Image Plus Pro version 6.0). The MOD was determined for each mouse and the means were calculated for each group (±1 s.d.).
The volume density of liver granuloma was determined by the point-counting stereology techniques as previously described (Bartley et al. Reference Bartley, Ramm, Jones, Ruddell, Li and McManus2006). A point grid with 0·5 μm point-to-point distance generated by the ImageJ analysis software (NIH, Bethesda, MD, USA) was laid over each image and the number of points overlying the granuloma was used for estimating the volume density of hepatic granuloma, which was expressed as the percentage of the individual liver volume (the number of grid points overlying a granuloma divided by the numbers of points overlying all liver tissues). Counts for each photograph were averaged over photographs within mice, and the mean volume density and standard deviation (±1 s.d.) calculated for each group.
Hydroxyproline (Hyp) was measured after hydrolysis of a 200 mg portion of liver in 5 ml of 6 m HCl at 110°C for 18 h (Cheever et al. Reference Cheever, Finkelman, Caspar, Heiny, Macedonia and Sher1992). The increase in hepatic Hyp was positively related to egg numbers and was reported as the increase above normal liver Hyp in micromoles per 10 000 eggs (infected liver Hyp − normal liver Hyp)/liver eggs×104 (Pesce et al. Reference Pesce, Ramalingam, Mentink-Kane, Wilson, El Kasmi, Smith, Thompson, Cheever, Murray and Wynn2009). The same individual scored all histological features and had no knowledge of the experimental design.
Immunohistochemistry of hepatic granulomas
Hepatic tissue microarray sections were incubated with 1% SDS in TBS at room temperature for 5 min to unmask the Ab epitopes. Endogenous peroxidase activity was quenched by incubation for 5 min with 3% hydrogen peroxide. Then, the microscope slides were incubated with primary antibody: rabbit polyclonal anti-ARG-1 IgG (sc-20150, Santa Cruz Biotechnology, Inc., CA, USA, 1:100), rabbit polyclonal anti-NOS-2 IgG (sc-651, Santa Cruz Biotechnology, Inc., CA, USA, 1:300), goat polyclonal anti-IL-13 IgG (AF-413-NA, R&D Systems, Inc., Minneapolis, USA, 10 μg/ml) and rabbit polyclonal anti-phosphorylated signal transducer and activator of transcription 6 (anti-p-STAT6, ABIN461397, antibodies-online GmbH, Aachen, Germany, 1:150) overnight at 4°C. These sections were thoroughly washed and incubated with Polink-2 Plus Ploymer HRP Detection System for rabbit (or goat) primary antibody (PV-9001 or PV-9003, Zhongshan Golden-bridge Biotechnology Co., Ltd, China) at room temperature, and then the samples were developed with diaminobenzidine tetrahydrochloride solution for 2–10 min, and counterstained with haematoxylin. ARG-1, NOS-2, IL-13, p-STAT6 proteins were stained yellow or brown. Five images were photographed randomly and analysed from every liver tissue section on each microarray section (microscope slide). ARG-1, NOS-2, IL-13, p-STAT6 expressions were quantitatively estimated by MOD.
Preparation of soluble egg antigen (SEA)
SEA was prepared using the method described previously (Chu et al. Reference Chu, Luo, Li, Gao, Yu, Wei, Wu and Shen2007). Freeze-dried eggs (60 mg) were mixed with an appropriate volume of silicon dioxide and 15 ml of sterile PBS (0·01 m, pH 7·2), and ground until no intact egg could be seen under the microscope. Following centrifugation of the mixture for 20 min at 2000 g at 4°C, the crude supernatant was harvested and ultracentrifuged for 90 min at 100 000 g at 4°C. The final supernatant (containing SEA) was sterilized by being passed through a 0·2 mm syringe filter, and then the SEA protein concentration was determined by the Lowry method.
Lymphocyte culture and cytokine detection
Mesenteric lymph nodes were removed aseptically from the above mice and single-cell suspensions were prepared. Cells were plated in 24-well tissue culture plates at a final concentration of 3×10⁶ cells/ml in RPMI-1640 supplemented with 10% FCS, 2 μmol/ml glutamine, 1 μmol/ml sodium pyruvate, 50 nmol/ml 2-mercaptoethanol, and antibiotic-antimycotic solution. Cells were incubated at 37°C in a humidified atmosphere of 5% CO2, and were stimulated with SEA 20 μg/ml for 72 h, then supernatant fluids were harvested and assayed for IFN-γ and IL-13 with a Mouse IFN-gamma Quantikine ELISA Kit (MIF00, R&D Systems, Inc., Minneapolis, USA) and Mouse IL-13 Culture Media Quantikine ELISA Kit (M1300CB, R&D Systems, Inc., Minneapolis, USA), respectively, according to the manufacturer's protocol. Cytokine levels were calculated with standard curves constructed using recombinant murine cytokines.
Isolation and culture of Kupffer cells
Kupffer cells (KCs) were isolated from the 3 mouse groups at 8 weeks p.i according to a published procedure, with slight modifications (Wu et al. Reference Wu, Chuang, Yang and Lin2010). Briefly, the mice livers were each perfused with 200 ml of 0·02% type IV collagenase in Hanks' balanced salt solution (20 ml/min) and removed for mincing with scissors. The resulting material was digested for 10 min in a solution of 0·04 mg/ml type IV collagenase and filtered through sterile nylon gauze (50 nm). The filtrate was washed thoroughly and purified by 50%/ 25% two-step Percoll gradient centrifugation. The cells between the layers of the 25% Percoll solution and the 50% Percoll solution were carefully extracted and suspended in RPMI-1640 medium supplemented with 2 μmol/ml glutamine, 1 μmol/ml HEPES, 100 IU/ml penicillin, 100 μg/ml streptomycin and 10% heat-inactivated fetal calf serum (FCS, Hangzhou Sijiqing Biological Engineering Materials Co., Ltd, China). The cells were plated at 5×10⁴ or 5×10⁵ cells/ well onto 96- or 24-well culture plates, respectively. They were incubated at 37°C under 5% CO2 in air. The culture medium contained 1 μmol/ml L-arginine. After incubation for 2 h, non-adherent cells were removed. The number of remaining adherent cells was determined by differential counting. Cellular viability was determined in each experiment by the Trypan-blue exclusion test and all adherent cells were analysed for their ability to phagocytose latex beads, which indicated that they were viable KCs. Purity of the cell population was determined by morphology and non-specific esterase staining.
Measurement of PAE- and 2(S)-amino-6-boronohexanoic acid-stimulated KCs cytotoxicity and proliferation
To determine whether PAE or 2(S)-amino-6-boronohexanoic acid (ABH, a potent and specific inhibitor of arginase, ALX-270-420-M001, Enzo Life Sciences, Lausen, Switzerland) (Stickings et al. Reference Stickings, Mistry, Boucher, Morris and Cunningham2002) had potential cytotoxicity to KCs, concentration-dependent cytotoxicity assays (Lappalainen et al. Reference Lappalainen, Jaaskelainen, Syrjanen, Urtti and Syrjanen1994) were initially performed with various concentrations of PAE or ABH. Cellular viability was assessed by morphology and the Trypan-blue exclusion test, and cell injury was quantitatively assessed by measurement of lactate dehydrogenase released from damaged or destroyed cells into the supernatants. Lactate dehydrogenase activity was measured using the Lactate Dehydrogenase Detection Kit (A020, Nanjing Jiancheng Bioengineering Institute, Nanjing, China) according to the manufacturer's instruction. Then KCs proliferation was detected using the 3-(4,5-dimethylthiazol-2-yl)-2,5-diphenyltetrazolium bromide (Sigma-Aldrich, Inc., St Louis, MO, USA) colorimetric assay (Zhang et al. Reference Zhang, Zhang, Jin, Zhou, Xie, Guo, Zhang and Qian2001). The assays were performed in sextuplicate from at least 3 independent experiments.
RNA isolation and reverse transcription-polymerase chain reaction (RT-PCR)
KCs plated at 5×10⁵ cells/well in 24-well culture plates were stimulated with rIL-13 (50 ng/ml, 210-13, PeproTech, Rocky Hill, NJ, USA), PAE (100 μg/ml), ABH (50 nmol/ml, as a positive control), AG490 (50 nmol/ml, a specific JAKs inhibitor, as a positive control, 658401, Merck KGaA, Darmstadt, Germany) or medium, and then washed twice with cold PBS. Total RNA was isolated from the KCs using Trizol reagent (15596-026, Invitrogen Life Technologies, Carlsbad, CA, USA) following the manufacturer's instruction. The extracted total RNAs were suspended in 20 μl of RNase-free water and stored at −80°C for subsequent procedures. The quantity and quality of purified RNAs were verified by spectrophotometry and 2% (w/v) agarose gel electrophoresis, respectively. The purified total RNAs were used as templates, and DNase I digestion and first-strand cDNA synthesis were carried out using a Reverse Transcription System (A3500, Promega Biotech Co., Ltd, USA) according to the manufacturer's protocol. cDNA was diluted to 1:10 with nuclease-free distilled water and stored at −20°C.
Semiquantitative RT-PCR of genes was performed using recombinant Taq DNA polymerase (Cinnagene, Tehran, Iran) in a thermocycler (Mastercycler Eppendorf, Hamburg, Germany). Specific primers were designed with the aid of primer 5.0 software based on sequences placed in the NCBI GenBank database and inputted to the BLAST database (NCBI GenBank) to ensure that they had complete homology with our genes of interest. Subsequent to initial denaturation at 95°C for 3 min, cDNAs were subjected to 35 cycles of PCR consisting of denaturation at 95°C for 55 sec, annealing at 55°C for 1 min, and extension at 72°C for 60 sec followed by a final extension step for additional 5 min at 72°C. PCR products were separated onto a 2% agarose gel containing 1 μg/ml ethidium bromide, to determine successful amplification. Images were acquired using a Kodak Image Station 4000R Digital Imaging System (Eastman Kodak Company, Rochester, NY, USA).
Real-time PCR
Quantitative real-time PCR analysis was conducted on a Corbett Rotor Gene 6000 (Corbett Life Sciences, Concorde, Australia). Amplification was performed using SYBR Green PCR Master Mix (Applied Biosystems, CA) with 0·5 μ m of each primer and 4 μl of cDNA. Rotor-Gene 6000 Series software (version 1.7) and Microsoft Office Excel 2003 were used to analyse the results. Amplification conditions in real-time PCR were 1 min at 95°C, pursued by 40 cycles at 95°C for 45 sec, annealing at 55°C for 1 min and extension at 72°C for 30 sec. β-actin expression was used to normalize threshold cycle (Ct) values and gave a control for relative quantitative evaluation of the transcripts abundance.
The primers used in this study include: β-actin, forward, 5′-TGG AAT CCT GTG GCA TCC ATG AAA C-3′, reverse, 5′-TAA AAC GCA GCT CAG TAA CAG TCC-3′ (product size 349 bp); ARG-1, forward, 5′-ATG GAA GAG ACC TTC AGC TAC-3′, reverse, 5′-GCT GTC TTC CCA AGA GTT GGG-3′ (product size 220 bp); NOS-2, forward, 5′-CCC TTC CGA AGT TTC TGG CAG C-3′, reverse, 5′-GGC TGT CAG AGC CTC GTG GCT TTG G-3′ (product size 497 bp); MMR, forward, 5′-GCA AAT GGA GCC GTC TGT GC-3′, reverse, 5′-CTC GTG GAT CTC CGT GAC AC-3′ (product size 280 bp); YM1, forward, 5′-GGG CAT ACC TTT ATC CTG AG-3′, reverse, 5′-CCA CTG AAG TCA TCC ATG TC-3′ (product size 305 bp).
Arginase activity assay and nitrite analysis
Arginase activity assays were carried out as previously described and quantification of urea accumulation in KCs was used as a measure of arginase activity (Pesce et al. Reference Pesce, Ramalingam, Mentink-Kane, Wilson, El Kasmi, Smith, Thompson, Cheever, Murray and Wynn2009). Briefly, KCs plated at 5×10⁴ cells/well in 96-well culture plates were stimulated with rIL-13 (50 ng/ml), PAE (100 μg/ml), ABH (50 nmol/ml), AG490 (50 nmol/ml) or medium. These KCs were then washed once with cold PBS, and lysed with 0·1% Triton X-100 containing protease inhibitor (11697498001, Roche Diagnostics Ltd, Shanghai, China). Lysates were then incubated with 10 μmol/ml of MnCl2 and 50 μmol/ml of Tris-HCl (pH 7·5) to activate enzyme for 10 min at 55°C. After enzyme activation, 25 μl of lysate were removed and added to 25 μl of 1 m arginine (pH 9·7) in a new 96-well plate and incubated for 20 h at 37°C. Five μl of each sample were added in duplicate to a 96-well plate along with 5 μl of each standard, diluted in the same assay conditions, starting at 100 mg/dl. Urea determination reagent from Quantichrom Urea Assay Kit (DIUR-500, BioAssay Systems, Hayward, CA, USA) was used according to the manufacturer's protocol.
Quantification of nitrite accumulation in the supernatant of KCs was used as a measure of NO. The nitrite concentration in cell supernatants was determined using Griess Reagent System (G2930, Promega Biotech Co., Ltd, Madison, Wi, USA) according to the manufacturer's protocol.
Western blotting
To further determine whether PAE has an effect on the expressions of ARG-1 and NOS-2 at protein level and to determine whether PAE can restrain alternative activation of macrophages by inhibiting some signal proteins of the IL-13 signalling pathways in KCs, the expression of ARG-1, NOS-2, JAK2, p-JAK2, STAT6 and p-STAT6 in KCs stimulated with PAE was analysed by Western blotting. KCs plated at 5×10⁵ cells/well in 24-well culture plates were stimulated with rIL-13 (50 ng/ml), PAE (100 μg/ml), ABH (50 nmol/ml), AG490 (50 nmol/ml) or medium, and then washed twice with cold PBS. The treated KCs were lysed and the cell proteins were extracted using Cell Lysis Buffer of Western and IP (P0013, Beyotime Institute of Biotechnology, China), and the total cell protein concentrations were measured using the BCA Protein Assay Kit (P0012, Beyotime Institute of Biotechnology, China).
The KCs proteins (30 μg per lane) from each sample were separated on a sodium dodecyl sulphate-polyacrylamide gel in the presence of pre-stained molecular weight standards, and then transferred to polyvinylidene difluoride membranes. Membranes were blocked for 1 h at room temperature with 5% dry skimmed milk in Tris-buffered saline (20 μmol/ml Tris-HCl, pH 7·6, 137 μmol/ml NaCl plus 0·05% (v/v) Tween 20). Blots were probed overnight at 4°C with the following primary antibodies: rabbit polyclonal anti-ARG-1 IgG (sc-20150, Santa Cruz Biotechnology, Inc., CA, USA, diluted 1:1000); rabbit polyclonal anti-NOS-2 IgG (sc-651, Santa Cruz Biotechnology, diluted 1:2000); rabbit polyclonal anti-JAK2 IgG (sc-7229, Santa Cruz Biotechnology, diluted 1:500); goat polyclonal anti-p-JAK2 IgG (sc-21870, Santa Cruz Biotechnology, diluted 1:500); rabbit polyclonal anti-STAT6 IgG (sc-1698, Santa Cruz Biotechnology, diluted 1:800); goat polyclonal anti-p-STAT6 IgG (sc-11762, Santa Cruz Biotechnology, diluted 1:800); anti-β-actin antibodies (BM0627, Wuhan Boster Biological Technology Ltd, China, diluted 1:400), then were followed by incubation with the appropriate horseradish peroxidase-conjugated secondary antibodies at different dilutions for 2 h, and finally were washed with Tris-buffered saline containing 0·1% Tween 20. Detection was achieved by enhanced chemiluminescence using SuperSignal West Femto Maximum Sensitivity Substrate (34094, Pierce Biotechnology Inc., Rockford, IL, USA) and exposed to film. The signal bands were scanned using a Kodak Image Station 4000R Digital Imaging System (Eastman Kodak Company, Rochester, NY, USA) and quantified using Kodak molecular imaging software (version 4.0). Mouse β-actin was used as an internal control to normalize the expression of target proteins.
Statistical analysis
Data were expressed as means±standard deviation (mean±s.d.) from independent experiments, and were assessed by one-way ANOVA with post-hoc Bonferroni testing. Data were considered statistically significant for P values less than 0·05. These analyses were performed using the GraphPad Prism Version 5.00 (GraphPad Software, San Diego, CA, USA).
RESULTS
Effect of PAE or ABH on KCs viability and growth in vitro
The number of isolated KCs ranged from 4×10⁶ to 5×10⁶ cells per mouse. KCs viability was higher than 93% and the purity reached approximately 96%. The initially isolated KCs that adhered to plates were spherule and some spread their pseudopods 4 h after seeding. To test whether PAE or ABH had any potential toxicity on KCs, the isolated KCs were stimulated with different concentrations of PAE up to 800 μg/ml or ABH up to 200 nmol/ml for 48 h. These KCs grew very well and we did not observe any noticeable abnormal change in morphology of these cultured cells. Cellular viability was above 92%. We also found that there was no statistical significance in lactate dehydrogenase activity and KCs proliferation between KCs stimulated with PAE or ABH and KCs unstimulated with PAE or ABH (data not shown). These data indicated that both PAE and ABH had no toxicity to KCs in culture. So PAE and ABH could be used in the subsequent experiments.
PAE attenuates hepatic granuloma, fibrosis and reduces liver ARG-1, IL-13 and p-STAT6 expression
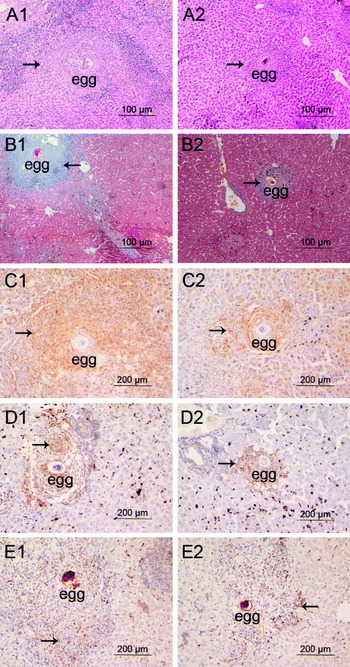
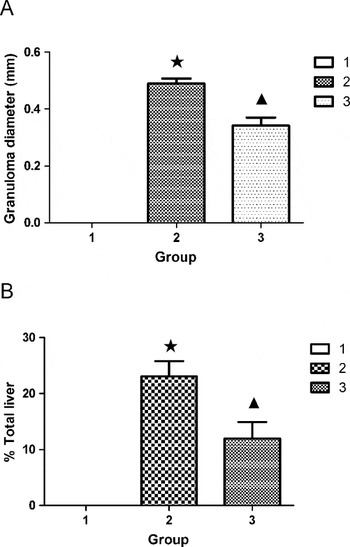
Serum HA levels, worm burden, liver tissue egg load, granuloma diameter and volume density markedly increased in the model group compared with the control group (Table 1, Figs 1 and 2). Meanwhile, except for NOS-2, Hyp contents, collagen, ARG-1, IL-13, p-STAT6 expressions in liver were significantly increased in the model group too (Table 1, Fig. 1). However, serum HA levels, granuloma diameter, ganuloma volume density, Hyp contents, collagen, ARG-1, IL-13 and p-STAT6 expressions significantly decreased, except for worm burden, liver tissue egg load and NOS-2, in the PAE group compared with the model group (Table 1, Figs 1 and 2).
Effect of PAE on serum HA, worm burden, egg load, fibrosis, Arg-1, NOS-2, IL-13 and p-STAT6

* P<0·05, as compared with the corresponding control group;
# P<0·05, as compared with the corresponding model group;
∆ P>0·05, as compared with the corresponding control group;
□ P>0·05, as compared with the corresponding model group.
Effect of PAE on liver histopathogy of schistosomiasis japonica mice. Liver tissue microarray sections from model group and PAE group mice were stained with haematoxylin and eosin (A1, A2, the arrow identifies the granuloma), Masson's trichrome (B1, B2, the arrow identifies the deposition of collagen), anti-ARG-1 Ab (C1, C2, the arrow shows the positive staining), anti-IL-13 Ab (D1, D2, the arrow shows the positive staining) and anti-p-STAT6 Ab (E1, E2, the arrow shows the positive staining).

Effect of PAE on diameter and volume density of hepatic granuloma in mice. (A) Mean hepatic granuloma diameter (in mm); (B) mean hepatic granuloma volume density. 1, Control group; 2, model group; 3, PAE group. ★, P<0·05, as compared with the control group; ▲, P<0·05, as compared with the model group. Each bar represents the mean and standard deviation.

PAE down-modulates expression of ARG-1, NOS-2, MMR and YM1 in KCs from Schistosoma japonicum-infected mice
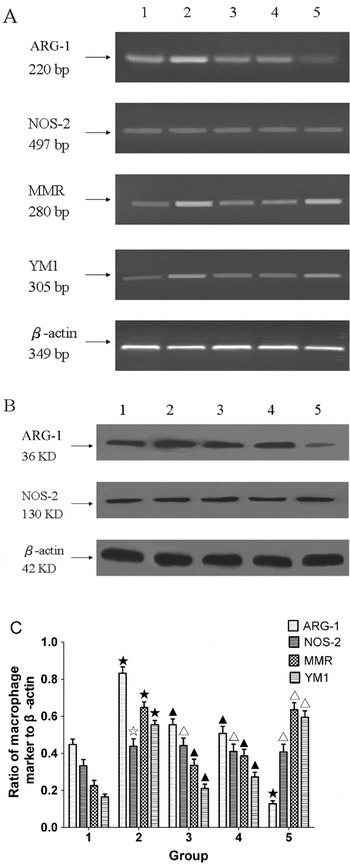
To further confirm whether PAE could inhibit expressions of ARG-1, NOS-2, MMR and YM1 in KCs, we detected these expressions in KCs from the control, the model and the PAE groups of mice, and in KCs from the the model group of mice stimulated in vitro with PAE (100 μg/ml) or ABH (50 nmol/ml). Except for NOS-2, expression of ARG-1, MMR and YM1 mRNA markedly increased in the model group, yet remarkably reduced in the PAE group. In addition, when KCs from the model group were stimulated with PAE in vitro, ARG-1, MMR and YM1 mRNA expressions also notably decreased in the KCs compared with those in the KCs from the model group; Similarly, when KCs from the model group were stimulated with ABH in vitro, ARG-1 mRNA expression was significantly downregulated. However, NOS-2, MMR and YM1 mRNA expressions were not noticeably affected by ABH (Fig. 3A,C). Meanwhile, PAE had a similar effect on ARG-1 and NOS-2 expression at protein level confirmed by Western blotting (Fig. 3B).
Effect of PAE on expression of ARG-1, NOS-2, MMR and YM1 at gene and protein level in KCs from mice. (A) Gene expression of ARG-1, NOS-2, MMR and YM1 was analysed by semiquantitative RT-PCR; (B) protein expression of ARG-1, NOS-2 was analysed by Western blotting; (C) gene expression of ARG-1, NOS-2, MMR and YM1 was measured by real-time PCR, and the result expressed as the ratio of macrophage marker mRNA to β-actin mRNA has been shown by a histogram. 1, KCs from the control group mice, then stimulated with medium for 24 h; 2, KCs from the model group mice, then stimulated with medium for 24 h; 3, KCs from the PAE group mice, then stimulated with medium for 24 h; 4, KCs from the model group mice, then stimulated with PAE for 24 h; 5, KCs from the model group mice, then stimulated with ABH for 24 h. ★, P<0·05, as compared with the KCs from the control group mice; ▲, P<0·05, as compared with the KCs from the model group mice; ☆, P>0·05, as compared with the KCs from the control group mice; △, P>0·05, as compared with the KCs from the model group mice. Each bar represents the mean and standard deviation.

PAE diminishes ARG-1 activity in KCs from Schistosoma japonicum-infected mice
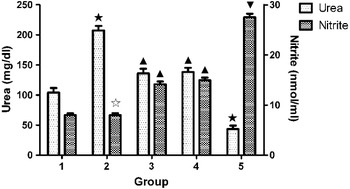
Urea concentration was noticeably increased in the model group, while notably reduced in the PAE group. Additionally, when KCs from the model group were stimulated with PAE in vitro, urea concentration also notably decreased in the KCs compared with that in the KCs from the model group; Similarly, when KCs from the model group were stimulated with ABH in vitro, urea concentration was also significantly downregulated. Nitrite concentration did not change in the model group compared with that in the control group, yet remarkably increased in the PAE group compared with the model group. Additionally, when KCs from the model group were stimulated with PAE in vitro, nitrite concentration also notably increased in the supernatant of KCs compared with that in the supernatant of KCs from the model group; However, when KCs from the model group were stimulated with ABH in vitro, the nitrite concentration was upregulated more significantly than in the supernatant of KCs from the model group, which were stimulated with PAE in vitro (Fig. 4).
Effects of PAE on ARG-1 activity and nitrite production in KCs from mice. 1, KCs from the control group mice, then stimulated with medium for 24 h; 2, KCs from the model group mice, then stimulated with medium for 24 h; 3, KCs from the PAE group mice, then stimulated with medium for 24 h; 4, KCs from the model group mice, then stimulated with PAE for 24 h; 5, KCs from the model group mice, then stimulated with ABH for 24 h. ★, P<0·05, as compared with the KCs from the control group mice; ▲, P<0·05, as compared with the KCs from the model group mice; ☆, P>0·05, as compared with the KCs from the control group mice; ▼, P<0·05, as compared with the KCs from the model group mice, then stimulated with PAE. Each bar represents the mean and standard deviation.

PAE reduces production of IL-13 from SEA-stimulated lymphocytes
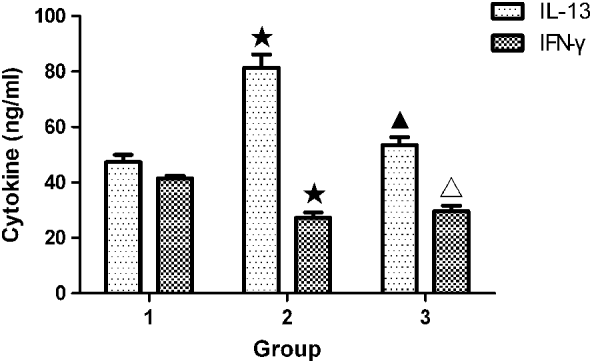
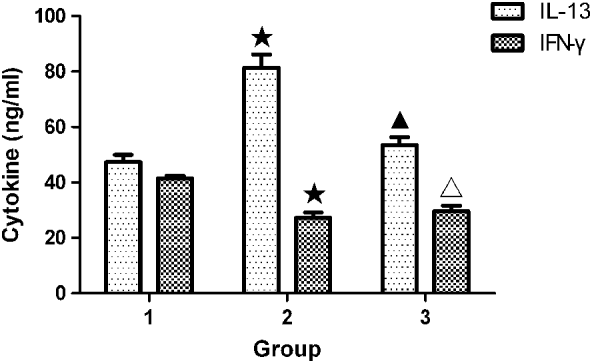
The IL-13 concentration was increased in the model group, yet notably decreased in the PAE group. Meanwhile, the IFN-γ concentration markedly decreased in the model group, and was maintained at a low level in the PAE group (Fig. 5).
Effect of PAE on production of cytokines from SEA-stimulated lymph node cells isolated from mesenteric lymph nodes of mice. 1, Control group; 2, model group; 3, PAE group. ★, P<0·05, as compared with the control group; ▲, P<0·05, as compared with the model group; △, P>0·05, as compared with the model group. Each bar represents the mean and standard deviation.
PAE decreases expression of ARG-1, NOS-2, MMR, YM1 mRNA and activity of ARG-1 in KCs stimulated by rIL-13
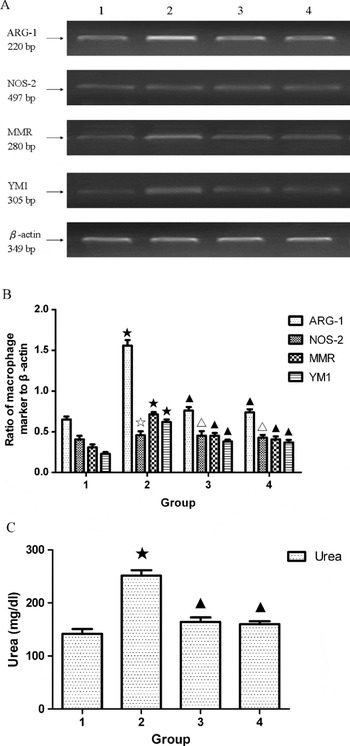
KCs were isolated from the control group mice. These KCs were then stimulated with medium, PAE (100 μg/ml) or AG490 (50 nmol/ml, a specific JAKs inhibitor, as a positive control. 658401, Merck KGaA, Darmstadt, Germany) in vitro for 24 h and then exposed or unexposed to rIL-13 for another 24 h. The results showed that except for NOS-2, expressions of ARG-1, MMR and YM1 mRNA were significantly upregulated in the KCs exposed to rIL-13. However, these mRNA expressions were dramatically downregulated when the KCs exposed to rIL-13 were stimulated by PAE or AG490. Notably, ARG-1 mRNA expression in the KCs stimulated by PAE was almost 2·1-fold lower than that in the KCs stimulated by medium. Nevertheless, neither rIL-13 nor PAE or AG490 had influence on expression of NOS-2 (Fig. 6A, B).
Effects of PAE on expression of ARG-1, NOS-2, MMR, YM1 and activity of ARG-1 in KCs exposed to rIL-13. (A) Gene expression of ARG-1, NOS-2, MMR and YM1 was analysed by semiquantitative RT-PCR; (B) gene expression of ARG-1, NOS-2, MMR and YM1 was measured by real-time PCR, and the result expressed as the ratio of macrophage marker mRNA to β-actin mRNA has been shown by a histogram; (C) activity of ARG-1 in KCs. 1, KCs from the control group mice, then stimulated with medium for 48 h; 2, KCs from the control group mice, stimulated with medium for 24 h, then exposed to rIL-13 for another 24 h; 3, KCs from the control group mice, stimulated with PAE for 24 h, then exposed to rIL-13 for another 24 h; 4, KCs from the control group mice, stimulated with AG490 for 24 h, then exposed to rIL-13 for another 24 h. ★, P<0·05, as compared with the KCs from the control group mice, then stimulated with medium; ▲, P<0·05, as compared with the KCs from the control group mice, stimulated with medium, then exposed to rIL-13; ☆, P>0·05, as compared with the KCs from the control group mice, then stimulated with medium; △, P>0·05, as compared with the KCs from the control group mice, stimulated with medium, then exposed to rIL-13. Each bar represents the mean and standard deviation.

Urea concentration was remarkably enhanced in the KCs exposed to rIL-13. However, urea concentration was markedly reduced when the KCs exposed to rIL-13 were stimulated by PAE or AG490 (Fig. 6C).
PAE restrains alternative activation of macrophages through blocking phosphorylation of JAK2 and STAT6
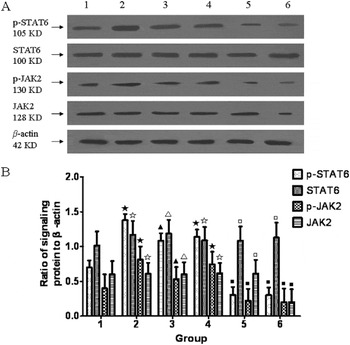
KCs derived from the control, model and PAE groups were cultured in RPMI-1640 medium with 0·5% FCS for 48 h. In addition, KCs from the control group were cultured in medium with added PAE (100 μg/ml) or AG490 (50 nmol/ml) in vitro for 24 h and then exposed to rIL-13 for another 24 h. The results revealed that except for STAT6 and JAK2, the expressions of p-STAT6 and p-JAK2 were upregulated in KCs from the model group, or in KCs from the control group and then exposed to rIL-13 in vitro; however, p-STAT6 and p-JAK2 expressions were downregulated in KCs from the PAE group, or in KCs from the control group and stimulated with PAE, then exposed to rIL-13 in vitro. In addition, p-STAT6, p-JAK2 and JAK2 expressions were downregulated in KCs from the control group and stimulated with AG490, then exposed to rIL-13 in vitro (Fig. 7).
Effect of PAE on protein expression of JAK2, p-JAK2, STAT6 and p-STAT6 in KCs from mice. (A) The levels of JAK2, p-JAK2, STAT6 and p-STAT6 proteins were determined by Western blotting; (B) The ratio of signal density of JAK2, p-JAK2, STAT6 and p-STAT6 proteins to that of β-actin protein. 1, KCs from the control group mice, stimulated with medium for 48 h; 2, KCs from the model group mice, stimulated with medium for 48 h; 3, KCs from the PAE group mice, stimulated with medium for 48 h; 4, KCs from the control group mice, stimulated with medium for 24 h, then exposed to rIL-13 for another 24 h; 5, KCs from the control group mice, stimulated with PAE for 24 h, then exposed to rIL-13 for another 24 h; 6, KCs from the control group mice, stimulated with AG490 for 24 h, then exposed to rIL-13 for another 24 h. ★, P<0·05, as compared with the KCs from the control group mice, stimulated with medium; ▲, P<0·05, as compared with the KCs from the model group mice, stimulated with medium; ▪, P<0·05, as compared with the KCs from the control group mice, stimulated with medium, then exposed to rIL-13; ☆, P>0·05, as compared with the KCs from the control group mice, stimulated with medium; △, P>0·05, as compared with the KCs from the model group mice, stimulated with medium; □, P>0·05, as compared with the KCs from the control group mice, stimulated with medium, then exposed to rIL-13. Each bar represents the mean and standard deviation.

DISCUSSION
IL-13, as the dominant Th2-type cytokine, is the most important inducer of hepatic fibrosis in murine schistosomiasis (Chiaramonte et al. Reference Chiaramonte, Donaldson, Cheever and Wynn1999, Reference Chiaramonte, James, Malley, Donaldson and Wynn2001). IL-13 not only directly stimulates collagen synthesis from HSCs (Li et al. Reference Li, Shen, Zhong, Peng, Wen, Li, Luo and Wei2010; Wynn and Barron, Reference Wynn and Barron2010) but also, as the major ARG-1 inducer, stimulates macrophages to become AAMs which facilitate liver granuloma formation and fibrosis during schistosomiasis (Hesse et al. Reference Hesse, Modolell, La Flamme, Schito, Fuentes, Cheever, Pearce and Wynn2001; Wynn et al. Reference Wynn, Thompson, Cheever and Mentink-Kane2004); moreover, high ARG-1 activity consistently correlates with the formation of large granulomas and extensive fibrosis (Hesse et al. Reference Hesse, Modolell, La Flamme, Schito, Fuentes, Cheever, Pearce and Wynn2001).
Because therapies for chronic inflammatory diseases typically begin long after the initiation of an immune response, novel strategies that target important effector cell functions may prove more effective than traditional approaches targeting Th activity (Hesse et al. Reference Hesse, Modolell, La Flamme, Schito, Fuentes, Cheever, Pearce and Wynn2001). In this study, we observed the effect of IL-13 on the important effector cells, AAMs in mouse hepatic fibrosis with schistosomiasis japonica, and explored the mechanism of PAE inhibiting the alternative activation of macrophages during schistosomiasis japonica.
In our study, when mice were infected by S. japonicum for 8 weeks, they developed severe liver granuloma and fibrosis; meanwhile, they exhibited intensified expressions of ARG-1, IL-13 and p-STAT6 in their liver tissue. When infected mice were treated with PAE, the liver granuloma and fibrosis decreased remarkably; meanwhile, ARG-1, IL-13 and p-STAT6 expressions also attenuated notably without changes in worm burden and egg load. However, NOS-2 expression was weak and relatively unchanged in the liver tissue of infected mice, regardless of whether the infected mice were treated or untreated with PAE. Thus the results suggest that liver granuloma and fibrosis are related to ARG-1, IL-13 and p-STAT6, and PAE ameliorates liver granuloma formation and fibrosis probably through downregulation of the IL-13 signal pathway resulting in inhibition of the alternative activation of macrophages.
To test whether PAE could directly inhibit the alternative activation of macrophages, we investigated the effects of PAE on the expression of specific biomarkers of AAMs and the activity of ARG-1 in KCs exposed to rIL-13. Our results show that liver macrophages are alternatively activated during schistosomiasis japonica. PAE could not only inhibit expression of AAMs specific markers by downregulating ARG-1, MMR and YM1 mRNA levels and ARG-1 protein level, but also could decrease ARG-1 activity, suggesting that PAE could suppress the alternative activation of macrophages. ABH could specifically inhibit ARG-1 mRNA expression. Although PAE or ABH had no effects on NOS-2 expression, PAE or ABH could promote production of NO through inhibiting ARG-1 expression and activity, and as a result, hepatic fibrosis is restrained.
To determine whether PAE also could affect Th1/Th2 cytokine production and thereby indirectly modulate ARG-1 or NOS-2, lymphocytes isolated from mesenteric lymph nodes of mice were stimulated with SEA and the culture supernatants were then assayed for IL-13 and IFN-γ by ELISA. Our results indicated that PAE could obviously induce secretion of IL-13, but had no impact on IFN-γ secretion from lymphocytes in mice infected with S. japonicum, consistent with our previous observations on immunohistochemically stained livers. The results partly explain the reason why PAE can promote macrophages to be activated alternatively instead of classically.
Previous studies indicated that the IL-13 signalling pathway played an important role in the alternative activation of macrophages (Dewals et al. Reference Dewals, Marillier, Hoving, Leeto, Schwegmann and Brombacher2010; Stolfi et al. Reference Stolfi, Caruso, Franze, Sarra, De Nitto, Rizzo, Pallone and Monteleone2010). IL-13 mediates its effects via activation of a complex receptor system in macrophages, then the complex receptor system induces phosphorylation of JAK2, which leads to selective activation of STAT6, a transcription factor that translocates into the nucleus where it binds to the promoter region of target genes, thereby regulating expression of target genes in human macrophages (Roy et al. Reference Roy, Bhattacharjee, Xu, Ford, Maizel and Cathcart2002; Stolfi et al. Reference Stolfi, Caruso, Franze, Sarra, De Nitto, Rizzo, Pallone and Monteleone2010). Thus, JAK2 and STAT6 are key signalling molecules in the control of AAMs-related genes (Stolfi et al. Reference Stolfi, Caruso, Franze, Sarra, De Nitto, Rizzo, Pallone and Monteleone2010). Our data confirmed that IL-13 promoted AAMs-associated marker mRNA expression and ARG-1 activity in macrophages, which indicated that IL-13 could promote alternative activation of macrophages. However, PAE suppressed AAMs-associated marker mRNA expression and ARG-1 activity in KCs exposed to rIL-13, similar to AG490.
We next asked whether PAE directly inhibits the alternative activation of macrophages through reducing the activation of IL-13 signalling molecules, such as JAK2 or STAT6. Previous investigations have documented that AG490 inhibits tyrosine phosphorylation-dependent activation of JAKs and subsequent phosphorylation of STATs proteins in leukaemic cells, vascular smooth muscle cells, T cells and epithelial cells (Xuan et al. Reference Xuan, Guo, Han, Zhu and Bolli2001). Our data demonstrated that IL-13 evoked phosphorylation of JAK2 and STAT6 in KCs. Interestingly, PAE blocked phosphorylation of JAK2 and STAT6, but had no effect on JAK2 and STAT6 protein expression and AG490 inhibited the production of JAK2, leading to reduced phosphorylation of JAK2 and STAT6. However, neither PAE nor AG490 modulated the expression of STAT6 in the KCs. Therefore it is fair to conclude that PAE inhibits the alternative activation of macrophages through blocking phosphorylation of JAK2 and/or STAT6. Consequently the gene expression of AAMs-related markers and the activity of ARG-1 decrease. More interestingly, our previous experiment indicated that IL-13 promoted HSCs proliferation and collagen I secretion; meanwhile, PAE reduced production of collagen I from mouse HSCs through inhibiting phosphorylation of STAT6 (Li et al. Reference Li, Shen, Zhong, Peng, Wen, Li, Luo and Wei2010). So, we would like to point out, on the basis of our results, that PAE attenuates hepatic granuloma and fibrosis of schistosomiasis japonica mice through downregulation of the IL-13 signalling pathway in both HSCs and AAMs. In addition, it has been proposed that AAMs are needed for the activation of HSCs, suggesting that a positive feedback loop exists between these two cell types (Prasse et al. Reference Prasse, Pechkovsky, Toews, Jungraithmayr, Kollert, Goldmann, Vollmer, Muller-Quernheim and Zissel2006).
Taken together, our data suggest that during schistosomiasis japonica, IL-13 secretion from lymphocytes increases and accumulates in liver granulomas, consequently inducing vicinal macrophages to be activated alternatively with a marked increase in expression of signature biomarkers, such as ARG-1, MMR and YM1, and significant elevation in the activity of ARG-1 through IL-13 signalling. PAE can attenuate liver granuloma and fibrosis. On the one hand, PAE directly inhibits the alternative activation of macrophages via reducing the phosphorylation of JAK2 and/or STAT6, leading to reduction of AAMs-associated biomarkers and ARG-1 activity. On the other hand, PAE indirectly suppresses alternative activation of macrophages through decreasing the production of IL-13 from lymphocytes. Additionally, when ARG-1 expression and activity decrease, L-arginine will accumulate and be oxidized by NOS-2 to produce NO. As a result, liver granuloma and fibrosis are dramatically reduced.
Our results conflict with those published by Pesce's group showing that mice with depletion of ARG-1 activity specifically in AAMs exacerbate the development of liver fibrosis during schistosomiasis mansoni (Pesce et al. Reference Pesce, Ramalingam, Mentink-Kane, Wilson, El Kasmi, Smith, Thompson, Cheever, Murray and Wynn2009). The reason for this apparent discrepancy remains unknown, although the difference between the schistosome mouse models might explain this.
On the whole, in this report, we present evidence for the first time that PAE relieves liver granuloma and fibrosis through suppression of the alternative activation of macrophages directly and indirectly. Our results suggest that inhibition of hepatic alternatively activated macrophages might be a potential and effective anti-fibroplastic strategy and PAE might be a promising prophylactic agent for hepatic fibrosis of schistosomiasis japonica.
FINANCIAL SUPPORT
The work was funded by the National Natural Science Foundation of China (grant number 30872209); Anhui Provincial Higher Education Science Research Project (grant number KJ2008B282); Doctoral funds AMU (grant number XJ200708); Doctoral funds of Ministry of Education of China (grant number 200803660003).