Introduction
Climate change affects livestock production on grasslands directly via an increased occurrence of heat stress, and indirectly via an effect on grass growth. Numerous models are used to simulate the effects of climate change on production of forages or feed crops. However, models simulating the direct effects of climate change on livestock production are less abundant. Heat stress is studied with thermoregulation models simulating heat flows in animals. We incorporated a thermoregulation model in a model to simulate growth and production of beef cattle, named LiGAPS-Beef (Livestock simulator for Generic analysis of Animal Production Systems – Beef cattle) (Van der Linden et al., Reference Van der Linden, Oosting, Van de Ven, De Boer and Van Ittersum2016).
Grass sward and animals strongly interact in grazing systems. Animals defoliate grass and affect grass growth and quality, whereas grass growth and quality affect the feed intake and growth of animals. Projections for livestock production under climate change require, therefore, to account for the effects of climate change on grass growth and animal growth simultaneously. The aim of this research is to explore the direct and indirect effects of climate change on grass-based beef production with LiGAPS-Beef in combination with a grass growth model.
Material and methods
Effects of climate change on beef production were investigated for grass-based farming systems in the Charolais Basin of France with weaned Charolais bull calves under continuous grazing. In this modelling study, grasslands were assumed to be represented by swards of perennial ryegrass (Lolium perenne L.), and the diet consisted of fresh ryegrass only. Weaned bulls (initial age 210 days; live weight 315 kg) were simulated during the grazing season, which ranges from 25 March to 10 December. The model LINGRA (Light INterception and utilization-GRAss) was used to simulate the production of perennial ryegrass (Schapendonk et al., Reference Schapendonk, Stol, van Kraalingen and Bouman1998). This model was used to simulate water-limited grass production, and accounts for the crop genotype, climate and water availability (soil water holding capacity 0.15 cm3/cm3). The model LiGAPS-Beef was used to simulate feed-limited growth of beef cattle and beef production. The term beef is defined here as deboned carcass weight.
LiGAPS-Beef and LINGRA were connected by representing the following processes: heading and its effects on nutritional quality of the pasture (metabolisable energy and CP content), defoliation resulting from feed intake by cattle, trampling, selective grazing and confined grass intake at low pasture biomass. Beef production was named limited under water-limited grass growth and feed-limited cattle growth. Beef production per hectare was simulated for stocking densities between 0.5 and 8.0 head/ha, with intermediate steps of 0.5 head/ha. Limited beef production per hectare was the beef production under the optimal stocking density, which is a seven-year average in this research. Actual beef production for grass-based beef production systems was estimated based on Réseaux d’Élevage Charolais (Reference Réseaux d’Élevage2012). Production per hectare and feed efficiency (FE) were calculated according to Van der Linden et al. (Reference Van der Linden, Van de Ven, Oosting, Van Ittersum and De Boer2015). The (relative) yield gap was calculated according to Van Ittersum et al. (Reference Van Ittersum, Cassman, Grassini, Wolf, Tittonell and Hochman2013).
Historic weather data were selected for Charolles (46.4°N, 4.3°E), France for 1999–2006 (reference climate). The representative concentration pathways (RCPs) 2.6 (smallest projected climate change) and 8.5 (largest climate change) were used to assess beef production in 2050. Temperature and CO2 concentration increased 0.7°C and 71 ppm between the reference climate and 2050 under RCP 2.6, whereas rainfall decreased 4.5%. Temperature and CO2 concentration increased 1.9°C and 168 ppm under RCP 8.5, and rainfall decreased 7.1%.
Results and discussion
Limited beef production was 452 kg/ha under the reference climate, and actual production was estimated at 265 kg/ha. This indicates a relative yield gap of 41%, which suggests considerable scope to increase beef production. The yield gap could only be calculated for the reference climate as actual production is unknown with future climate change. Relative yield gaps in crop-livestock systems are assumed to be at least 36%, and mitigation of this gap is generally not economically attractive or practically feasible (Van der Linden et al., Reference Van der Linden, Van de Ven, Oosting, Van Ittersum and De Boer2015). As the relative yield gap of 41% is close to 36%, increasing beef production may not be an option for the present beef production system due to economic or practical constraints.
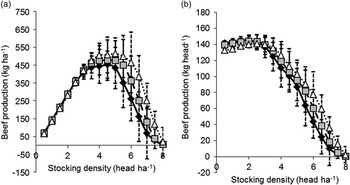
The yield gap might be explained by nutrient limitation in the grass (e.g. nitrogen, phosphorus, potassium), however this was not included in the version of LINGRA used. Diseases and stress in cattle, and pests, diseases and weeds in grassland may cover part of the yield gap as well, and farm management aspects too. Predicted limited beef production per hectare had a larger standard error at near-optimal stocking densities (4 to 5 head/ha) than at sub-optimal stocking densities (e.g. 3 head/ha) (Figure 1a). Farmers might opt, therefore, for sub-optimal stocking densities, reducing variation and associated risks in beef production. The average limited beef production per hectare and per head (Figure 1) resemble the outcomes of the Jones–Sandland equations (Jones and Sandland, Reference Jones and Sandland1974).
Limited beef production per hectare of grassland (a) and per head (b) for Charolais bull calves, under the reference climate (Reference, 1999–2006), and under Representative Concentration Pathway (RCP) 2.6 and RCP 8.5 in 2050. Bars indicate standard errors. Solid line with diamonds=reference; dashed line with grey squares=RCP 2.6; dotted line with white triangles=RCP 8.5.

Limited beef production was 477 kg/ha under RCP 2.6 (+5.5% compared with the reference climate), and 514 kg/ha under RCP 8.5 (+13.8%) (Figure 1a). Whether actual production can be increased at similar rates depends also on factors not included in the models. Average optimum stocking densities under feed-limited production were 4.3, 4.6, and 4.9 head/ha under the reference climate, RCP 2.6 and RCP 8.5, respectively. The average number of days with reductions in feed intake due to heat stress was 15.8 days under the reference climate, 17.8 days under RCP 2.6 and 25.3 days under RCP 8.5. The average beef production per head increased with increasing stocking density, and reached an optimum before decreasing at further increase of stocking density (Figure 1b). This is explained by a lower defoliation rate at lower stocking densities, which results in less regrowth of fresh biomass and more standing biomass. Higher temperatures under climate change increased the development rate of the standing biomass and decreased consecutively the metabolisable energy content and FE.
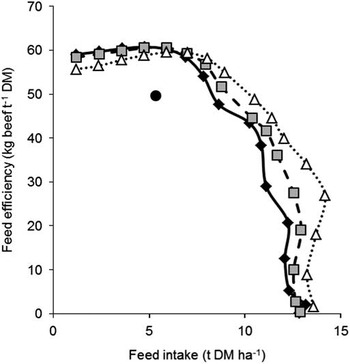
Climate change decreased the FE at stocking densities below 2.5 head/ha. At higher stocking densities, average FE and feed intake were higher under climate change than under the reference climate, with the highest increases under RCP 8.5 (Figure 2). This is explained by a higher grass production under increased CO2 concentrations. The performance of crop growth models needs to be evaluated further with data from experiments where projected climate conditions are mimicked. The integrated package with LiGAPS-Beef and LINGRA needs to be evaluated against data from grazing systems also.
Feed intake and feed efficiency of bull calves under limited and actual beef production. Solid line with diamonds=limited production under the reference climate (1999–2006); dashed line with grey squares=limited production under representative concentration pathway (RCP) 2.6 in 2050; dotted line with white triangles=limited production under RCP 8.5 in 2050; black circle=actual production.

Conclusions
Exploring the effects of climate change on beef production in grass-based systems by integrating a crop and a livestock model, indicated that climate change increased limited beef production of Charolais bull calves by 5.5% to 13.8% in 2050. These results do not indicate directly the increase for actual beef production that can be anticipated, because economic and practical constraints were not considered. However, the integrated models showed that there is scope to intensify grass-based beef production and mitigate the relative yield gap (41%) under the current climate from a bio-physical perspective.
Acknowledgements
This research is part of the Wageningen UR strategic programme ‘Mapping for sustainable intensification’, 2012–2016, funded by the strategic funds of Wageningen UR, and the PE&RC and WIAS graduate schools of Wageningen University.