1. Introduction
The Arctic is warming faster than almost all other parts of our planet (IPCC, 2014). This phenomenon is consistent with ‘polar amplification’ (Lee, Reference Lee2014) where any change in planetary-scale net radiation balance, irrespective of whether ice is present at the poles or not, produces larger temperature changes at higher latitudes than in equatorial regions. Polar amplification is no better illustrated than in the Arctic during past episodes of extreme warmth, such as in the early Late Cretaceous. Polar amplification makes Arctic palaeoclimate proxies sensitive recorders of global change phenomena, and by studying warm Arctic conditions we can derive the most reliable insights into future climate, and linked biospheric responses, at high northern latitudes.
The current warming of the Arctic is dramatic, and perhaps inevitably most investigations into the Late Cretaceous palaeoclimate of the region have focused on the ancient thermal regime (e.g. Spicer & Parrish, Reference Spicer and Parrish1986; Spicer & Corfield, Reference Spicer and Corfield1992; Herman & Spicer, Reference Herman and Spicer1996a, Reference Herman and Spicer1997a; Amiot et al. Reference Amiot, Lecuyer, Beuffetaut, Frédéric, Legendre and Meartineau2004; Spicer & Herman, Reference Spicer and Herman2010; Herman et al. Reference Herman, Spicer and Spicer2016), but arguably more important is the polar hydrological cycle. In today’s ‘coldhouse’ world a strong polar high-pressure cell leads to a relatively dry Arctic, and only low temperatures, and thus low evaporation, prevent widespread aridity. However, in a warmer world a weaker polar high, and thus a weaker polar front, would have profound implications for global atmospheric circulation (including phenomena such as polar vortex outbreaks) and the water cycle.
It is possible that in the Late Cretaceous a warm Arctic Ocean generated vigorous ocean–atmosphere feedbacks that helped sustain that ocean warmth while also producing a more or less permanent Arctic cloud cap (Spicer et al. Reference Spicer, Herman, Yang and Spicer2014), but atmospheric hydrology is poorly constrained through a lack of reliable proxies. The focus of this work is to re-examine the Arctic early Late Cretaceous climate and introduce new quantitative proxy palaeo-humidity measurements in order to characterize better the polar environment at times of global warmth.
Late Cretaceous Arctic sediments of Alaska and NE Russia, collectively referred to here as the North Pacific Region (NPR) (Fig. 1), host a wealth of palaeontological evidence attesting to a highly diverse extinct ecosystem thriving under a temperate and humid climate at palaeolatitudes as high as 82° N (Fig. 2). The rich plant fossil record from the NPR has been investigated for more than a century (see background reviews in http://arcticfossils.nsii.org.cn) and is well documented in a large body of work (e.g. Hollick, Reference Hollick1930; Samylina, Reference Samylina1963, Reference Samylina1968, Reference Samylina1973, Reference Samylina1974, Reference Samylina1976, Reference Samylina1988; Lebedev, Reference Lebedev1965, Reference Lebedev1976, Reference Lebedev1987, Reference Lebedev1992; Smiley, Reference Smiley1966, Reference Smiley1969a, b; Budantsev, Reference Budantsev1968; Filippova, Reference Filippova1975a, b, Reference Filippova1979, Reference Filippova1988, Reference Filippova1989, Reference Filippova1994; Krassilov, Reference Krassilov1975, Reference Krassilov1978; Kiritchkova & Samylina, Reference Kiritchkova and Samylina1978; Scott & Smiley, Reference Scott and Smiley1979; Detterman & Spicer, Reference Detterman and Spicer1981; Budantsev, Reference Budantsev1983; Spicer, Reference Spicer, Spicer and Thomas1986, Reference Spicer1987; Spicer & Parrish, Reference Spicer and Parrish1986, Reference Spicer and Parrish1990a, b; Spicer et al. Reference Spicer, Wolfe and Nichols1987, Reference Spicer, Parrish, Grant, McCabe and Parrish1992, Reference Spicer, Rees, Chapman, Allen, Hoskins, Sellwood, Spicer and Valdes1993; Golovneva, Reference Golovneva1988, Reference Golovneva1991a, b, Reference Golovneva1994a, b, Reference Golovneva and Hart2000; Grant et al. Reference Grant, Spicer and Parrish1988; Parrish & Spicer, Reference Parrish and Spicer1988a, b; Lebedev & Herman, Reference Lebedev and Herman1989; Herman, Reference Herman, Knobloch and Kvaček1990, Reference Herman, Herman and Lebedev1991, Reference Herman1993, Reference Herman, Boulter and Fisher1994, Reference Herman2002, Reference Herman2007, Reference Herman2011, Reference Herman2013; Spicer & Chapman, Reference Spicer and Chapman1990; Herman & Lebedev, Reference Herman and Lebedev1991; Herman & Shczepetov, Reference Shczepetov1991; Samylina & Shczepetov, Reference Samylina and Shczepetov1991; Shczepetov, Reference Shczepetov1991, Reference Shczepetov1995; Golovneva & Herman, Reference Golovneva and Herman1992; Shczepetov et al. Reference Shczepetov, Herman and Belaya1992; Spicer & Corfield, Reference Spicer and Corfield1992; Filippova & Abramova, Reference Filippova and Abramova1993; Herman & Spicer, Reference Herman and Spicer1995, Reference Herman and Spicer1996b, Reference Herman and Spicer1997a, b; Herman et al. Reference Herman, Spicer, Kvaček and Wagreich2002, Reference Herman, Akhmetiev, Kodrul, Moiseeva and Iakovleva2009, Reference Herman, Golovneva, Shczepetov and Grabovsky2016, Reference Herman, Kostyleva, Nikolskii, Basilyan and Kotel’nikov2019; Spicer et al. Reference Spicer, Ahlberg, Herman, Kelley, Raikevich and Rees2002; Craggs, Reference Craggs2005; Golovneva & Alekseev, Reference Golovneva, Alekseev and Budantsev2010; Spicer & Herman, Reference Spicer and Herman2010; Tomsich et al. Reference Tomsich, McCarthy, Fowell and Sunderlin2010; Golovneva et al. Reference Golovneva, Shchepetov and Alekseev2011, Reference Golovneva, Herman and Shczepetov2015; Alekseev et al. Reference Alekseev, Herman and Shchepetov2014; Shczepetov & Golovneva, Reference Shczepetov and Golovneva2014; Golovneva & Shchepetov, Reference Golovneva and Shchepetov2015; Herman & Sokolova, Reference Herman and Sokolova2016; Vasilenko et al. Reference Vasilenko, Maslova and Herman2016; Nikitenko et al. Reference Nikitenko, Devyatov, Lebedeva, Basov, Goryacheva, Pestchevitskaya and Glinskikh2017, Reference Nikitenko, Devyatov, Lebedeva, Basov, Fursenko, Goryacheva, Pestchevitskaya, Glinskikh and Khafaeva2018; Shczepetov & Herman, Reference Shczepetov and Herman2017). While not exhaustive, these works attest to the richness and intensity of study that the Cretaceous Arctic floras have attracted despite the logistic difficulties of working in remote regions. A brief synthesis is given here.
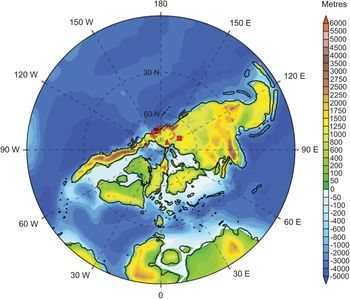
Map of the modern North Pacific Region (NPR) showing the locations of the fossil assemblages investigated here. Vilui – Cenomanian; Arman River – Coniacian; Novaya Sibir – Turonian; Kaivayam – Coniacian; Penzhina – Turonian; Grebenka – Cenomanian; Tylpergyrgynai – Coniacian; North Slope – Coniacian. Details of the stratigraphy and sedimentary successions at each site are given at http://arcticfossils.nssi.org.cn.

North Polar projection of Turonian palaeogeography based on Getech Plc. reconstructions. Positions of fossil localities indicated by the following symbols: square – Vilui River; diagonal cross – Arman River; triangle – Novaya Sibir (New Siberia Island); inverted triangle – Grebenka River; diamond – Penzhina; star (partly hidden by the diamond) – Kaivayam; circle – Tylpergyrgynai; horizontal cross – North Slope.

1.a. Early Late Cretaceous Arctic forests
In the early Late Cretaceous at latitudes above the palaeo-Arctic Circle (∼66° N) forests were conifer-dominated and at high latitudes almost exclusively deciduous (Parrish & Spicer, Reference Parrish and Spicer1988b; Spicer & Parrish, Reference Spicer and Parrish1990b; Spicer & Herman, Reference Spicer and Herman2001, Reference Spicer and Herman2010; Spicer et al. Reference Spicer, Ahlberg, Herman, Kelley, Raikevich and Rees2002; Herman et al. Reference Herman, Spicer and Spicer2016). Key canopy-forming taxa were predominantly Cephalotaxopsis, Elatocladus, Pityophyllum, Araucarites, Sequoia reichenbachii and Pagiophyllum, while angiosperms were most abundant as understorey elements and along-stream sides (Spicer & Herman, Reference Spicer and Herman2010; Herman et al. Reference Herman, Spicer and Spicer2016), but were non-existent or rare in swamp or mire forests (Spicer et al. Reference Spicer, Parrish, Grant, McCabe and Parrish1992). Evergreen elements were regionally comparatively rare and restricted to conifers such as Araucarites, Pagiophyllum and Geinitzia (http://arcticfossils.nsii.org.cn) characterized by having small hook- and scale-like xeromorphic leaves that reduced water loss during winter dormancy. Ground cover consisted mostly of ferns and sphenophytes (Herman et al. Reference Herman, Spicer and Spicer2016), but towards the end of the Late Cretaceous, even at the highest latitudes, herbaceous angiosperms (probably annuals and preserved only as pollen) contributed to the ground cover, especially in areas disturbed by wildfires or along river margins (Frederiksen et al. Reference Frederiksen, Ager and Edwards1988; Herman et al. Reference Herman, Spicer and Spicer2016). A comprehensive illustrated catalogue of Late Cretaceous polar forest megafossils is available online at http://arcticfossils.nsii.org.cn.
Preserved standing isolated trees (Herman et al. Reference Herman, Spicer and Spicer2016) and even ‘fossil forests’ are not uncommon in Late Cretaceous floodplain successions of the NPR. Stands of straight upright trunks up to 4.5 m tall and 0.7 m in diameter have been reported from northern Alaska (Decker et al. Reference Decker, Wilson, Watts, Work, Cloughand and Larson1997), and evidence that these represent mire forests comes from the observation they are rooted in coals and carbonaceous mudstones. These standing trees attest not only to the stature and structure of the mire forests, but periodic extremely high sedimentation rates, suggesting intense rainfall events, river channel breakouts and associated flooding.
Occasionally fossil wood is structurally preserved, and to-date all wood specimens recovered have been coniferous, with well-developed growth rings, typically showing sharp transitions between summer growth and winter dormancy (Parrish & Spicer, Reference Parrish and Spicer1988a; Spicer & Parrish, Reference Spicer and Parrish1990a; Herman et al. Reference Herman, Spicer and Spicer2016). Summer-wood rings in Cenomanian age trees tend to be wide, with typically >100 cells produced each growing season and few false rings (Parrish & Spicer, Reference Parrish and Spicer1988a; Herman et al. Reference Herman, Spicer and Spicer2016), showing that growth was largely uninterrupted during the summer season, but Maastrichtian woods have narrow early (summer) rings with few smaller cells and numerous false rings indicative of frequent interruptions to growth, most likely caused by temperatures falling below 10 °C (Spicer & Parrish, Reference Spicer and Parrish1990a; Spicer & Herman, Reference Spicer and Herman2010; Herman et al. Reference Herman, Spicer and Spicer2016).
1.b. Insolation and general thermal regime
As far as can be determined, Earth’s rotational and magnetic poles were roughly coincidental in the Late Cretaceous, and obliquity, and thus the high-latitude light regime, was similar to that of today (Lottes, Reference Lottes1987), meaning that Arctic winters in near-polar settings were characterized by several months of darkness (Figs 3–5). Despite this lack of direct insolation, polar winters along the coastlines of the Arctic Ocean were surprisingly warm, experiencing temperatures that remained above freezing for much of the time (Spicer & Parrish, Reference Spicer and Parrish1990b; Herman & Spicer, Reference Herman and Spicer1996a, Reference Herman and Spicer1997a; Herman et al. Reference Herman, Spicer and Spicer2016). While the temperature regime of the Late Cretaceous Arctic has been well characterized through multiple proxies, the hydrological system is less well constrained.
Light, thermal and humidity regime for fossil assemblages at palaeolatitude ∼80° N.

Light, thermal and humidity regime for fossil assemblages at palaeolatitude ∼75° N.

Light, thermal and humidity regime for fossil assemblages at palaeolatitude ∼70° N.

1.c. Research scope
In this work we re-examine the thermal regime of this extinct early Late Cretaceous (Cenomanian to Coniacian) polar ‘Lost World’ in the light of new high spatial resolution (∼1 km) WorldClim2 (Fick & Hijmans, Reference Fick and Hijmans2017; www.worldclim.org/) calibrations of the non-taxonomic leaf physiognomic proxy known as CLAMP (http://clamp.ibcas.ac.cn), but the main focus is to explore new insights into the hydrological regime. We examine not only precipitation and soil moisture capacity, but humidity in terms of specific humidity (SH), relative humidity (RH), vapour pressure deficit (VPD) and potential evapotranspiration (PET). VPD and PET are investigated in respect of annual average values and seasonal variations.
2. Methods and materials
Individual plants are spatially static, so they have to be well adapted to their local environment or they die as a direct result of environmental stress or competition from those better equipped to withstand the prevailing conditions. These adaptations, preserved in the abundant early Late Cretaceous plant fossil record of the NPR, can be used to determine past conditions either as average annual or seasonal climate, as in the case of leaf form, or as a near-daily record of environmental change encoded as variations in wood growth (tree rings). By using both leaf form and tree ring data (Herman et al. Reference Herman, Spicer and Spicer2016) we can quantify the early Late Cretaceous high Arctic atmospheric conditions over seasonal or even sub-seasonal temporal resolutions.
The principal leaf-based palaeoclimate proxy for assessing a range of climate variables is known as CLAMP (Climate Leaf Analysis Multivariate Program) (http://clamp.ibcas.ac.cn) (Wolfe, Reference Wolfe1993; Kovach & Spicer, Reference Kovach and Spicer1996; Yang et al. Reference Yang, Spicer, Spicer and Li2011, Reference Yang, Spicer, Spicer, Arens, Jacques, Su, Kennedy and Herman2015). CLAMP utilizes the universal relationships that exist between leaf form in woody dicotyledonous plants and an array of climate variables. On a global scale, aggregate leaf form in a stand of vegetation is more strongly determined by climate than by taxonomic composition (Yang et al. Reference Yang, Spicer, Spicer, Arens, Jacques, Su, Kennedy and Herman2015), and through a combination of pleiotropy and integrated developmental pathways all leaf traits are correlated with each other (Pigliucci, Reference Pigliucci2003) and an array of climate variables (Wolfe, Reference Wolfe1993; Wolfe & Spicer, Reference Wolfe, Spicer, Jones and Rowe1999; Yang et al. Reference Yang, Spicer, Spicer and Li2011, Reference Yang, Spicer, Spicer, Arens, Jacques, Su, Kennedy and Herman2015). Using a multivariate statistical engine, CLAMP decodes these relationships and, by scoring fossil leaf traits the same way as for living vegetation growing under known climatic regimes, estimates of past conditions can be obtained (http://clamp.ibcas.ac.cn).
No proxy is perfect, so a multiproxy approach should be used where possible. For the high Late Cretaceous Arctic, CLAMP and oxygen isotopes from marine (Zakharov et al. Reference Zakharov, Boriskina, Ignatyev, Tanabe, Shigeta, Popov, Afanansyeva and Maeda1999, Reference Zakharov, Shigeta, Popov, Velivetskaya and Afanansyeva2011) and non-marine vertebrate remains (Amiot et al. Reference Amiot, Lecuyer, Beuffetaut, Frédéric, Legendre and Meartineau2004) all give broadly similar estimates (Herman & Spicer, Reference Herman and Spicer1997a; Amiot et al. Reference Amiot, Lecuyer, Beuffetaut, Frédéric, Legendre and Meartineau2004; Spicer & Herman, Reference Spicer and Herman2010; Herman et al. Reference Herman, Spicer and Spicer2016), increasing confidence in the fidelity of all the proxies. However, all proxies depend on modern observations for their calibration, and several modern observational datasets are available, each with its own characteristics.
2.a. CLAMP calibration
Previous CLAMP analyses of Late Cretaceous Arctic leaves have been based on modern gridded climate observations recorded between 1961 and 1990 at a spatial resolution of 0.5 × 0.5° (New et al. Reference New, Hulme and Jones1999), with interpolations and altitude corrections to the exact location of the vegetation stands comprising the CLAMP training sets (www.paleo.bristol.ac.uk/ummodel/scripts/html_bridge/clamp_UEA.html). This calibration dataset is known as GridMet_3br (http://clamp.ibcas.ac.cn). Higher spatial resolution data are also available using the same observational network of meteorological stations. One such dataset is that of WorldClim2 (http://worldclim.org/version2) (Fick & Hijmans, Reference Fick and Hijmans2017), which interpolates average meteorological observations between 1970 and 2000 onto a spatial grid approximating to 1 km2.
One advantage of using WorldClim2 for calibration is that numerous environmental variables have been mapped onto the same grid, so by using CLAMP the range of environmental signals decoded from leaf form can be extended. The new temperature-related environmental variables that correlate strongly with leaf form are (1) the compensated thermicity index (THERM.), (2) growing degree days above 0 °C (GDD_0), (3) growing degree days above 5 °C (GDD_5), (4) minimum temperature of the warmest month (MIN_T_W) and (5) maximum temperature of the coldest month (MAX_T_C). New humidity-related variables are (6) mean annual vapour pressure deficit (VPD.ANN), (7) mean summer vapour pressure deficit (VPD.SUM), (8) mean winter vapour pressure deficit (VPD.WIN), (9) mean spring vapour pressure deficit (VPD.SPR), (10) mean autumn vapour pressure deficit (VPD.AUT), (11) mean annual potential evapotranspiration (PET.ANN), (12) mean monthly potential evapotranspiration during the warmest quarter (PET.WARM), (13) mean monthly potential evapotranspiration during the coldest quarter (PET.COLD), (14) soil moisture capacity (SOIL.M) and (15) the number of months when the mean temperature is above 10 °C. This last metric serves as a further comparison between the WorldClim2 data and previous calibrations because it should return values similar to those indicating the length of the growing season (LGS). For easy reference, Table 1 summarizes all the CLAMP metrics presented here.
Summary of CLAMP environmental variables, their acronyms, descriptions and units, derived from WorldClim2 gridded data at ∼1 km spatial resolution

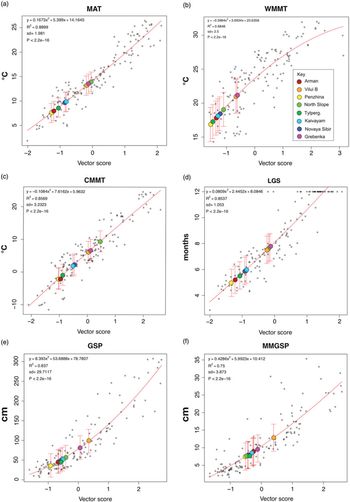
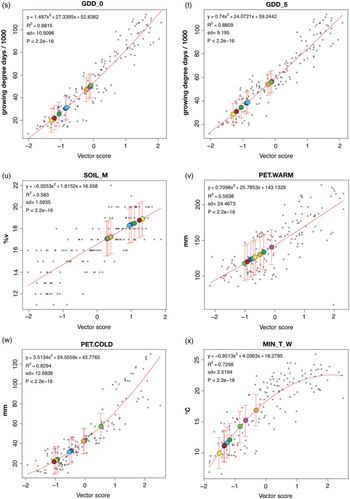
Figures 6–10, graphs a–z, illustrate the CLAMP regression models for each of the climate variables to show not only the relative position on the regression of the NPR fossil locations but also the scatter of the modern training data and thus the precision of the CLAMP predictions. All regression models are derived from the leaf physiognomy / climate relationships in four-dimensional space as used in earlier CLAMP analyses (Herman & Spicer, Reference Herman and Spicer1996b, Reference Herman and Spicer1997a; Spicer & Herman, Reference Spicer and Herman2010).
CLAMP regression models for the WorldClim2_3brc modern vegetation calibration sites (open black circles) and predicted climate variables for eight early Late Cretaceous fossil sites (coloured circles as in the key shown in B). Bars indicate ±1 s.d. MAT – mean annual temperature; WMMT – warm month mean temperature; CMMT – cold month mean temperature; LGS – length of the growing season (temp. >10 °C); GSP – growing season precipitation; MMGSP – mean monthly growing season precipitation.

2.b. Climate variable definitions
Descriptions and regression models for the 11 standard CLAMP climate variables (mean annual temperature – MAT; warm month mean temperature – WMMT; cold month mean temperature – CMMT; length of the growing season – LGS; growing season precipitation – GSP; mean monthly growing season precipitation – MMGSP; precipitation during the three consecutive wettest months – 3WET; precipitation during the three consecutive driest months – 3DRY; mean annual relative humidity – RH. ANN; mean annual specific humidity – SH.ANN; and mean annual moist enthalpy – ENTH) are given on the CLAMP website (http://clamp.ibcas.ac.cn) and summarized in Table 1. Here we describe the newly added climate variables.
The compensated thermicity index (THERM.) is given by
 $$\[{\rm{THERM}}. = \left( {(T + m + M)*10} \right) \pm C\]$$
where T is the mean annual temperature, m is the minimum temperature of the coldest month, M is the maximum temperature of the coldest month and C is a ‘compensation value’. Calculating C is complicated and depends on continentality, which is simply a measure of the difference between the WMMT and the CMMT. In the extratropical zones of the world (northern and southern 27° parallels) THERM. is designed to equilibrate the large differences in temperature that occur between winter cold and summer warmth in continental climates compared to those small differences that occur in maritime climates. Details of how C is calculated are given in the Worldwide Bioclimatic Classification System (www.globalbioclimatics.org) (Rivas-Martinez et al. Reference Rivas-Martinez, Sánchez-Mata and Costa1999).
GDD_0 is a measure of the cumulative heat available to plants and is the sum of the mean monthly temperatures for months with mean temperatures greater than 0 °C multiplied by number of days above that temperature.
GDD_5 is the sum of mean monthly temperatures for months with mean temperature greater than 5 °C multiplied by number of days above that temperature.
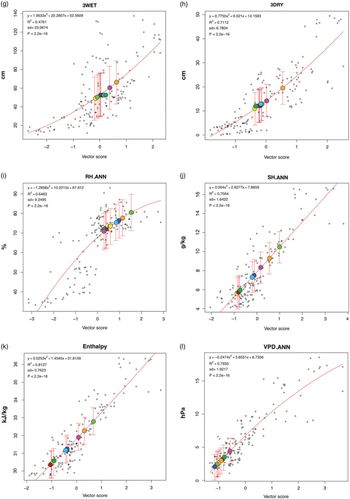
VPD reflects the ease of losing water to the atmosphere and, as such, affects transpiration as well as evaporation. It is the difference between the actual water vapour pressure and the water vapour pressure at saturation. At saturation (VPD = 0 hPa) water will condense out to form clouds, dew or films of water on surfaces, including leaves. VPD combines temperature and relative humidity, so, unlike relative humidity, vapour-pressure deficit has a simple nearly straight-line relationship to the rate of evapotranspiration and other measures of evaporation. Because of this, plant distribution (Huffaker, Reference Huffaker1942) and leaf physiognomy are more strongly reflective of VPD.ANN than RH. ANN (Fig. 7, L, I). This suggests strong leaf trait adaptations to overcoming transpiration depression at low VPDs. Also, VPD is strongly correlated with stomatal conductance and carbon isotope fractionation (e.g. Oren et al. Reference Oren, Sperry, Katul, Pataki, Ewers, Phillips and Schäfer1999; Bowling et al. Reference Bowling, McDowell, Bond, Law and Ehleringer2002; Katul et al. Reference Katul, Palmroth and Oren2009). As well as annual mean VPD (VPD.ANN), seasonal VPD estimates (spring – VPD.SPR; summer – VPD.SUM; autumn – VPD. AUT; and winter – VPD.WIN) are also given by CLAMP.
CLAMP regression models for the WorldClim2_3brc modern vegetation calibration sites (open black circles) and predicted climate variables for eight early Late Cretaceous fossil sites (coloured circles as in the key shown in Fig. 6b). 3WET – precipitation in the three consecutive wettest months; 3DRY – precipitation in the three consecutive driest months; RH.ANN – mean annual relative humidity; SH.ANN – mean annual specific humidity; ENTH – mean annual moist enthalpy; VPD.ANN – mean annual vapour pressure deficit.

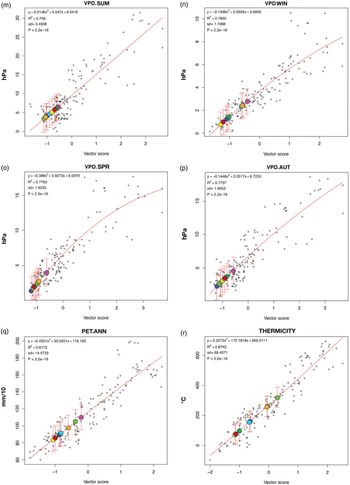
Potential evapotranspiration (PET) is an expression of the ability of the atmosphere to remove water through evapotranspirational processes assuming no limits on plant water supply. Such an assumption appears valid in the case of the early Late Cretaceous Arctic as evidenced by the widespread occurrence of thick coals indicative of raised mires (Sable & Stricker, Reference Sable, Stricker, Taileur and Weimer1987; Grant et al. Reference Grant, Spicer and Parrish1988), gleyed palaeosols and isotopic analysis (Ufnar et al. Reference Ufnar, Ludvigson, González, Brenner and Witzke2004). PET combines the energy available for evaporation and the capacity of the lower atmosphere to move evaporated water vapour away from the land surface, for example by winds and convective processes. Because solar radiation provides the energy for evaporation, PET is lower on cloudy days, in winter and at higher latitudes. Like VPD, PET can be thought of as an indication of how difficult it is for a plant to transpire, a process that is essential for moving water and nutrients from the soil to the leaves. Because of this, and as with VPD, leaf physiognomy correlates well with PET (Fig. 8q; Fig. 9v, w), particularly at low PET values. Although herbaceous plants transpire less than woody plants because they have a lower leaf surface area, the PET reference measure is based on uniformly short grass completely covering the ground. PET estimates for the warmest month (PET.WARM, Fig. 9, V) and coldest month (PET.COLD, Fig. 9w) are given, as well as the mean annual PET (PET.ANN, Fig. 8q). In the work presented here, we introduce a new CLAMP calibration based on WorldClim2 that we call WorldClim2_3br. As well as using the WorldClim2 gridded climate data for the standard CLAMP climate variables, we add the 15 new climate variables considered above. The new WorldClim2-based climate training set (WorldClim2_3br) and the accompanying modern leaf physiognomic (Physg3brcAZ) data files are given in the online Supplementary Material available at https://doi.org/10.1017/S0016756819000463.
CLAMP regression models for the WorldClim2_3brc modern vegetation calibration sites (open black circles) and predicted climate variables for eight early Late Cretaceous fossil sites (coloured circles as in the key shown in Fig. 6b). VPD.SUM – mean summer vapour pressure deficit, VPD.WIN – mean winter vapour pressure deficit, VPD.SPR – mean spring vapour pressure deficit, VPD.AUT – mean autumn vapour pressure deficit.

CLAMP regression models for the WorldClim2_3brc modern vegetation calibration sites (open black circles) and predicted climate variables for eight early Late Cretaceous fossil sites (coloured circles as in the key shown in Fig. 6b). GDD_0 – growing degree days when temperatures are above freezing; GDD_5 – growing degree days when temperatures are above +5 °C; SOIL_M – derived soil moisture capacity; PET.WARM – potential evapotranspiration during the warmest month; PET.COLD – potential evapotranspiration during the coldest month; MIN_T_W – minimum temperature of the warmest month.

2.c. Fossil assemblages
Here we re-analyse eight well-documented fossil leaf assemblages (see http://arcticfossils.nsii.org.cn) from across the NPR (Figs 1, 2) spanning the Cenomanian to Coniacian. All have been previously analysed for the standard CLAMP climate variables calibrated using low spatial resolution modern gridded climate data (GridMet_3br) (Spicer & Herman, Reference Spicer and Herman2010; Herman et al. Reference Herman, Spicer and Spicer2016). We use the same modern vegetation trait scores as used previously (Physg3brcAZ), but with the new WorldClim2_3br ∼1 km2 gridded data and with 15 new environmental variables. Where palaeolatitudes are quoted they are derived from GeTech. Plc palaeogeographies (an example of which is shown in Fig. 2) used in climate modelling (www.bridge.bris.ac.uk/resources/simulations). These palaeogeographies time-integrate a range of geological data and include plate kinematics. CLAMP scoresheets for these fossil assemblages are given in the online Supplementary Material available at https://doi.org/10.1017/S0016756819000463.
CLAMP regression models for the WorldClim2_3brc modern vegetation calibration sites (open black circles) and predicted climate variables for eight early Late Cretaceous fossil sites (coloured circles as in the key shown in Fig. 6b). MAX_T_C – maximum temperature during the coldest month; M_COUNT – number of months where the temperature is above +10 °C.

3. Results and discussion
Tables 2–4 present results obtained for the fossil assemblages using the new WorldClim2_3br CLAMP calibration, as well as (for comparison) previously obtained results that used low spatial resolution GridMet_3br CLAMP calibration. The GridMet_3br results are given in parentheses. Figures 6–10, graphs a–z, show the CLAMP regression models for the new WorldClim2_3br calibration and the positions of the fossil sites on the regression model. The regression models indicate the relationship between leaf physiognomy and the individual climate variable and thus the precision of the predictions. They also indicate the positions of the values for each fossil assemblage for each climate variable relative to those for modern vegetation. Note that despite essentially the same observational network of meteorological stations underpinning both gridded datasets, GridMet_3br and WorldClim2_3br calibrations rarely yield identical results. These differences are purely a function of the different gridding processes between the GridMet_3br and WorldClim2_3brc and a slightly different period of climate observations: 1961–90 in the case of GRIDMet_3br and 1970–2000 for WorldClim2_3br. Such differences define the maximum predictive precision possible for any proxy using modern gridded climate observations for calibration because they are a measure of how well we can quantify modern climate.
Summary of temperature-related CLAMP-derived metrics for early Late Cretaceous plant assemblages from the North Pacific Region

Values obtained by a CLAMP calibration based on WorldClim2_3br and GRIDMet_3br (in parentheses) gridded climate data. MAT – mean annual temperature; WMMT – warm month mean temperature; CMMT 0 – cold month mean temperature; MIN_T_W – minimum temperature of the warmest month; MAX_T_C – maximum temperature of the coldest month; THERM. – compensated thermicity index: sum of mean annual temp., min. temp. of coldest month, max. temp. of coldest month, ×10, with compensations for better comparability across the globe; GDD_0 – sum of mean monthly temperature for months with mean temperature greater than 0 °C multiplied by number of days; GDD_5 – sum of mean monthly temperature for months with mean temperature greater than 5 °C multiplied by number of days; LGS – length of the growing season when mean temperatures are above 10 °C; M_COUNT – count of the number of months with mean temp. greater than 10 °C.
Summary of precipitation, soil moisture and moist enthalpy CLAMP-derived metrics for early Late Cretaceous plant assemblages from the North Pacific Region

Values obtained by a CLAMP calibration based on WorldClim2 and, in parentheses, GRIDMet_3br gridded climate data. GSP – precipitation during the growing season; MMGSP – mean monthly precipitation during the growing season; 3WET – precipitation during the three consecutive wettest months; 3DRY – precipitation during the three consecutive driest months; SOIL_M – derived available soil water capacity (volumetric fraction) predicted using the global compilation of soil ground observations (ftp://ftp.soilgrids.org/data/recent/AWCh1_M_sl2_250 m.tif); ENTH – annual mean moist enthalpy.
Summary of humidity metrics, soil moisture and moist enthalpy CLAMP-derived metrics for early Late Cretaceous plant assemblages from the North Pacific Region

Values obtained by a CLAMP calibration based on WorldClim2 and GRIDMet_3br (in parentheses) gridded climate data. RH.ANNUAL – annual mean relative humidity; SH.ANNUAL – annual mean specific humidity; VPD.ANN – annual mean vapour pressure deficit; VPD.SUM – mean VPD for the summer quarter; VPD.WIN – mean VPD for the winter quarter; VPD.SPR – mean VPD for the spring quarter; VPD-AUT – mean VPD for the autumn quarter; PET.ANN – annual mean potential evapotranspiration; PET.WARM – mean potential evapotranspiration for the warmest quarter; PET.COLD – mean potential evapotranspiration for the coldest quarter.
3.a. Thermal regime
While not identical, the two calibrations yield similar results regarding the thermal regime, and the differences are smaller than, or the same as, the uncertainties. They show clearly that despite the lack of winter insolation, terrestrial CMMTs across the Arctic NPR region, even at latitudes as high as ∼80° N, rarely fell below freezing. This might appear surprising for the highest palaeolatitudes (Novaya Sibir – 81.6° N; North Slope Alaska – 77° N) that experienced more than 3 months of continuous winter darkness (Fig. 3), but these sites were close to the Arctic Ocean coastline and several lines of evidence point to the Arctic Ocean being warm, with winter sea surface temperatures of ∼6 °C (Herman & Spicer, Reference Herman and Spicer1997a), or even approaching 10 °C as indicated here by the winter coastal plain temperatures of the North Slope, Alaska.
The estimates for the length of the growing season are also consistent with the light regimes at different palaeolatitudes (Figs 3–5). Because leaf load is directly related to transpiration and the humidity regime, we have attempted to estimate the timing of bud break and leaf fall in the predominantly deciduous NPR vegetation. Bud break and leaf fall likely occurred in early March and late October respectively in the Cenomanian Vilui Basin (palaeolatitude 72° N, LGS 7.5 months) when mean temperatures rose above 10 °C and there was at least 8 hours of direct sunlight (Fig. 5).
In Grebenka, also Cenomanian but at 74° N, the growing season is similar, with a slightly warmer winter despite the slightly higher latitude (Fig. 4). The Penzhina assemblage (Plat. 72° N) has a shorter growing season of around 5 months due to the lower winter temperature (Fig. 5). The 10 °C mark was not passed until almost mid-April, when there were 16 hours of direct sunlight during each 24-hour period, and the growing season lasted until late September, when temperatures dipped below 10 °C and daylight hours approached 12. The foliage traits of the highest palaeolatitude assemblage, Novaya Sibir (Turonian, Plat. ∼82° N), suggest that bud break occurred in early April and growth continued until the beginning of October, a growing period of 5.8 months. The Coniacian North Slope assemblage from the northern Alaska palaeo-floodplain has the longest growing season (7.5 months) despite its palaeolatitude of ∼78° N. This is because winter temperatures barely dipped below 10 °C (Table 2; Fig. 3) and although the mean air temperature would have passed 10 °C in mid-February and dipped below 10 °C in early November, a period of ∼8.5 months, growth must have been moderated by insolation. With relatively warm conditions maintained by a nearby warm Arctic Ocean, we estimate that a minimum of 4 hours of direct sunlight per 24-hour period is likely to have been the critical driver for leaf expansion and abscission, meaning that bud burst likely took place in late February and leaf fall in early to mid-October. Early Late Cretaceous North Slope tree ring characteristics (Parrish & Spicer, Reference Parrish and Spicer1988a) indicate the rapid onset of growth and a prolonged and uninterrupted summer growth period.
3.b. Relative palaeoelevations
The differences in thermal regime between the various leaf fossil assemblages used in our analyses depend not only on their palaeo-position but also on their relative elevations above sea level. Clues to these elevational differences come from the moist enthalpy estimates (Table 3). The North Slope assemblage is known to represent near-sea-level conditions because the plant-bearing units inter-finger with marine sediments (Mull et al. Reference Mull, Houseknecht and Bird2003), and as would be expected this site yields the highest moist enthalpy value indicative of the lowest elevation. The site with the lowest moist enthalpy value (highest elevation) is in the Okhotsk–Chukotka Volcanogenic Belt (Arman), and the difference between the two enthalpy values is 20 kJ kg−1 (Table 3) which translates to a height difference of ∼2 km (Forest et al. Reference Forest, Molnar and Emanuel1995; Spicer, Reference Spicer, Hoorn, Perrigo and Antonelli2018). However, this difference is not spatially or temporally corrected. The Arman site has been estimated to have been at ∼0.6 km using the Kaivayam assemblage as a sea level datum and the GridMet_3br calibration (Herman, Reference Herman2018). Using the new WorldClim2_3brc raises this surface height estimate for the Arman flora to ∼0.9 ± 0.8 km. Based on the relative palaeo-enthalpy estimates, all the NPR localities likely were below 1 km elevation, but detailed analysis awaits future moist enthalpy fields derived from integrating proxy and palaeoclimate modelling.
3.c. Precipitation
Table 3 shows the estimated precipitation regime derived from leaf form. In general, the wetter the climate the less well leaf physiognomy predicts the precipitation regime (Figs 6, 7, e–h). Many of the Arctic angiosperm leaves are large (Herman, Reference Herman, Boulter and Fisher1994), which is an advantageous adaptation to low and predominantly diffuse sunlight situations provided that water is abundant. Abundant thick Late Cretaceous coals (Sable & Stricker, Reference Sable, Stricker, Taileur and Weimer1987), many of which represent raised mires (Youtcheff et al. Reference Youtcheff, Rao, Smith, Taileur and Weimer1987; Grant et al. Reference Grant, Spicer and Parrish1988), and isotope analyses (Ufnar et al. Reference Ufnar, Ludvigson, González, Brenner and Witzke2004) all suggest that early Late Cretaceous Arctic annual precipitation was high.
Although we can be certain that in general the Late Cretaceous Arctic was wet, deriving accurate precipitation estimates from high-latitude palaeofloras is problematic for several reasons. Firstly, leaf fossils are invariably preserved in aquatic environments where low oxygen limits decay. The limited distance that leaves can be transported from their growth site before burial (Spicer, Reference Spicer1981; Ferguson, Reference Ferguson1985; Spicer & Wolfe, Reference Spicer and Wolfe1987) means that the source plants most likely grew in locations where the water table was high year-round. The estimate of soil moisture capacity for the NPR fossil assemblages (Table 3, SOIL_M; Fig. 9u) also suggests moist soils. Moreover, this water may not reflect local precipitation but conditions in the headwaters of the river catchment many tens if not hundreds of kilometres away. Secondly, even if the water table was maintained by local precipitation, the soil system stores water and buffers seasonal variations in water availability, meaning that 3WET and 3DRY estimates represent seasonality in rainfall only poorly. Thirdly, at high latitudes where light and temperature impose dormancy and seasonal leaf-shedding, rainfall in the dormant period is unlikely to be reflected in leaf physiognomy. This is not the case, however, for winter temperatures.
Winter temperatures are to some extent encoded in leaf physiognomy (Fig. 6c) because young leaves have to be adapted to rapidly warming spring conditions, the rate of warming being determined in large part by the CMMT (Spicer et al. Reference Spicer, Herman and Kennedy2004). However, below observed winter temperatures of −10 °C this extrapolative encoding, which tends to yield winter temperatures that are too warm (Spicer et al. Reference Spicer, Herman and Kennedy2004), does not apply at all to winter precipitation where soil moisture may be high year-round but inaccessible to the plant in early spring if the soil is frozen. The GSP estimate (note not the mean annual precipitation) of between 50 and 125 cm is quite low where the regression model shows little scatter (Fig. 6e), but because the growing season is often less than half the year this indicates that overall the annual precipitation could have been at least double that indicated. Although CLAMP routinely returns estimates for precipitation during the three wettest (3WET) and three driest months (3DRY), these values may be unreliable because of the marked growth seasonality. In view of the arguments just given for wet soils it is noteworthy that there is a marked difference in the 3WET:3DRY ratio, which for all assemblages except Vilui B returns ratios near 4:1.
The wet soils would necessarily mute these ratios, so the fact that they are pronounced suggests even more extreme rainfall seasonality than the values suggest and that the Arctic may have experienced a ‘monsoonal’ climate in the early Late Cretaceous. An essentially ‘summer wet’ (wet:dry ratio 3:1) has been proposed for the Arctic in the Eocene based on isotopic analysis of fossil wood interpreted to have been evergreen (Schubert et al. Reference Schubert, Jahren, Eberle, Sternberg and Eberth2012), but an ‘ever wet’ precipitation regime for this epoch is indicated by leaf form (West et al. Reference West, Greenwood and Basinger2015) based on predominantly deciduous angiosperm taxa. To really understand the hydrological regime in a warm Arctic requires, as far as is possible, decoupling the soil water environment from that of the atmosphere.
3.d. Humidity
Until now CLAMP has routinely returned only two humidity measures: mean annual relative humidity (RH.ANN) and mean annual specific humidity (SH.ANN). SH is simply the amount of water in grams contained within a kilogram of dry air and as such is a measure of the absolute water content of the air. Leaf form appears to code for mean annual SH quite well in that the CLAMP regression model (Fig. 7j) shows relatively little scatter compared to that of mean annual RH (Fig. 7i). RH is a measure of the amount of water in the atmosphere relative to what it can hold and as such is highly dependent upon temperature. As the scatter in Figure 7i shows, leaf form does not correlate well with RH, so CLAMP predictions of RH carry a lot of uncertainty.
A better measure of humidity, one that reflects the force opposing transpiration, is vapour pressure deficit (VPD). VPD is the difference between the amount of moisture actually in the air and how much moisture the air could potentially hold when it is saturated and, like SH, is not measured in relation to temperature. High VPD values are found in arid environments while low VPDs reflect air close to saturation and thus a high resistance to transpiration.
Figures 7 and 8, l–p, show that, at low VPD values, leaf form correlates very well with VPD, presumably because leaves have to possess adaptations to enhance transpiration, while in high-VPD situations transpiration can take place easily without the need for specific leaf trait spectra to increase transpiration. Thus, there is more scatter in the CLAMP regressions at high VPDs. So, unlike precipitation, CLAMP estimates of VPD in moist regimes are generally more precise than in dry regimes.
Table 4 shows that all the Arctic early Late Cretaceous leaf assemblages indicate low VPDs (<5 kPa) in spring, autumn and winter but, because autumn and winter are times when leaves are senescent or shed, these values have to be interpreted with caution. The spring and summer values are likely to be the most reliable because this is when the leaves are functional. The highest summer VPDs are those from fossil assemblages in NE Russia (Grebenka, Arman, Tylpegyrgynai) and these assemblages also point to the lowest annual RH values, while the lowest summer VPD and annual values are revealed in assemblages from the Arctic Ocean coastal areas (Novaya Sibir, North Slope), the Yukon–Koyukuk Basin and the Vilui Basin. These assemblages also indicate the highest RH.ANN values. Of all the Arctic fossil sites, those bordering the Arctic Ocean and nearest the palaeo-pole (Novaya Sibir and North Slope) have the lowest VPDs, the only exception being the North Slope that has a VPD.WIN value similar to those of Grebenka and Arman. These assemblages also indicate the warmest winter temperatures (Fig. 3). However, even assemblages indicating the driest summers have very low VPDs compared to most modern vegetation in the calibration (Figs 7, 8, l–p), indicating an overall extremely wet atmosphere compared to that experienced by most vegetation in the modern CLAMP training sets.
PET is a measure of how easily the atmosphere removes water from a surface and so, like VPD, indicates the ease with which transpiration can take place. Also, like VPD, PET shows a close relationship with leaf trait spectra at low PET values, i.e. wet regimes. All NPR fossil assemblages fall in the lower half of the regressions, showing that they experienced similar PETs to modern vegetation in the more humid half of the 3br training set. The PET.WARM and PET.COLD values also show that any dry season was in the summer, presumably because higher temperatures and convective winds favoured greater evaporation.
Taking Figures 3–5 together, it is noticeable that Figure 4 shows the highest humidities and that these occur at palaeolatitude ∼75° N from sites (Grebenka and Tylpegyrgynai) that were not immediately adjacent to the Arctic Ocean, but closer to the north Pacific. These high humidities may be a function of a cool northern Pacific gyre (Herman & Spicer, Reference Herman and Spicer1996a, Reference Herman and Spicer1997a) or reflect a more northward and diffuse palaeoposition of the polar front, which today is located at ∼60° N as a consequence of a strong polar high.
4. Conclusions
4.a. Thermal regime
The new WorldClim2_3br CLAMP calibration confirms earlier isotopic (Amiot et al. Reference Amiot, Lecuyer, Beuffetaut, Frédéric, Legendre and Meartineau2004), vegetation (Parrish & Spicer, Reference Parrish and Spicer1988b) and leaf physiognomic analyses (Herman & Spicer, Reference Herman and Spicer1996b, Reference Herman and Spicer1997a; Spicer & Herman, Reference Spicer and Herman2010) from the NPR demonstrating a thermal regime that may be broadly characterized as 'temperate’ even at palaeolatitudes as high as ∼80° N where freezing temperatures were of limited duration and severity. The precision of the palaeoclimate regime estimates is constrained by the uncertainties associated with our inability to quantify modern climate precisely. These uncertainties, which will differ between calibration suites depending on calibration sampling distribution, density and temporal coverage, apply to any palaeoenvironmental proxy that relies on calibrations using the modern conditions and should not be ignored when making inter-proxy comparisons or interpreting past environments. In the analyses presented here, MAT estimates differ by up to 0.6 °C, WMMT by up to 0.9 °C and CMMT by up to 1.5 °C depending purely on the underlying modern gridded climate data.
4.b. Palaeoelevation
No terrestrial palaeotemperature comparisons can be meaningful without taking into account differences in the surface height at which the estimates are made. In the case of the early Late Cretaceous NPR it is clear that some thermal differences between assemblages can be attributed to relative elevational differences, but that no site was likely to have been above 1 km. However, a 1 km elevation range can translate into MAT differences of several degrees Celsius depending on early Late Cretaceous near-polar terrestrial lapse rates. This aspect of the NPR palaeoclimate, and better characterization of Late Cretaceous moist enthalpy fields, awaits future modelling work.
4.c. Precipitation and humidity
The precipitation regime throughout the NPR overall appears moderately wet, with most sites indicating summer (growing season) precipitation ∼0.5 m, but apparently with marked seasonal variations. Compared to all the sites in the modern calibration data, humidity is high year-round, but with most evaporative stress occurring in the summer. PET (Table 4) never exceeds rainfall even in the summer growth period (Table 3), leading to year-round saturated soils. Drought was not limiting to growth in any of the NPR early Late Cretaceous localities, and CMMTs (Table 2) were never low enough for long enough to freeze the soil to below tree rooting depth.
Our new insights into annual and seasonal atmospheric humidity in the warm early Late Cretaceous Arctic support the concept of a very humid near-polar regime markedly different from today’s frigid desert under a strong polar high-pressure cell and with a corresponding strong polar front at ∼60 °N. It is likely that the polar front in the early Late Cretaceous was displaced towards the pole and more diffuse than at present. A key component of the weaker polar high was the warm Arctic Ocean that, as evidenced by year-round high humidities, generated a vigorous hydrological cycle, which in turn helped maintain the polar warmth.
The vegetation and climate records entombed in the extensive Late Cretaceous sediments of the Arctic point towards what the North Polar region is likely to experience as overall anthropogenic global warming progresses. Polar amplification will rapidly drive the Arctic from being a place where at present precipitation is sparse under a cold strong polar high-pressure system to being a region that is wet and where polar air masses become increasingly loosely constrained as warming proceeds and the polar high weakens. The hydrological cycle is likely to become invigorated through warming-induced evaporation and enhanced transpiration from greater vegetation cover and complexity. Eventually this will result in a near-permanent polar cloud cap, high humidity and frequent fog occurrences over both land and sea, further enhancing warming.
Supplementary material
To view supplementary material for this article, please visit https://doi.org/10.1017/S0016756819000463
Author ORCIDs
Robert Spicer https://orcid.org/0000-0003-1076-2693
Acknowledgements
We thank Tamara Fletcher and an anonymous reviewer for their positive constructive comments. The research was performed within the framework of State programme no. 0135-2019-0044 of the Geological Institute, Russian Academy of Sciences, and partly supported by the Russian Foundation for Basic Research project no. 19-05-00121 (A.H.). CLAMP recalibration was made possible through a National Natural Science Foundation of China (NSFC)–UK Natural Environment Research Council (NERC) joint research programme (41661134049 and NE/P013805/1) (P.V.) and a Xishuangbanna Tropical Botanical Garden (XTBG) (Chinese Academy of Sciences) International Fellowship for Visiting Scientists (R.S.).
Declarations of Interest
All authors declare no competing interests.