Introduction
For more than 20 years, the alkanes of plant cuticular wax have been used as markers to estimate feed intake by herbivores (Mayes et al., Reference Mayes, Lamb and and Colgrove1986). Intake is estimated from the faecal concentrations of two alkanes, one derived from herbage and one administered to the animals by oral dosing (Mayes et al., Reference Mayes, Lamb and and Colgrove1986; Dove and Mayes, Reference Dove and Mayes2005). The method requires the assumption that the recovery in faeces of each of these alkanes is equal; validation studies have shown that these recoveries are usually close (see Dove and Mayes, Reference Dove and Mayes2005). This means that the method can be used without having to know the marker recoveries in faeces, but equally it requires alkane dosing and its accuracy is directly related to the accuracy of the dose (Dove and Mayes, Reference Dove and Mayes2005; Charmley and Dove, Reference Charmley and Dove2007).
Different plant species have different patterns of alkanes and other components in their cuticular wax (e.g. Brosh et al., Reference Brosh, Henkin, Rothman, Aharoni, Orlov and Arieli2003; Bugalho et al., Reference Bugalho, Dove, Kelman, Wood and Mayes2004; Dove and Mayes, Reference Dove and Mayes2005) and this fact has successfully been used to estimate the diet composition of both housed animals (e.g. Brosh et al., Reference Brosh, Henkin, Rothman, Aharoni, Orlov and Arieli2003; Elwert and Dove, Reference Elwert and Dove2005; Charmley and Dove, Reference Charmley and Dove2007) and grazing animals (e.g. Bugalho et al., Reference Bugalho, Dove, Kelman, Wood and Mayes2004; Osoro et al., Reference Osoro, García, Jáuregui, Ferreira, Rook and Celaya2007; Piasentier et al., Reference Piasentier, Saccà and Bovolenta2007), using least-squares procedures (Dove and Moore, Reference Dove and Moore1995).
In estimating diet composition in animals which are also consuming a feed supplement, the supplement is effectively regarded as one of the ‘species’ in the diet (Dove et al., Reference Dove, Scharch, Oliván and Mayes2002; Elwert and Dove, Reference Elwert and Dove2005; Charmley and Dove, Reference Charmley and Dove2007). It follows logically that if diet composition can be estimated and the actual intake of one of the dietary components (e.g. the supplement) is known, then the intake of all other dietary components can be estimated. This approach was used by Dove et al. (Reference Dove, Scharch, Oliván and Mayes2002) and Elwert and Dove (Reference Elwert and Dove2005) to estimate the intake of the forage component of a diet consisting of forage plus an oilseed meal that had been labelled with beeswax to give it a distinct alkane profile. We recently demonstrated that this approach could be extended to estimating the intake of up to four forage components in the diet (Charmley and Dove, Reference Charmley and Dove2007). Elwert et al. (Reference Elwert, Dove and Rodehutscord2008), using diets based on beeswax-labelled barley grain and three roughages, also found that all four components of the diet were estimated well using alkane concentrations in diet components and faeces. This ‘labelled-supplement’ approach to estimating intake has the major advantage of not requiring separate alkane dosing, since the labelled supplement is effectively the alkane ‘dose’. This reduces the potential disturbance of normal grazing behaviour, but requires a knowledge of the faecal recoveries of the alkanes used to estimate diet composition. Moreover, as Elwert et al. (Reference Elwert, Dove and Rodehutscord2008) have recently discussed, it also requires the assumption that the faecal recovery of a given alkane is the same for each of the different dietary components.
Although the labelled-supplement approach has accurately estimated the intakes of up to four forage components, we experienced some difficulty in obtaining accurate estimates of the contribution to the diet of a component containing low concentrations of cuticular wax alkanes (Phalaris aquatica; see Charmley and Dove, Reference Charmley and Dove2007). This resulted in reduced accuracy of intake estimation in diets containing large proportions of phalaris. In that study, we suggested (Charmley and Dove, Reference Charmley and Dove2007) that the accuracy of estimation of diet composition, and thus forage intake, could be increased by also using other cuticular wax markers such as the long-chain alcohols (LCOH), in the estimation of diet composition (Bugalho et al., Reference Bugalho, Dove, Kelman, Wood and Mayes2004; Ali et al., Reference Ali, Mayes, Hector, Verma and Ørskov2005; Dove and Mayes, Reference Dove and Mayes2005).
The aim of the work reported here was to extend our earlier study (Charmley and Dove, Reference Charmley and Dove2007) by evaluating the use of either LCOH or (LCOH + alkanes) for estimating diet composition and forage intake in housed sheep, and to compare the accuracy of the estimates so obtained with those based only on alkanes.
Material and methods
The procedures used in this work have been described in detail in a recent publication (Charmley and Dove, Reference Charmley and Dove2007) but for the sake of clarity are also summarised here. All procedures had the written approval of the Animal Ethics Committee, CSIRO Divisions of Plant Industry and Entomology.
Experimental animals, design and diets
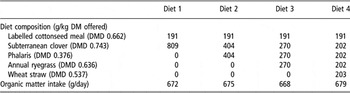
This work was conducted with 24 Merino-cross wethers (38 to 46 kg LW) in a 37-day experiment with four diets (Table 1). Each diet comprised 660 g/day (air-dry) chaffed forage and 150 g/day (air-dry) cottonseed meal (CSM) supplement. The forages used were as follows: Diet 1 (one forage component), subterranean clover (Trifolium subterraneum); Diet 2 (two forage components), equal amounts of subterranean clover and poor-quality phalaris (P. aquatica); Diet 3 (three forage components), equal amounts of subterranean clover, phalaris and annual ryegrass (Lolium rigidum); and Diet 4 (four forage components), equal amounts of subterranean clover, phalaris, annual ryegrass and wheat straw (Triticum aestivum). The supplement was solvent-extracted CSM labelled with beeswax and C28 alkane as alkane sources.
Component composition of the diets (g/kg dry matter (DM) offered), DM digestibility (DMD) of diet components and total organic matter intake

The sheep were ranked according to LW and after allocation to the diets (see Statistical procedures below) were initially housed in individual pens for 12-day adaptation to diets. Half the sheep were then transferred to metabolism cages for total collection of faeces. On day 14, controlled-release devices (CRD; Argenta, Auckland, New Zealand) containing both C32 and C36 alkanes were administered to all sheep. The CRD had a measured release rate of 46.5 mg/day for each alkane (Charmley and Dove, Reference Charmley and Dove2007).
The total collection of faeces from the 12 caged sheep and rectal grab sampling of faeces (daily at 0900 h, prior to feeding) from all sheep commenced on day 21 (7 days after CRD insertion) and continued for 6 days. Diets (Table 1) were fed once daily in the mornings and water was available at all times. Procedures for the collection of samples of the diet components, feed refusals and faeces have been described in detail elsewhere (Charmley and Dove, Reference Charmley and Dove2007). Daily 10% sub-samples of total faeces were bulked and frozen for subsequent freeze-drying and analysis for alkane and LCOH concentrations. Rectal grab samples were similarly bulked across days for alkane and LCOH analyses.
Preparation of the labelled supplement
The labelled supplement was prepared as described by Charmley and Dove (Reference Charmley and Dove2007). Briefly, beeswax and synthetic C28 alkane (Sigma Aldrich Australia, Castle Hill, NSW, Australia) were dissolved in warm heptane and sprayed onto the CSM to provide final concentrations of the odd-chain alkanes from beeswax or of C28 of about 200 to 500 mg/kg OM. These additions ensured an alkane profile of the CSM that was markedly different from all other dietary components (Elwert and Dove, Reference Elwert and Dove2005; Charmley and Dove, Reference Charmley and Dove2007).
Analytical procedures
The DM content of feed offered, feed refused and faeces was determined by forced-air oven drying at 70°C for 48 h. Organic matter (OM) was determined as the weight lost upon ashing feeds and faeces at 550°C in a muffle furnace for 24 h. Alkanes and LCOH were extracted from samples using a direct saponification procedure followed by column chromatography (Ali et al., Reference Ali, Mayes, Lamb, Verma and Ørskov2004; Dove and Mayes, Reference Dove and Mayes2006) and quantified by gas chromatography using a modification (Salt et al., Reference Salt, Mayes and Elston1992) of the method of Mayes et al. (Reference Mayes, Lamb and and Colgrove1986) for alkanes and for LCOH, the method of Ali et al. (Reference Ali, Mayes, Lamb, Verma and Ørskov2004) except that LCOH were not derivatised prior to chromatography. Tetracosane (C24 alkane) and tetratriacontane (C34 alkane) were used as internal standards for alkanes and heptacosanol (C27OH) as the internal standard for LCOH.
Calculation of diet composition, intake and digestibility
The proportions of CSM and forage components in the consumed diets were estimated using the computer package EatWhat (Dove and Moore, Reference Dove and Moore1995), which uses a non-negative, least-squares procedure to estimate the combination of alkane or LCOH patterns of diet components, which best matches the pattern of recovery-corrected alkane or LCOH concentrations observed in faeces. Estimates were based on alkanes alone (C25 to C31 and C33), LCOH alone (even-chain LCOH C22OH–C30OH) or a combination of alkanes plus LCOH. In the latter case, because LCOH concentrations were so much higher than alkane concentrations (see Results), preliminary estimates of diet composition were made with LCOH concentrations scaled in two ways: by dividing all LCOH concentrations by 10 to make them more similar to alkane concentrations, or by expressing all LCOH or alkane concentrations as proportions of their respective sums. In neither case were the estimates of diet composition improved by scaling, so the diet composition data presented below for (LCOH + alkanes) have not been scaled.
Required corrections for the incomplete recovery of alkanes or LCOH were made in one of three ways:
(a) using recovery data for the individual sheep in metabolism cages,
(b) using treatment mean recovery data for these sheep, or
(c) using the grand mean values for faecal marker recovery across the dietary treatments given to the sheep.
Forage intake was estimated using the ‘labelled-supplement’ method (Dove et al., Reference Dove, Scharch, Oliván and Mayes2002; Elwert and Dove, Reference Elwert and Dove2005; Charmley and Dove, Reference Charmley and Dove2007), which employs knowledge of the amount of supplement consumed (I s) and the estimated supplement proportion (P s) and the proportion of a given forage in the diet (P f) to estimate the intake of a given forage, using the equation:

This approach does not require separate dosing with alkanes, but because it is based on the estimation of diet composition, it does require the correction of faecal marker concentrations for their incomplete faecal recovery.
The OM digestibility of Diets 1 to 4 was calculated using the measured OM intakes and faecal OM outputs, and was also estimated indirectly from the estimate of diet composition (see Charmley and Dove, Reference Charmley and Dove2007). As Dove and Moore (Reference Dove and Moore1995) have discussed, the estimate of diet composition provided by EatWhat is in fact a normalised estimate of the amounts (kg) of each dietary component, which, taken together, would result in a hypothetical 1 kg of faeces with the observed plant wax marker concentrations. It follows that for a diet consisting of components (a, b, c, …n), an estimate of digestibility is ((a + b + c +…+ n)−1)/(a + b + c +…+ n). This approach provided three sets of OM digestibility estimates based on alkanes, LCOH or (LCOH + alkanes).
Statistical procedures
The potential for using alkanes and/or LCOH to discriminate between diet components was assessed a priori using principal components analyses (PCA), as described by Bugalho et al. (Reference Bugalho, Dove, Kelman, Wood and Mayes2004). To determine whether the discriminatory information provided by the LCOH was additional to that provided by the alkanes, PC scores obtained with the two different classes of marker were compared by Orthogonal Procrustes Rotation (OPR), using Genstat (2005) as described in detail by Bugalho et al. (Reference Bugalho, Dove, Kelman, Wood and Mayes2004). Briefly, OPR rotates the axes of each PCA output in an attempt to minimise the residual sum of squares between the PCA scores based on alkanes and those based on LCOH. Large values for unexplained residual variance after OPR imply that the two classes of marker are providing different types of discriminatory information.
The animal component of our trial was a randomized complete block design, except that one sheep from each of the two blocks (caged sheep, penned sheep) that had been allocated to the 1-forage treatment (Diet 1) was re-assigned to the 4-forage treatment (Diet 4), giving four sheep on Diet 1, six sheep on each of Diets 2 and 3 and eight sheep on Diet 4. This was done in anticipation of higher variance in the more complex dietary treatment.
The accuracy of intake estimates was determined with the mean prediction error (MPE) as used by Elwert and Dove (Reference Elwert and Dove2005) and Elwert et al. (Reference Elwert, Dove and Rodehutscord2008). This was calculated by summing the squares of differences between observed and estimated values, dividing by n and taking the square root of this quotient.

The estimates of diet composition, intake and digestibility were compared with measured values using t-tests for paired comparisons. Analyses of variance were used to determine whether there was an effect of diet on these variates, or on MPE.
Results
Alkane and LCOH profiles of the diet components
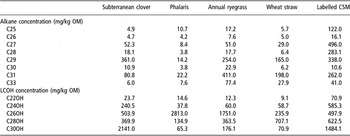
The alkane and LCOH concentrations of all diet components are shown in Table 2. The alkane profiles have been discussed in detail elsewhere (Charmley and Dove, Reference Charmley and Dove2007), but are repeated in Table 2 for comparison with LCOH concentrations. Briefly, the odd-chain alkanes predominated and there were marked differences in the profile between the four forage species. Phalaris was characterised by low concentrations of all alkanes, which caused difficulties with diet composition estimates involving large proportions of phalaris (Charmley and Dove, Reference Charmley and Dove2007). The labelled CSM had a distinct alkane profile, with all alkane concentrations within the ranges expected from the degree of labelling.
Alkane and long-chain alcohol (LCOH) concentrations of the four forages and the labelled cottonseed meal (CSM) used in the estimation of diet species composition

OM = organic matter.
The LCOH concentrations in all diet components were in general much higher than the alkane concentrations. In subterranean clover, C30OH was the predominant LCOH, whilst phalaris and annual ryegrass were similar in having C26OH as their major LCOH. The LCOH concentrations in phalaris were much higher than its alkane concentrations. The labelling of the CSM resulted in similar concentrations of C24OH–C28OH, with C30OH as the predominant LCOH.
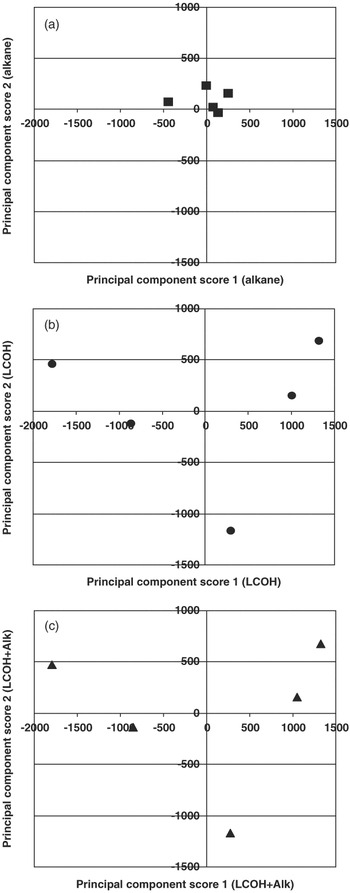
Principal component analysis based on alkane concentrations demonstrated that 89% of the variance between diet components was explained by the first two PC scores (P < 0.05) and the degree of discrimination effected by these scores is shown in Figure 1a. The discrimination arising from the use of PCA scores derived from LCOH concentrations was much more marked (Figure 1b), with 99% of the variance between diet components explained by the first two PC scores (P < 0.01). When data from alkanes and LCOH were combined, 96% of the variance between diet components was explained by the first two PC scores. Although the discrimination between diet components appeared no better with the combined use of alkanes and LCOH (Figure 1c), there were marked differences in the third PC score between LCOH alone and (LCOH + alkanes), respectively, as follows: subterranean clover −187.9, 321.2; phalaris 86.0, 20.2; annual ryegrass 46.8, −40.8; wheat straw 28.0, 140.4; and CSM 27.1, −440.1. This suggested that the combined use of alkanes and LCOH was leading to improved discrimination between diet components. The use of OPR confirmed that this was the case, by demonstrating that when PCA scores based on alkanes or on LCOH were compared, over 64% of the residual variance remained after rotation. This indicates that LCOH provide discriminatory information additional to that provided by alkanes.
Biplots of the first and second principal component scores resulting from principal component analyses based on (a) alkane concentrations (▪), (b) long-chain alcohol (LCOH) concentrations (●) or (c) LCOH + alkane concentrations (▴) in the diet components.

Recovery of alkanes and LCOH in faeces
As described earlier (Charmley and Dove, Reference Charmley and Dove2007), the relationship between alkane carbon-chain length (C) and faecal recovery was curvilinear and described by asymptotic equations, which differed significantly between Diets 1 to 3 and Diet 4 (P < 0.01).
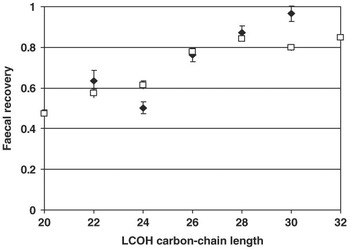
The faecal recovery of LCOH from diet components also increased with their increasing carbon-chain length (L; Figure 2, solid symbols) but in this case treatment mean data were best described by a linear function, which did not differ between the diets:
Relationship between the carbon-chain length of long-chain alcohols (LCOH) and their faecal recovery in the present study (solid symbols) and the study reported by Ali et al. (Reference Ali, Mayes, Lamb, Verma and Ørskov2004; open symbols). Error bars represent standard errors of means.


The recovery of C30OH was almost complete, but the recovery of C24OH was lower than might have been expected from interpolation between C22OH and C26OH. There was no obvious reason for this.
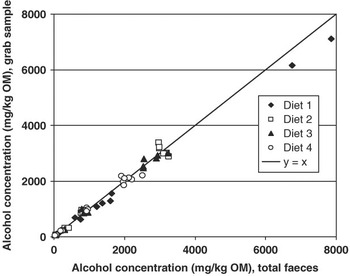
The relationship between LCOH concentration in total faeces and a single, daily faecal grab sample from the same animals was linear and was described by an equation in which the slope (0.94 ± 0.013) differed slightly but significantly (P < 0.05) from 1.0 (Figure 3). This was mainly due to the leverage exerted by the two highest points (see Discussion) and for all other values, the faecal alkane concentration in the bulked grab sample was representative of the total faecal output.
Concentrations of long-chain alcohols in total faeces and in faecal grab samples of the caged sheep (n = 12) consuming Diets 1 to 4. The overall relationship between concentrations in grab samples and total faeces was described by the equation: Grab = 0.94 × Total + 54.43 (R 2 = 0.989, P < 0.001).

Estimation of diet composition
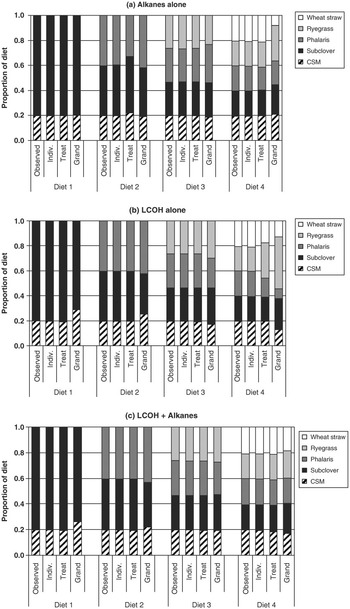
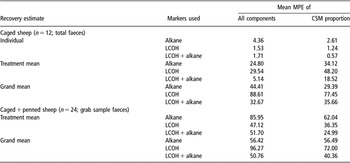
The estimated proportions of CSM and the forages in Diets 1 to 4 in the diet of the caged sheep, based on the use of alkanes, LCOH or (LCOH + alkanes) and with faecal recovery corrections from individual animals, treatment means or the grand mean, are shown in Figure 4. The overall MPE for diet composition (averaged across diets and diet components) and the MPE for estimated CSM proportion (averaged across diets) for the same combinations of marker and recovery correction are shown in Table 3. As the data in Figure 4 indicate, the accuracy of estimation of diet composition was affected both by the recovery correction used and by the markers used in the estimation.
Observed and estimated proportions of the forages and cottonseed meal (CSM) in the four diets consumed by the caged sheep. Estimates were derived from (a) alkanes alone, (b) long-chain alcohols (LCOH) alone, or (c) the combination of LCOH and alkanes, with faecal recovery corrections based on the individual sheep (‘Indiv.’), the treatment mean (‘Treat’) or the grand mean of all treatments (‘Grand’).

Mean prediction error (MPE; g/kg organic matter) for estimated diet composition (averaged across diets and diet components) and for cottonseed meal (CSM) proportion in the diet (averaged across diets) in the caged sheep (n = 12) or in all 24 sheep, based on alkanes, long-chain alcohols (LCOH) or LCOH + alkanes as markers and on individual, treatment mean or grand mean estimates of faecal marker recovery

When recovery corrections were based on data from individual animals (Figure 4), differences from measured diet composition were all very small (0.001 to 0.011). Nevertheless, when estimated using alkanes alone, the estimated proportion of CSM in the diet differed significantly from the measured proportion (estimated 0.194 v. measured 0.195; P < 0.05), as did the estimated proportion of ryegrass (0.219 v. 0.226; P < 0.05). This was related in part to the very low MPE when diet compositions were estimated using data from individual animals.
When diet compositions were estimated using LCOH, there were no significant differences between estimated and measured values for any diet component, partly due to between-animal variability. Diet composition seemed less accurately estimated for Diet 4, especially when based on grand mean recoveries. When diet compositions were estimated using (LCOH + alkanes), the proportion of phalaris was significantly under-estimated (P < 0.05), though by less than 0.001.
Using the treatment mean recovery corrections introduces an extra component of variance between animals, within treatment, and the magnitude of the differences between estimated and measured diet compositions was larger (up to 0.09) than when individual recoveries were used. However, the differences between estimated and measured proportions of a dietary component were not significant, though they tended to be lower when LCOH or (LCOH + alkanes) were used than when alkanes alone were used to estimate diet composition.
When grand mean recoveries were used, the magnitude of the differences between estimated and measured diet compositions increased further (up to 0.14). The proportion of wheat straw in the diet was significantly under-estimated by 0.13 ± 0.027 (P < 0.05) when alkanes were used to estimate diet composition. None of the estimates obtained using LCOH or (LCOH + alkanes) differed significantly from measured diet compositions. However, it is clear from Figure 4 that the estimation of the proportions of ryegrass and phalaris became progressively worse as recovery correction moved from individual animal to treatment mean to grand mean. This was not the case when (LCOH + alkanes) were used.
The MPE data in Table 3 give an indication of the accuracy of diet composition estimates and, in general, confirm the trends discussed for Figure 4. The MPE attendant to estimates based on total faeces were significantly lower than those for estimates based on grab samples (P < 0.05) and were lowest when recovery corrections were derived from individual animal data (P = 0.01). The overall MPE did not differ significantly between values derived from treatment mean or grand mean data, but this difference was significant for the MPE of CSM proportion. For both the overall MPE and for the MPE for CSM proportion, values were lowest when based on (LCOH + alkanes) (overall MPE P < 0.05; MPE for CSM proportion P < 0.01).
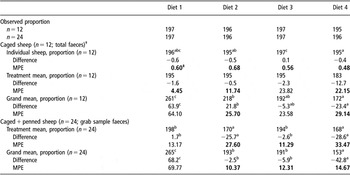
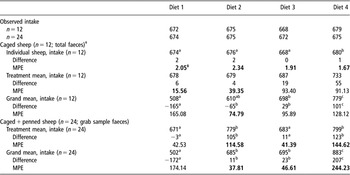
Accurate estimation of total OM intake using the ‘supplement method’ depends in turn on the accurate estimation of the proportion of supplement (CSM) in the diet. In view of the fact that the most accurate estimates of diet composition were obtained with (LCOH + alkanes) (Figure 4; Table 3) and given that alkane-based estimates of intake have been discussed elsewhere (Charmley and Dove, Reference Charmley and Dove2007), the diet composition and intake data presented in Tables 4 and 5 are those based on (LCOH + alkanes). Estimated proportions of CSM in the various diets, derived using the different methods for recovery correction and expressed for convenience as g/kg OM, are shown in Table 4 together with mean differences from known proportions and resultant MPE estimates. Equivalent data for total OM intake (g/day) are presented in Table 5.
Observed and estimated proportions (g organic matter/kg), differences (estimated−observed) and mean prediction error (MPE) of cottonseed meal proportion in the diet in the caged sheep (n = 12) or in all 24 sheep, based on long-chain alcohols + alkanes as markers and on individual, treatment mean or grand mean estimates of faecal marker recovery

†Within a row, means followed by different letters are significantly different (P < 0.05).
‡Bold type indicates MPE values which are lower than the equivalent obtained using alkanes only.
Observed and estimated means, differences and mean prediction error (MPE) between observed and estimated organic matter intake (g/day) using the labelled-supplement method in the diet in the caged sheep (n = 12) or in all 24 sheep, based on long-chain alcohols + alkanes as markers and on individual, treatment mean or grand mean estimates of faecal marker recovery

†Within a row, means followed by different letters are significantly different (P < 0.05).
‡Bold type indicates MPE values which are lower than the equivalent obtained using alkanes only.
The estimated proportion of CSM in the diet of the caged sheep differed significantly between diets (P < 0.05) when estimates were based on individual estimates of recovery, though by only 2 g CSM/kg OM. There were no significant differences when treatment mean recoveries were used, but when grand mean recoveries were used, there were significant between-diet differences in both the estimated proportion of CSM and the difference between this and observed proportions (P < 0.05). When faecal grab samples were used to estimate CSM proportion in all sheep, there were significant effects of diet (P < 0.05) on estimated CSM proportion and the difference between this and observed proportion, for estimates based on treatment mean and grand mean recoveries. There were no significant differences in MPE for CSM proportion attributable to diet or type of faeces sample. However, MPE increased progressively between estimates based on individual, treatment mean and grand mean recoveries, the last of which differed significantly (P = 0.01) from the other two. Of the 20 MPE values shown in Table 4, 75% were lower than the equivalent value obtained using alkanes alone. In order to quantify how much the use of (LCOH + alkanes) reduced MPE for estimated CSM proportion compared with alkanes alone, the ratio (MPE(LCOH + alkanes)/MPEAlkanes) was calculated. This ratio had a skewed distribution so it is more appropriate to quote a median than a mean value; the median value was 0.77.
Overall, the effects on the estimated total OM intake (Table 5) of diet and the method used to make faecal recovery corrections mirrored those described for CSM proportion. This was also the case for differences between estimated and observed intakes. There were no significant effects of diet or type of faeces sample on the MPE for estimated OM intake. There was a significant effect of the method used for recovery correction (P < 0.01), with MPE derived from grand mean recoveries being significantly greater than those based on individual or treatment mean recoveries, which did not differ significantly from each other. Of the 20 MPE values shown in Table 5, 65% were lower than the equivalent value obtained using alkanes alone. As with the MPE for the CSM proportion, the ratio (MPE(LCOH + alkanes)/MPEAlkanes) for the estimated OM intake was not normally distributed; its median value was 0.91.
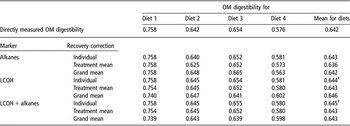
When diet digestibilities were computed from the EatWhat estimates of diet composition (Dove and Moore, Reference Dove and Moore1995; Charmley and Dove, Reference Charmley and Dove2007), values were very close to and did not differ significantly from the directly measured OM digestibilities. There were no effects of diet, marker type, type of faeces sample or recovery correction used on the digestibility of individual diets, or the differences between these and measured digestibilities (Table 6). The mean OM digestibility across diets, estimated using total faeces, individual estimates of recovery and either LCOH or (LCOH + alkanes) as markers did differ from the directly measured value of 0.642 (P < 0.05), but by amounts that have little biological significance (0.001–0.002; column 7, Table 6).
Comparison of directly measured organic matter (OM) digestibility in the caged sheep with digestibilities derived from diet composition estimates using EatWhat, and based on alkane, long-chain alcohol (LCOH) or LCOH + alkanes as markers and on individual, treatment mean or grand mean estimates of faecal marker recovery

†Values differ significantly from directly measured mean digestibility across diets.
Discussion
Our results extend our earlier work (Dove et al., Reference Dove, Scharch, Oliván and Mayes2002; Elwert and Dove, Reference Elwert and Dove2005; Charmley and Dove, Reference Charmley and Dove2007) not only by confirming that the labelled-supplement approach can be used to estimate the intake of forage components (and thus total forage intake) but also by demonstrating that improved estimates of diet composition and intake are obtained using a combination of LCOH and alkanes, rather than just alkanes alone.
Plant wax profiles of the forages and CSM
We have reported elsewhere on the alkane profiles of the diet components in the present study (Charmley and Dove, Reference Charmley and Dove2007) and drawn attention to the fact that the low alkane concentrations in phalaris, whilst typical of the species (Dove, Reference Dove1992), made it difficult to estimate diet composition and forage intake in diets containing large proportions of this species. By contrast, LCOH concentrations in the diet components were much higher than their alkane concentrations. This has been reported previously (Ali et al., Reference Ali, Mayes, Lamb, Verma and Ørskov2004; Bugalho et al., Reference Bugalho, Dove, Kelman, Wood and Mayes2004; Ali et al., Reference Ali, Mayes, Hector, Verma and Ørskov2005). In general, the LCOH concentrations we report confirm earlier reports (Bugalho et al., Reference Bugalho, Dove, Kelman, Wood and Mayes2004; Ali et al., Reference Ali, Mayes, Hector, Verma and Ørskov2005; Fraser et al., Reference Fraser, Theobald and Moorby2006) that the predominant LCOH of grass species are C26OH and C28OH. The high C30OH concentrations in subterranean clover, compared with the grass species (Table 2; Bugalho et al., Reference Bugalho, Dove, Kelman, Wood and Mayes2004), confirm the usefulness of this LCOH in distinguishing between the dicotyledons and monocotyledons in forage diets. Although phalaris has very low alkane concentrations, its LCOH concentrations are of similar magnitude to the other grasses, a point made earlier by Bugalho et al. (Reference Bugalho, Dove, Kelman, Wood and Mayes2004). As a result, in contrast to our work with alkanes (Charmley and Dove, Reference Charmley and Dove2007), no particular difficulties were encountered in the present study in using LCOH to estimate the composition of the diets containing high proportions of phalaris (Tables 3–5).
The LCOH are useful as additional diet composition markers because they provide discriminatory information that appears to be additional to that provided by the alkanes (Bugalho et al., Reference Bugalho, Dove, Kelman, Wood and Mayes2004; Figure 1 above). Hence, the overall discrimination between species effected by using the combination of LCOH and alkanes is superior to that provided by the alkanes alone.
Recovery of LCOH in faeces
Faecal LCOH recovery data have been reported by Ali et al. (Reference Ali, Mayes, Lamb, Verma and Ørskov2004) and by Fraser et al. (Reference Fraser, Theobald and Moorby2006). In the latter study, LCOH faecal recoveries increased from 0.92 for C22OH to 1.56 for C30OH, but the authors offered no explanation of why recoveries for C26OH–C30OH greatly exceeded 1.0. By contrast, Ali et al. (Reference Ali, Mayes, Lamb, Verma and Ørskov2004) reported that the recovery of LCOH in the faeces of sheep, whilst incomplete, increased with increasing carbon-chain length; unlike the alkanes, this increase was linear rather than curvilinear. Our data show the same trend, but with no suggestion that faecal LCOH recoveries were different in sheep fed Diet 4, as we reported for alkanes (Charmley and Dove, Reference Charmley and Dove2007). The LCOH recovery data from Ali et al. (Reference Ali, Mayes, Lamb, Verma and Ørskov2004) are also shown in Figure 4 (open symbols) and it is clear that the mean recoveries found in the present study are similar. Both data sets were well described by linear functions, which in fact did not differ significantly from each other (P > 0.25), implying that these two sets of data did not differ from each other. Accordingly, a common linear function was fitted to the combined data set, which indicated that faecal recovery of the LCOH was related to carbon-chain length (L) by the equation:

The fact that LCOH recovery could be described by a single linear function, rather than separate functions for the four diets in our study, or separate functions for our data and those of Ali et al. (Reference Ali, Mayes, Lamb, Verma and Ørskov2004), implies that the recoveries of given LCOH did not differ between the diet components. As Elwert et al. (Reference Elwert, Dove and Rodehutscord2008) discussed, the assumption of equal recoveries for a given marker compound is a necessary condition of using alkanes (or LCOH) to estimate diet composition and thus intake by the labelled-supplement method.
Ferreira et al. (Reference Ferreira, Oliván, Garcia, Rodrigues and Osoro2005) reported a significant negative relationship between diet digestibility and faecal alkane recovery. By contrast, in the present study there was no relationship between diet digestibility and faecal LCOH recovery.
Charmley and Dove (Reference Charmley and Dove2007) reported a close correspondence between the alkane concentrations in total faeces and in a rectal grab sample taken once daily. This was also the case with LCOH concentrations (Figure 3). Despite the close correspondence, the slope of the relationship between LCOH concentrations in total faeces and in grab samples (0.94 ± 0.013) differed significantly from 1.0. However, this appeared to be related mainly to the leverage exerted by the very high concentrations of faecal C30OH arising from subterranean clover consumption in sheep fed Diet 1. Exclusion of these points resulted in a slope of 0.99 ± 0.016, which did not differ significantly from unity. We conclude that, as shown with the alkanes (Dove et al., Reference Dove, Scharch, Oliván and Mayes2002; Charmley and Dove, Reference Charmley and Dove2007), rectal grab samples were representative of total faeces, despite the restricted, once-daily feeding conditions of the current study. This suggests that under field conditions, it would be valid to estimate diet composition from rectal grab samples collected once- or twice-daily. The recovery corrections required to correct faecal marker concentrations could be obtained from marker dosing and faecal sampling from a separate group of animals (e.g. Piasentier et al., Reference Piasentier, Saccà and Bovolenta2007). These mean recoveries would be equivalent to the ‘treatment mean’ recoveries used in the present study.
Estimation of diet composition
Our results indicate that overall, the most accurate estimates of diet composition were obtained using a combination of LCOH and alkanes as the markers to estimate diet composition (Figure 4; Tables 3 and 4). Seventy-five per cent of the MPE for the CSM proportion in the diet, based on (LCOH + alkanes), were lower than the equivalent MPE based on alkanes alone (Table 4).
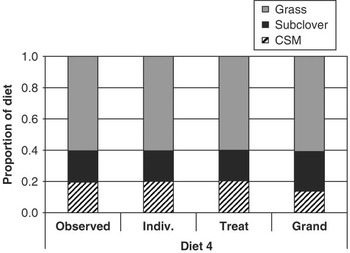
Perhaps surprisingly, given the better discrimination apparent for LCOH cf. alkanes in Figure 1, the estimates of diet composition based on LCOH alone and with either treatment mean or grand mean recovery corrections were actually worse than with alkanes alone. Examination of the data in Figure 4 suggested that this might have come about due to a failure to discriminate between phalaris and annual ryegrass in the EatWhat calculation of diet composition (see LCOH-based data for Diet 4). Further investigation suggested that this had occurred as a result of the strong correlation between the LCOH profiles of the phalaris and ryegrass (r = 0.989). Dove (Reference Dove1992) presented data indicating that, whilst it was difficult to distinguish subterranean clover and lucerne in herbage mixtures because their alkane profiles were highly correlated, total legume content of the mixtures was well estimated. By analogy in the present study, we recalculated the diet composition of sheep consuming Diet 4 based on the LCOH profiles of CSM, subterranean clover and a ‘total grass’ fraction. This resulted in excellent estimates of the total grass content of the diet (Figure 5), despite the difficulty in estimating the proportions of the individual grasses within the total grass fraction (Figure 4).
Observed and estimated proportions of subterranean clover, cottonseed meal (CSM) and a combined ‘grass’ fraction in caged sheep consuming Diet 4, with faecal recovery corrections as described in Figure 4.

Estimation of intake
Since OM intake was estimated from the estimated CSM proportion in the diet and the known intakes of CSM, intakes were also more accurate when based on (LCOH + alkanes) than when based on alkanes alone (Table 5 cf. Charmley and Dove, Reference Charmley and Dove2007).
As has been discussed elsewhere (Dove et al., Reference Dove, Scharch, Oliván and Mayes2002; Elwert and Dove, Reference Elwert and Dove2005; Charmley and Dove, Reference Charmley and Dove2007), a feature of the labelled-supplement method is that it requires the correction of faecal marker concentrations for incomplete recovery. As in our earlier report using alkanes as markers (Charmley and Dove, Reference Charmley and Dove2007), estimates of diet composition and intake were best when based on individual animal recoveries, since these reflect only the variance associated with differences between the marker profile of the forage offered to v. the forage actually consumed by individually fed animals, plus any laboratory error. The use of treatment mean recoveries introduces between-animal variance in recovery, whilst the grand mean recoveries also include a component due to the variance in recovery attributable to diet. The estimates of total OM intake thus became progressively less accurate in moving from individual to treatment mean to grand mean recoveries.
When intakes are estimated using the alkane method as originally conceived by Mayes et al. (Reference Mayes, Lamb and and Colgrove1986), it is not necessary to consider faecal recoveries, provided the dosed and the natural alkane have equal recoveries. As Dove and Mayes (Reference Dove and Mayes1996) demonstrated, if the pair of alkanes used to estimate intake should differ in their faecal recovery, a 1% difference in recovery will result in a 1.25% error in the estimate of intake. It is not in fact a necessary condition of the alkane method that both of the markers used to estimate intake should be alkanes. Dove and Mayes (Reference Dove and Mayes2005) pointed out that intake could validly be estimated using a plant LCOH and a dosed alkane, provided that the assumptions of equal faecal recovery of dosed and natural marker were met. The animals in the present study had been dosed with intra-ruminal, CRD delivering alkanes C32 and C36 at the estimated rate of 46.5 mg/day (see Charmley and Dove (Reference Charmley and Dove2007) for details). We therefore investigated the accuracy of intake estimates based on either C32 or C36 alkane as the dosed marker and C26OH, C28OH or C30OH as the natural marker. Intakes based on C26OH and either C32 or C36 alkanes consistently under-estimated measured intakes (Table 7); the converse was true for intakes based on C32 or C36 alkane coupled with C30OH. As expected on theoretical grounds, the ‘error’ in the estimate of intake thus appeared to be related to the difference in faecal recovery between a given dosed alkane/natural LCOH pair. The fitted relationships between the error (%) in the estimate of total OM intake for individual caged animals and the measured difference (DR, %) in their faecal alkane (C32 or C36) and LCOH (C26OH, C28OH or C30OH) recoveries were as follows:
Total organic matter (OM) intake in the 12 caged sheep (g/day), estimated using a combination of alkanes administered by controlled release device and natural long-chain alcohols (LCOH), and the relationship between differences in faecal recovery (%, LCOH-alkane) and the ‘error’ (%) in estimation of intake (estimated cf. observed intake)


The estimated error of 1.31% to 1.33% in intake for every 1% difference in recovery between the marker pair used to estimate intake is close to the theoretical value of 1.25% computed by Dove and Mayes (Reference Dove and Mayes1996), and to the value of 1.18%, which we earlier presented for intakes based on a range of alkane pairs (Charmley and Dove, Reference Charmley and Dove2007). The present data thus confirm the earlier suggestion that an alkane/LCOH pair could be used to estimate intake, provided they had equal or at least similar faecal recoveries.
Estimation of digestibility
The data in Table 6 indicate that, as part of the estimation of diet composition using least-squares packages such as EatWhat, a useful feature is that whole-diet digestibility can also be estimated, as earlier described (Dove and Moore, Reference Dove and Moore1995). Regardless of the plant wax marker used or of the method used to correct for incomplete faecal marker recovery, estimated digestibilities of the individual diets were all close to measured digestibilities and did not differ significantly from them.
Conclusions
Our data demonstrate that in using the labelled-supplement method, plant wax markers other than alkanes can be employed to estimate diet composition and total OM intake of diets consisting of up to five components. Significantly, they show that at least for the plant species used in our study, a combination of LCOH and alkanes allows better discrimination between diet components than either class of marker alone. As a result, the most accurate estimates of forage intake were those based on the combination of alkanes and LCOH.
Our results also confirm an earlier suggestion (Dove and Mayes, Reference Dove and Mayes2005) that an alkane/LCOH pair can be used to estimate intake by the ‘alkane’ method, provided the faecal recoveries of the two markers are similar.
Finally, recent studies suggest that even better estimates of diet composition and intake could be obtained by employing the long-chain fatty acids of cuticular wax as additional markers (Ali et al., Reference Ali, Mayes, Lamb, Verma and Ørskov2004 and Reference Ali, Mayes, Hector, Verma and Ørskov2005; Dove and Mayes, Reference Dove and Mayes2006).
Acknowledgements
We gratefully acknowledge the skilled technical assistance provided by Kim Kleven. We also thank Dr H.A.M. Ali and Dr R.W. Mayes for access to their data for LCOH recovery in faeces.