Low frequency ultrasound (20–100 kHz) has been applied for modifying food materials (Mason et al. Reference Mason, Paniwnyk and Lorimer1996; Tiwari et al. Reference Tiwari, Mason, Cullen, Brijesh, Valdramidis, Cullen, Tiwaril and Valdramidis2012). Sonication, sometimes in combination with heat, has been applied to processing of dairy products for modifying the properties of dairy proteins and their functionality (Villamiel et al. Reference Villamiel, van Hamersveld and de Jong1999; Villamiel & de Jong, Reference Villamiel and de Jong2000; Ashokkumar et al. Reference Ashokkumar, Bhaskaracharya, Kentish, Lee, Palmer and Zisu2010). Most studies in dairy systems have involved the use of low frequency ultrasound in the range of ∼20 to 100 kHz. For example, application of low frequency to milk improved the rheological properties of yoghurt (Wu et al. Reference Wu, Hulbert and Mount2000) or reduced turbidity of skim milk (Taylor & Richardson, Reference Taylor and Richardson1980). Some studies on skim milk deal with bacterial inactivation only without exploring the effects on native milk proteins (Wrigley & Llorca, Reference Wrigley and Llorca1992). Experiments on re-assembled casein particles made from casein powder in phosphate buffer confirmed that long ultrasonic treatments (35 or 130 kHz for 6 h) disrupted casein particles and re-formed smaller particles (Madadlou et al. Reference Madadlou, Mousavi, Emam-djomeh, Ehsani and Sheehan2009a, Reference Madadlou, Mousavi, Emam-Djomeh, Ehsani and Sheehanb). Chandrapala et al. (Reference Chandrapala, Martin, Zisu, Kentish and Ashokkumar2012) reported that the casein micelle size remain unchanged in sonicated (20 kHz) fresh skim milk.
While the effects of low frequency ultrasound (22·5 and 20 kHz) on the disruption of casein micelles in milk have been examined (Nguyen & Anema, Reference Nguyen and Anema2010; Chandrapala et al. Reference Chandrapala, Martin, Zisu, Kentish and Ashokkumar2012), no study has assessed these effects in systems using higher frequency and pH on casein micelles in milk. In this study, reconstituted skim milk at pH 6·7–8·0 was ultrasonicated in separate systems at 20, 400 or 1600 kHz at the same specific energy input (286 kJ/kg).
Materials and methods
The effects of ultrasound on reconstituted milk systems were studied by following the changes in particle size distribution and zeta potential of the protein particles in milk. To understand if changes in the protein particles in milk were accompanied by changes to colloidal calcium phosphate, 31P NMR was used to follow changes in distribution of phosphate between the micellar and serum phase of milk. In addition, changes to the assembly of proteins in milk due to ultrasound treatment were investigated.
Materials
Low-heat skim milk powder (moisture content, 3·65 % w/w) was obtained from Tatura Milk Industries Limited (Tatura, Victoria 3616, Australia). Gels for SDS-PAGE (Sodium dodecyl sulphate polyacrylamide gel electrophoresis) were supplied by Invitrogen Australia Pty Ltd (Mulgrave, Victoria 3170, Australia). Sodium azide, methylenediphosphonic acid and ammonium bicarbonate were obtained from Sigma-Aldrich Pty Ltd.
Preparation of milk samples
Reconstituted skim milk (20 % w/w total solids, TS) was made by dispersing low-heat skim milk powder in deionised water and stirring for 5 h at ∼23 °C prior to overnight storage at 4 °C. Sodium azide (0·02 % w/w) was added for preservation of the milk. Reconstituted skim milks (10 % TS) at various pH (6·7, 7·1, 7·5 and 8·0) were prepared by dilution of the 20 % TS stock solution and adjustment with 0·1 M NaOH. The unadjusted pH of the milk (10 % TS) at 20 °C was pH 6·68±0·05. All the milk samples prepared were stored at 4 °C overnight and used the next day. Milks were prepared on 3 separate occasions for ultrasound processing trials.
Particle size
The particle size distribution of milk samples was measured by dynamic light scattering (Malvern Zetasizer Nano ZS, Malvern, Worcestershire, UK). Milk samples were diluted for measurement with permeate obtained by ultracentrifugation and filtration. The method by Hemar et al. (Reference Hemar, Augustin, Cheng, Sanguansri, Swiergon and Wan2011) was used. Measurements were carried out using a scattering angle of 173° and laser with a wavelength 633 nm. The intensity average diameter (z-average diameter) of each sample was obtained from a Cumulates analysis correlation function, using a viscosity of 1 mPa.s and a refractive index of n=1·343.
ζ-potential
The ζ-potential of samples was measured by using a Malvern Zetasizer Nano ZS (Malvern, Worcestershire, UK). Prior to measurement, the sample (5 μl) was diluted in ultrafiltered permeate (1·5 ml), prepared as described above.
31P NMR spectroscopy
31P NMR spectra were obtained at 202·268 MHz on a Varian Inova 500 MHz NMR spectrometer (Varian (now Agilent Technologies)), 3100 Hansen Way Palo Alto, California, USA). The spectra were recorded at 23 °C, using 60° pulses and a 10 s relaxation delay. Spectra were normally accumulated over 500 transients. Samples were made up in a 10 mm NMR tube with a 3 mm capillary containing 4 mm methylenediphosphonic acid (Sigma M9508) which was inserted as a standard for integration of peak area as well as chemical shift. Chemical shifts are reported relative to external 85 % H3PO4. All measurements were in duplicate to ensure reproducibility.
Experimental spectra were analysed and integrated using MestRe-C version 2.3.
Protein analysis
The total true protein content, total casein content and total whey protein content of milk samples were determined as described previously (Walker et al. Reference Walker, Williams, Doyle and Dunshea2007). The factor 6·38 was used for conversion of nitrogen to protein content.
Proteins in the serum phase
Total nitrogen of milk was determined in a Leco FP-2000 nitrogen analyser according to the method described in the Provisional IDF standard 185 (IDF, 2000). Test portions (approximately 0·5 g weighed accurately to 0·0001 g) were transferred to sample crucibles fitted with nickel liners and dried. The nitrogen contents of the dry samples were then determined according to the instrument manufacturer's instructions using ethylenediamine tetra-acetic acid as calibration standard. True protein nitrogen was determined in a Leco FP-2000 nitrogen analyser following isolation of the protein by precipitation with 12 % trichloroacetic acid (TCA) following a modification of Barbano et al. (Reference Barbano, Lynch and Fleming1991) described in Walker et al. (Reference Walker, Williams, Doyle and Dunshea2007). Casein nitrogen was determined in a Leco FP-2000 nitrogen analyser following isolation of the protein by precipitation at pH 4·6 following a modification of the method of Lynch et al. (Reference Lynch, Barbano and Fleming1998) described in Walker et al. (Reference Walker, Williams, Doyle and Dunshea2007). Whey protein nitrogen was determined as true protein nitrogen – casein nitrogen. Non–protein nitrogen was determined as total nitrogen – true protein nitrogen. The factor 6·38 was used for conversion of nitrogen to protein content. Each sample was determined in triplicate.
Sodium dodecyl sulphate polyacrylamide gel electrophoresis
Pre-cast 4–12 % acrylamide gels (NuPAGE® Novex Bis Tris gels, Invitrogen Australia Pty Ltd, Mulgrave, Victoria 3170, Australia) were used. Electrophoresis under reducing conditions was performed as previously described (Williams et al. Reference Williams, D'Ath and Zisu2008).
Size-exclusion chromatography and characterisation of soluble aggregates
Size-exclusion chromatography was used to determine the amount of soluble aggregates and monomeric proteins in serum phase. Supernatants obtained as described above were filtered through a 0·2 μm disposable syringe filter unit and chromatographed following the method of Chandrapala et al. (Reference Chandrapala, Augustin, McKinnon and Udabage2010). Fractions were collected at one minute intervals using a FRC-10A fraction collector (Shimadzu, USA MFG Inc.). To obtain sufficient material for further analysis, fractions corresponding to the soluble aggregates (16–17 min) from four runs of each supernatant were combined then evaporated to dryness using a GeneVac concentrator (HT-4 series, GeneVac Technologies). For SDS-PAGE analysis, the dried fractions were re-dissolved in deionised water to restore the concentration to that of the original protein in the fraction collected. The collected fraction was also used for measurement of particle size and ζ-potential.
Ultrasound processing
Three ultrasound transducers were available for these trials: a 20 kHz horn-transducer unit (Branson Digital Sonifier, Branson Ultrasonic Corporation, CT, USA), a square 400 kHz plate-transducer unit (Submersible Transducers, Sonosys Ultraschallsysteme GmbH, Neuenbuerg, Germany) and a 1·6 MHz cylindrical plate-transducer unit (Nebulizer board, APC International Inc., Mackayville, PA, USA). The sonication conditions (power flow, sonication time, sample volume) were arranged so that a specific energy of 286 kJ/kg was provided to all systems. The 20 kHz horn-transducer (cross-section 3.1 cm2) was made of titanium and was operated for 15 min with 101 kW/m2 net power via radial vibration (mode of vibration). The 400 kHz plate transducer (cross-section 100 cm2) was made of stainless steel AISI 303 (iron, chromium, nickel, copper) and was operated for 17 min with 8·6 kW/m2 net power via planar waves emanating perpendicular to the transducer wall created by an arrangement of four ceramic transducers. The 1600 kHz nebulizer (cross-section 3.1 cm2) was made of titanium alloys and operated for 34 min with 11 kW/m2 power.
As these transducers had different dimensions, different sized metallic reactor vessels were designed to minimise the milk sample volume in contact with the transducer and thereby minimise sound pressure variation throughout the vessel to ensure sound pressure homogeneity across the milk samples. The reactor vessels consisted of a cylindrical container (150 mm, height×45 mm, diameter) for the 20 and 1600 kHz transducer set-ups and a rectangular container (200 mm×40 mm×145 mm) for 400 kHz processing. The metal containers were immersed in an ice bath during ultrasound processing. The temperature was measured using a thermocouple placed in the centre of treatment container. The temperature profiles obtained during the application of ultrasound did not rise above 30 °C.
In preliminary experiments with the 20 kHz transducer, various specific energy inputs (0–400 kJ/kg) were used and casein micelle size was measured. A steady decrease in casein micelle size was observed when the specific energy input was increased from 0 to 250 kJ/kg, and there was no further decrease in particle size when the specific energy input was further increased up to 400 kJ/kg (data not shown). For all other ultrasound treatments described hereafter, the specific energy used was 286 kJ/kg. This was achieved in the different ultrasound processing set-ups by using the minimum possible sample volume and adjusting the processing time to match the specific energy delivered to the sample. The minimal sample volumes achieved for the 20, 400 and 1600 kHz transducer set-ups were 100, 300 and 25 ml, respectively. The power input into the sample was estimated by calorimetry. The increase of the sample temperature, in foam insulated treatment chambers, induced by ultrasound processing was measured. The power input was calculated using the following equation: P=mC p (dT/dt), where P is power input in watts (W), C p is the specific heat capacity of the water (4·18 kJ/°C/kg), m is the mass of water (g), and dT/dt is the increase of temperature of the sample in a defined processing time (120 s). The specific energy input was calculated as follows: Es=Ptm−1, where Es is specific energy (kJ/kg), P is power input (W), t is the processing time (s) and m is the mass of sample (g). All ultrasound processing treatments were carried out at least in duplicate.
Acoustic intensity
A probe hydrophone (model TC4038, Reson, Goleta, USA) and a needle hydrophone (Model HNC-1000, Onda Corp., Sunnyvale, USA) connected to an oscilloscope (TDS 2022C, Tektronix, Beaverton, USA) were used to measure the maximal pressure level reached at low and high frequency in the reactor vessels, respectively.
Free radical characterisation
A colorimetric method described by Alegria et al. (Reference Alegria, Lion, Kondo and Riesz1989) was used to determine hydrogen peroxide (H2O2) concentrations in a water matrix media, which is related to radical formation.
Experimental design and data analysis
All treatments and measurements were performed at least in duplicate. Statistical analysis of the data was performed using SPSS 17.0 SPSS Statistics Base, SPSS Inc. Chicago IL. USA. A confidence level of α=0·05 was used to evaluate significant differences.
Results
Ultrasonic reactors characterisation
The ultrasound pressure measured in the reaction vessel was 100 kPa (101·2 kW/m2), 150 kPa (8·6 kW/m2) and 85 kPa (11·2 kW/m2) for the 20, 400, and 1600 kHz systems, respectively. Even though the power intensity from the transducer was about 10 fold higher in the 20 kHz system in comparison with the other two, the maximum sound pressure level reached was of a similar value. This level of pressure remained constant throughout the trial.
The sonochemical efficiency of the transducers inside their respective containers was determined by the hydrogen peroxide yield. The concentration of hydrogen peroxide at the end of sonication (resulting from the formation of OH and H radicals) was 8·3, 34·2, and 8·5 μm, in the 20, 400, and 1600 kHz system, for 15, 17, and 34 min sonication, respectively. The higher concentration of hydrogen peroxide and sonochemical products, found in the range of 300 to 400 kHz, has been documented in various reports (Koda et al. Reference Koda, Kimura, Kondo and Mitome2003; Ashokkumar et al. Reference Ashokkumar, Sunartio, Kentish, Mawson, Simons, Vilkhu and Versteeg2008) due to increased free radical formation from high temperatures produced during bubble collapse. Even by duplicating the processing in the 1600 kHz system, the free radical formation was lower than in the 400 kHz system. Hydroxyl radical formation has not been directly associated with the acoustic pressure in the system (Henglein & Gutierrez, Reference Henglein and Gutierrez1993).
As the 20 kHz sonotrode was held from the upper part inside a cylindrical container, radial pressure had maximum reflection against the container walls and bottom. The distance from the sonotrode tip to the bottom of the container was minimal (3 cm) and therefore, even though the highest sound intensity is found near the tip of the sonotrode (Trujillo & Knoerzer, Reference Trujillo and Knoerzer2011), it can be assumed that the low frequency sound radiation was relatively even throughout the milk sample. The 1600 kHz nebulizer, was located at the bottom of a cylindrical container (same dimensions as the 20 kHz container) to maximise sample contact. A turbulent pressure jet was formed in the middle of the sample indicating that sound pressure was stronger across the centre of the cylinder. Here, because a small volume (25 ml) was used to maximise specific energy, it can be assumed that all sample was able to receive relatively uniform treatment.
The 400 kHz plate transducer was placed against the wall of a rectangular container. Radiation of planar waves perpendicular to the opposite wall created a standing wave system, not achievable with a horn-type of transducer geometry. Even though the systems may have achieved some degree of sound pressure homogeneity, they may not be comparable due to variations in pressure levels achieved or in levels of free radical formed. Therefore, systems will be treated in isolation.
Milk characteristics
Particle size
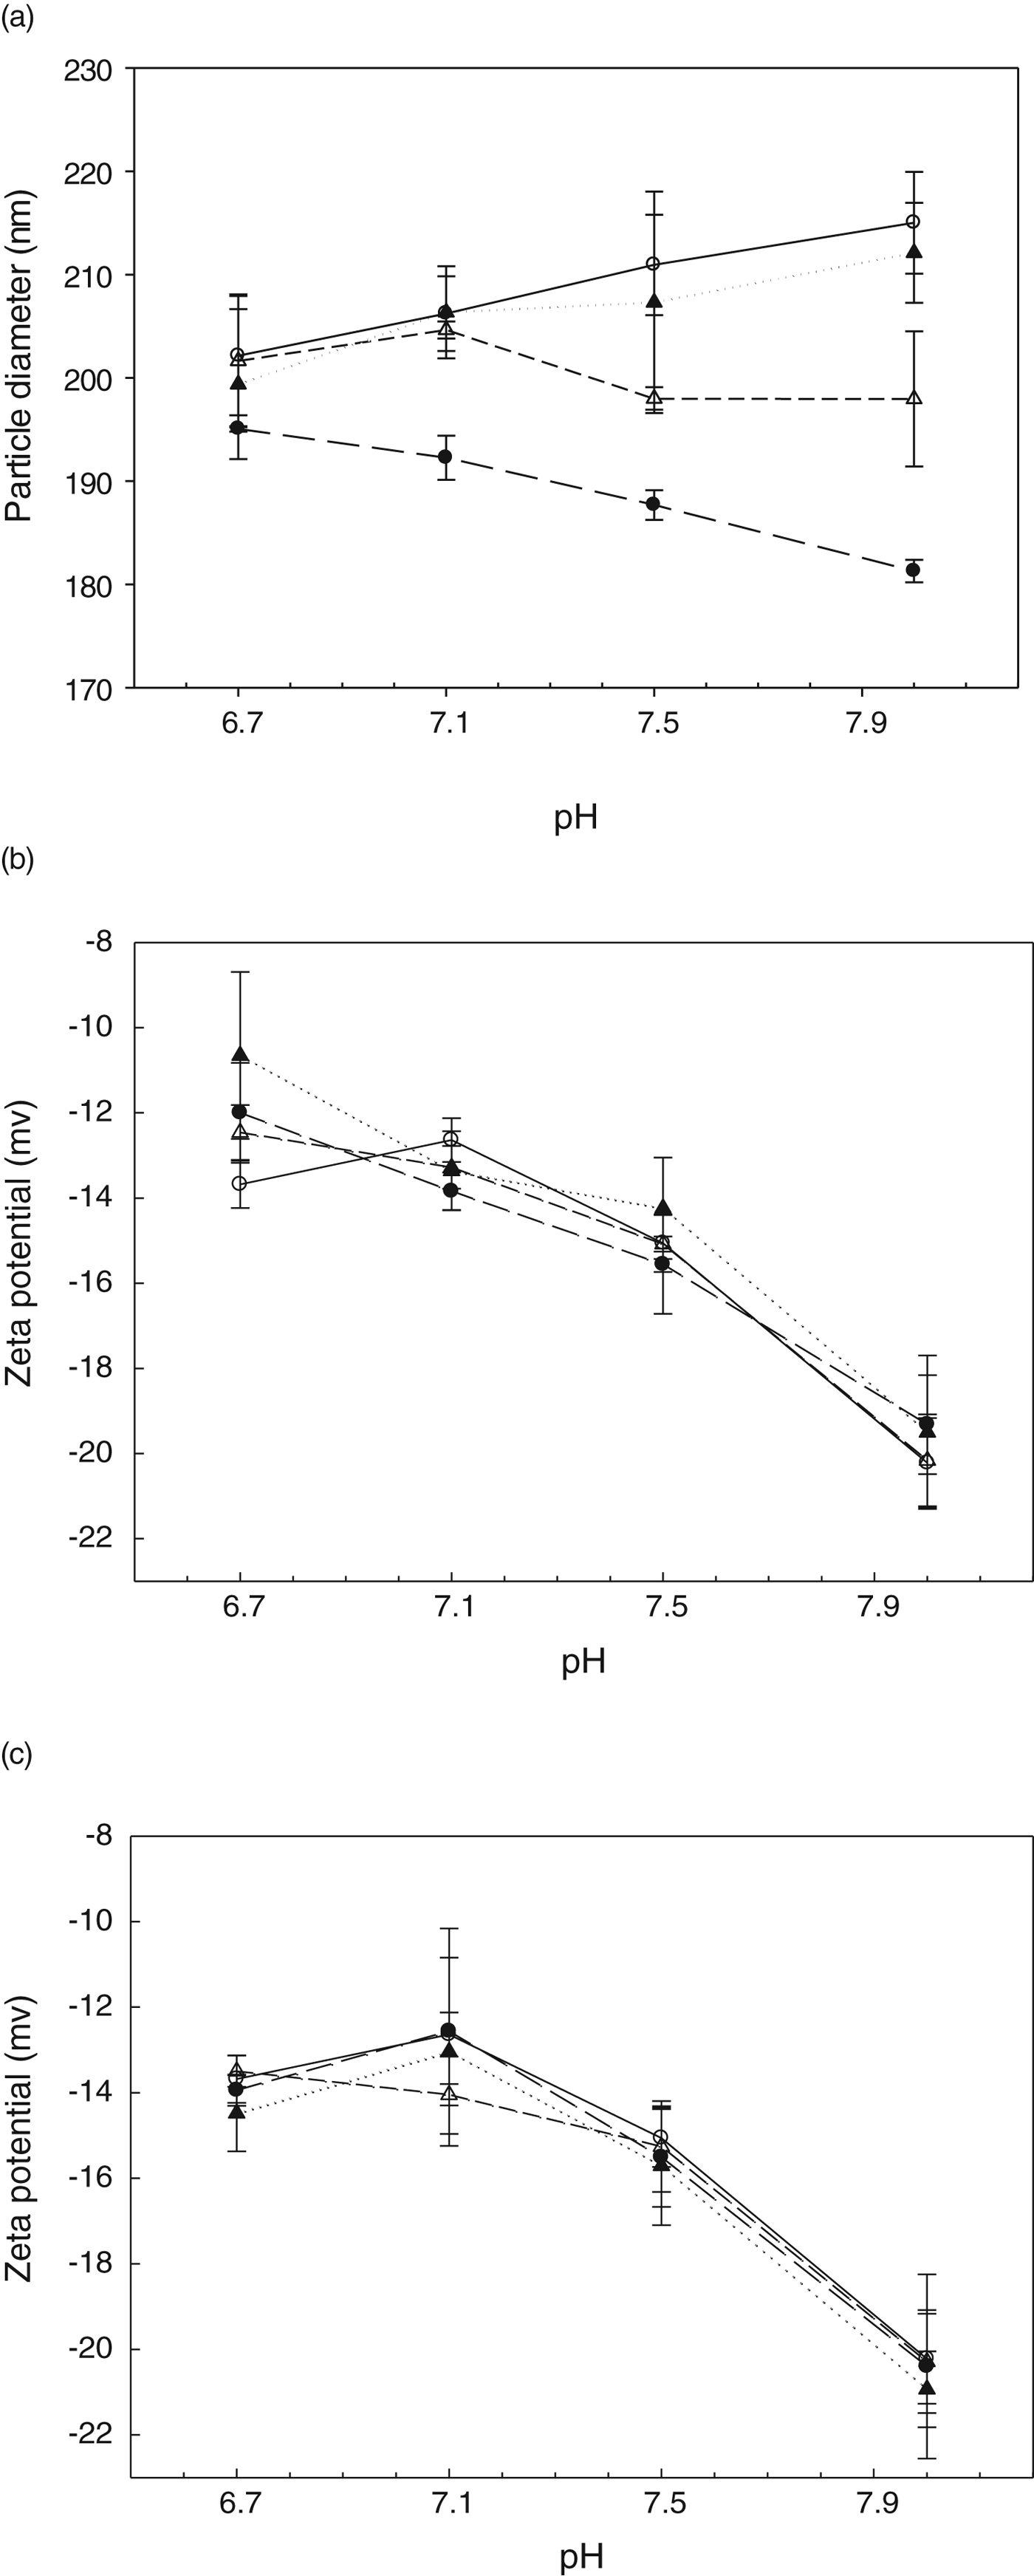
The mean particle size of the casein micelles in milk was 202±6 nm at pH 6·7. The ultrasonication of milk (pH 6·7) at 20 kHz decreased the particle size of the casein micelle. The casein micelle size in non-sonicated milk increased with increasing pH over the range pH 6·7–8·0 (Fig. 1a). This is expected as the negative charge on the proteins increase with pH, resulting in increased electrostatic repulsion between the casein units and swelling of the micelle. The ultrasonicated milk at 1600 kHz gave similar increases with pH to the non-sonicated milk, suggesting that at this frequency ultrasound did not disrupt micelles. In contrast, ultrasonication at 20 or 400 kHz reduced the particle size of the casein micelles as the pH of the milk was raised. Ultrasonication at 20 kHz caused significant reduction (P<0·05) of particle size at all pH values. Ultrasonication at 400 kHz caused significant reduction (P<0·05) of particle size at pH 7·5 and 8·0. These results suggest that the disruptive effects of ultrasonication on casein micelles were most evident with low frequency (20 kHz) ultrasonication and the effects at each of the applied ultrasound frequencies were greater as the pH of the milk was increased (Fig. 1a).
Milk characteristics as a function of pH. (a) Mean particle diameter of milk (b) ζ-potential of milk and (c) ζ-potential of non-sonicated milk and soluble aggregates isolated from ultrasonicated milk [(○)Non-sonicated milk, milk ultrasonicated at (●)20 kHz, (▵)400 kHz or (▲)1600 kHz; Data are the average±sd of 3 independent trials.].

ζ-potential
The ζ-potential of the particles in milk at pH 6·7 was −13·7 mV. The ζ-potential at natural pH (6·7) was in range (−8 to −25 mV) as observed previously by others (Ekstrand & Larssonraznikiewicz, Reference Ekstrand and Larssonraznikiewicz1984; Banon & Hardy, Reference Banon and Hardy1992; Wade et al. Reference Wade, Beattie, Rowlands and Augustin1996). The ζ-potential was more negative with increasing pH as expected. There were no significant changes (P>0·05) in the measured ζ-potential after the application of ultrasound, irrespective of the frequency of the ultrasound, except for the ζ-potential of ultrasonicated milk with pH 6·7 at 1600 kHz, which significantly changed to a less but still negative value compared with non-sonicated milk (Fig. 1b). This suggests that the particles in both non-sonicated and ultrasonicated milks had similar surface charge.
Partitioning between the micellar and serum phase
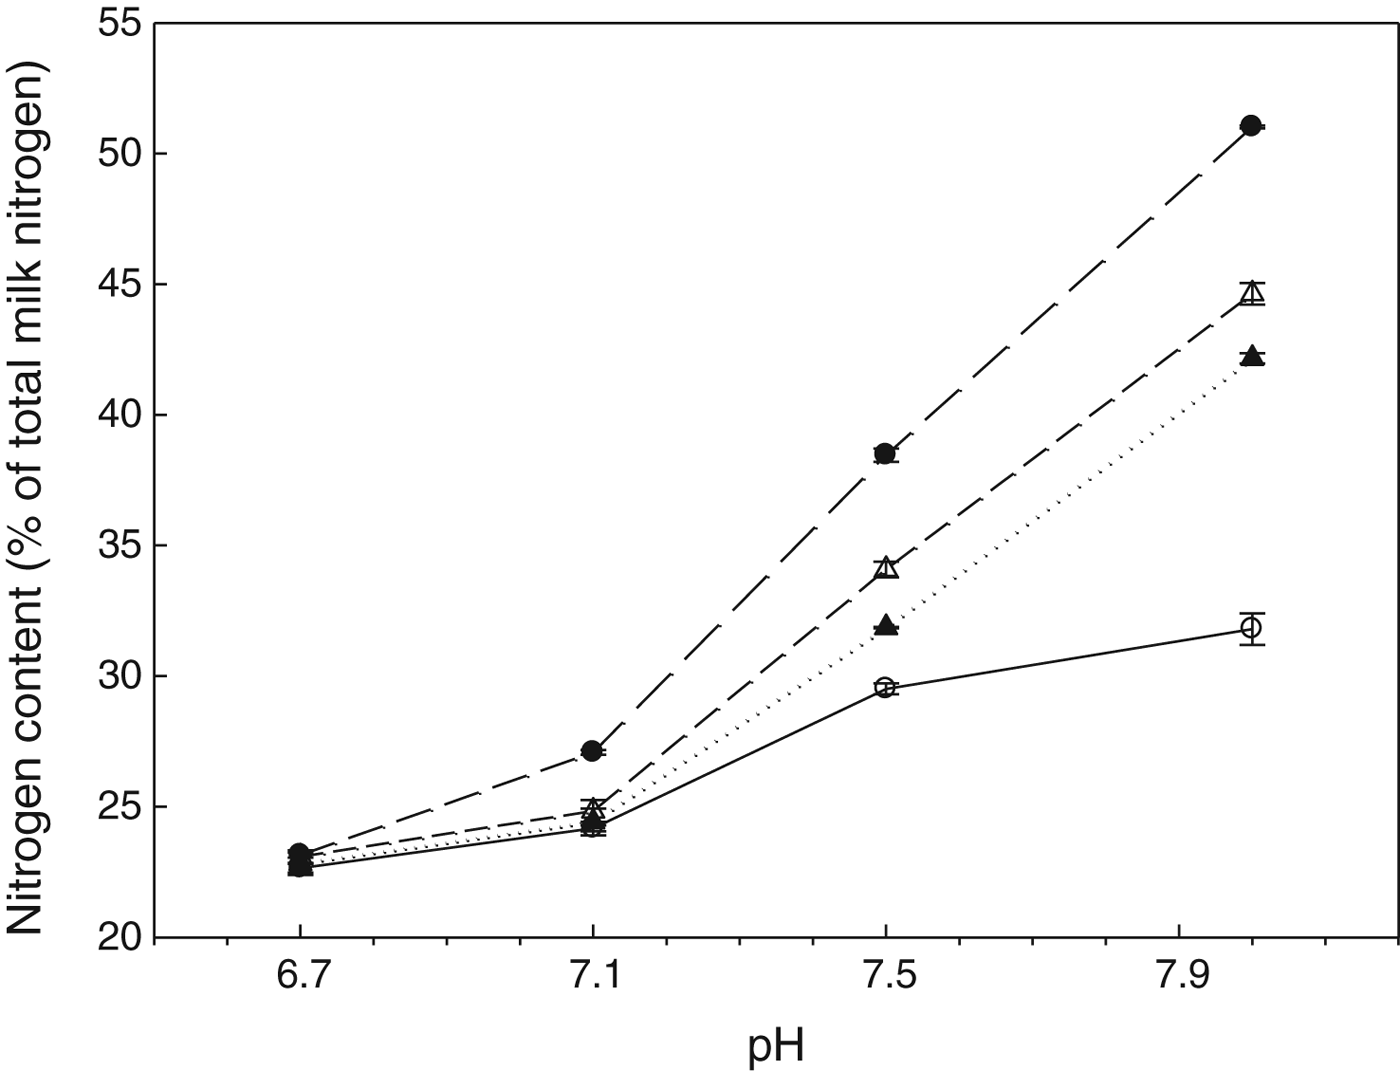
The milk used (10 % TS) contained 3·26 % total protein, of which 2·68 % was casein and 0·58 % was whey protein. The measured ratio of α-caseins:β-casein:κ-casein in the whole milk was 4·0:3·7:1·1. In milk (10 %TS, pH 6·7), the protein in the serum phase was 22·6 % of the total protein and comprised primarily the whey proteins. Increasing pH increased the total protein in serum of both non-sonicated and ultrasonicated milks (Fig. 2).
Nitrogen content of supernatant obtained on ultracentrifugation. [(○) non-sonicated milk and milk ultrasonicated at (●)20 kHz, (▵)400 kHz or (▲)1600 kHz at various pH. Data are the average±sd of 2 independent trials.].
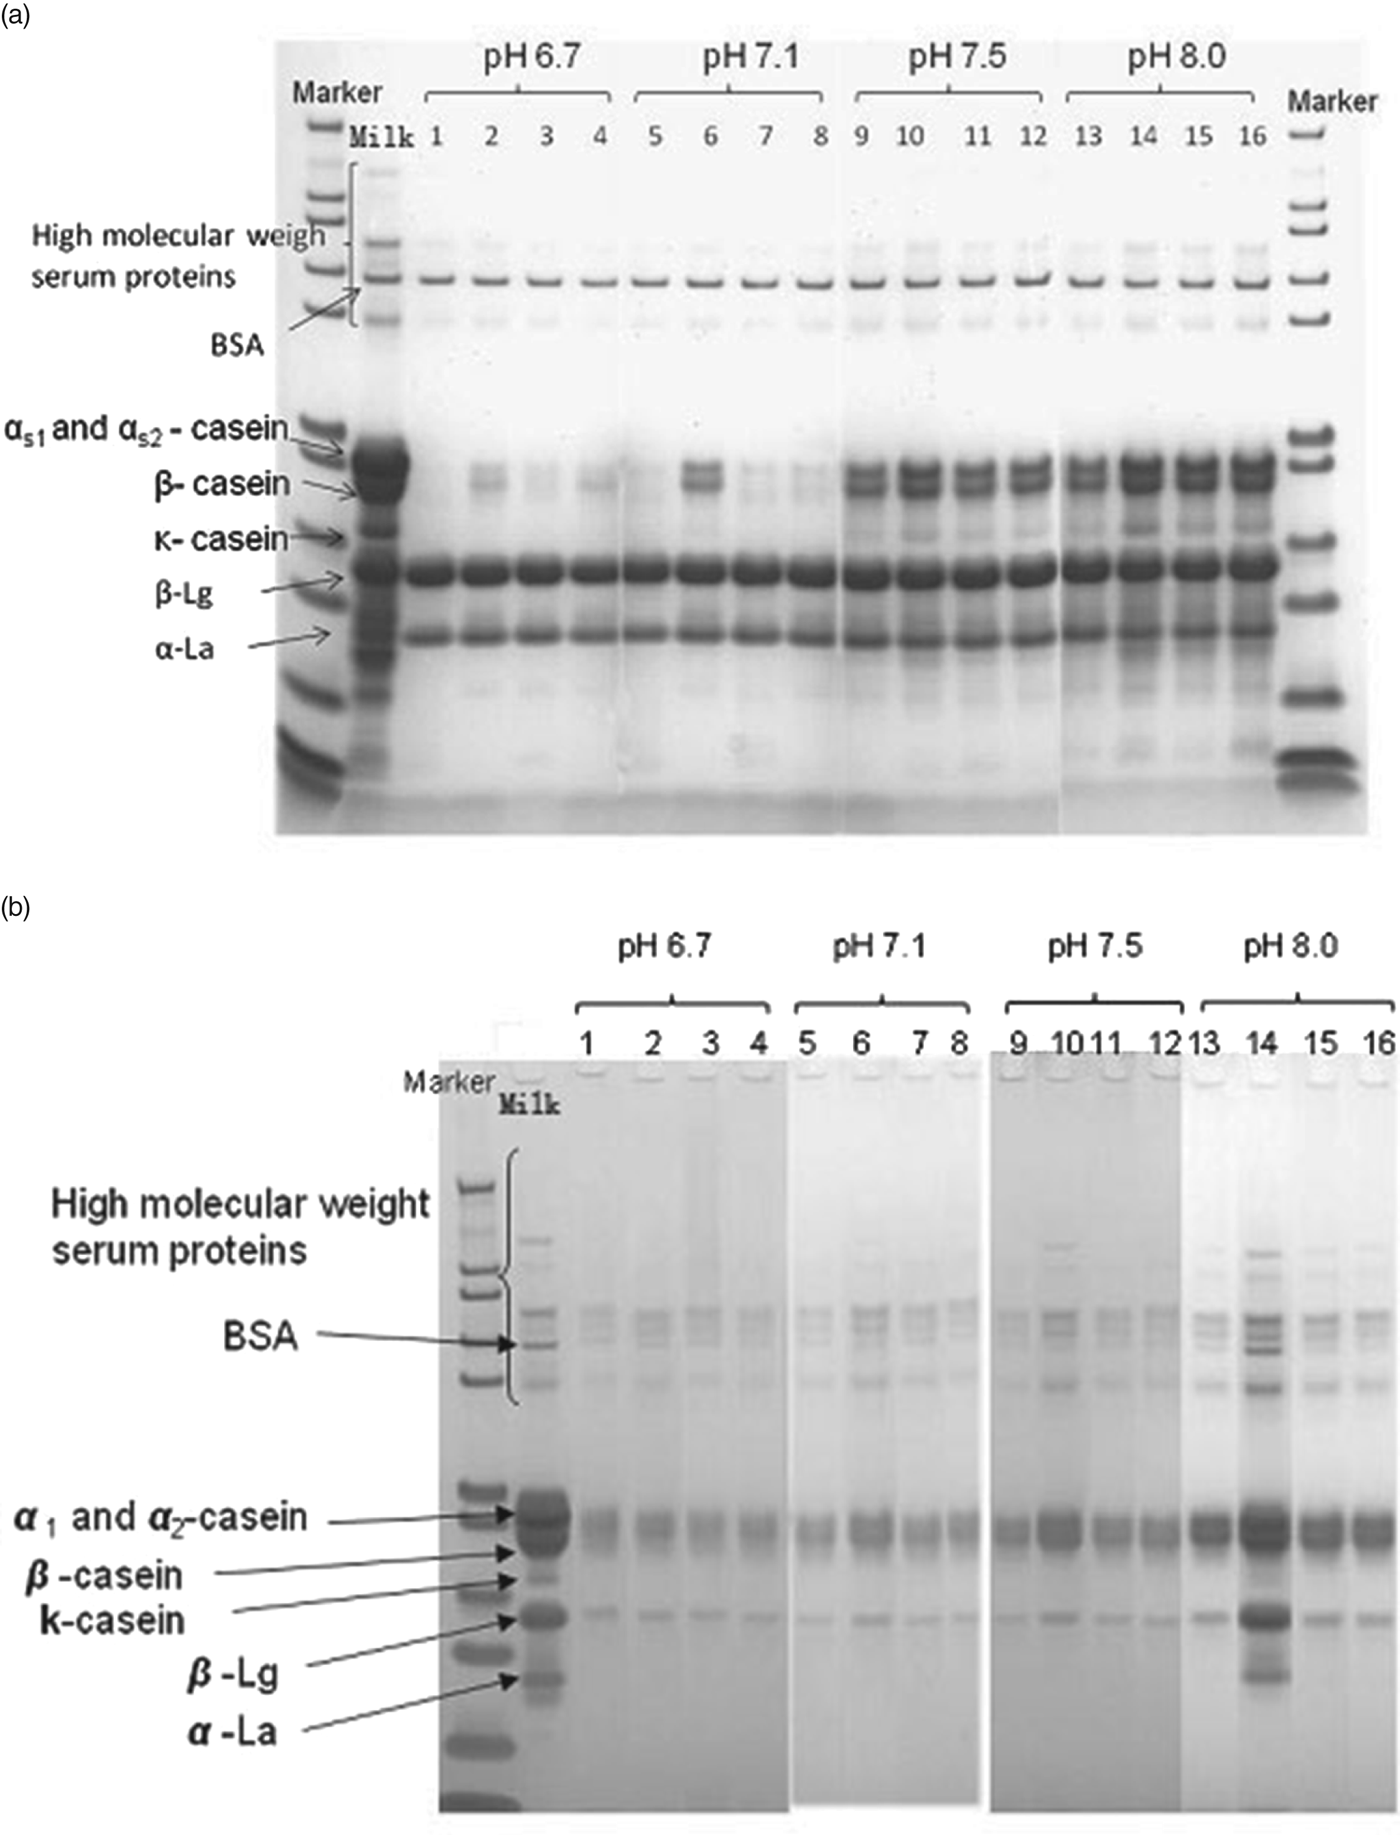
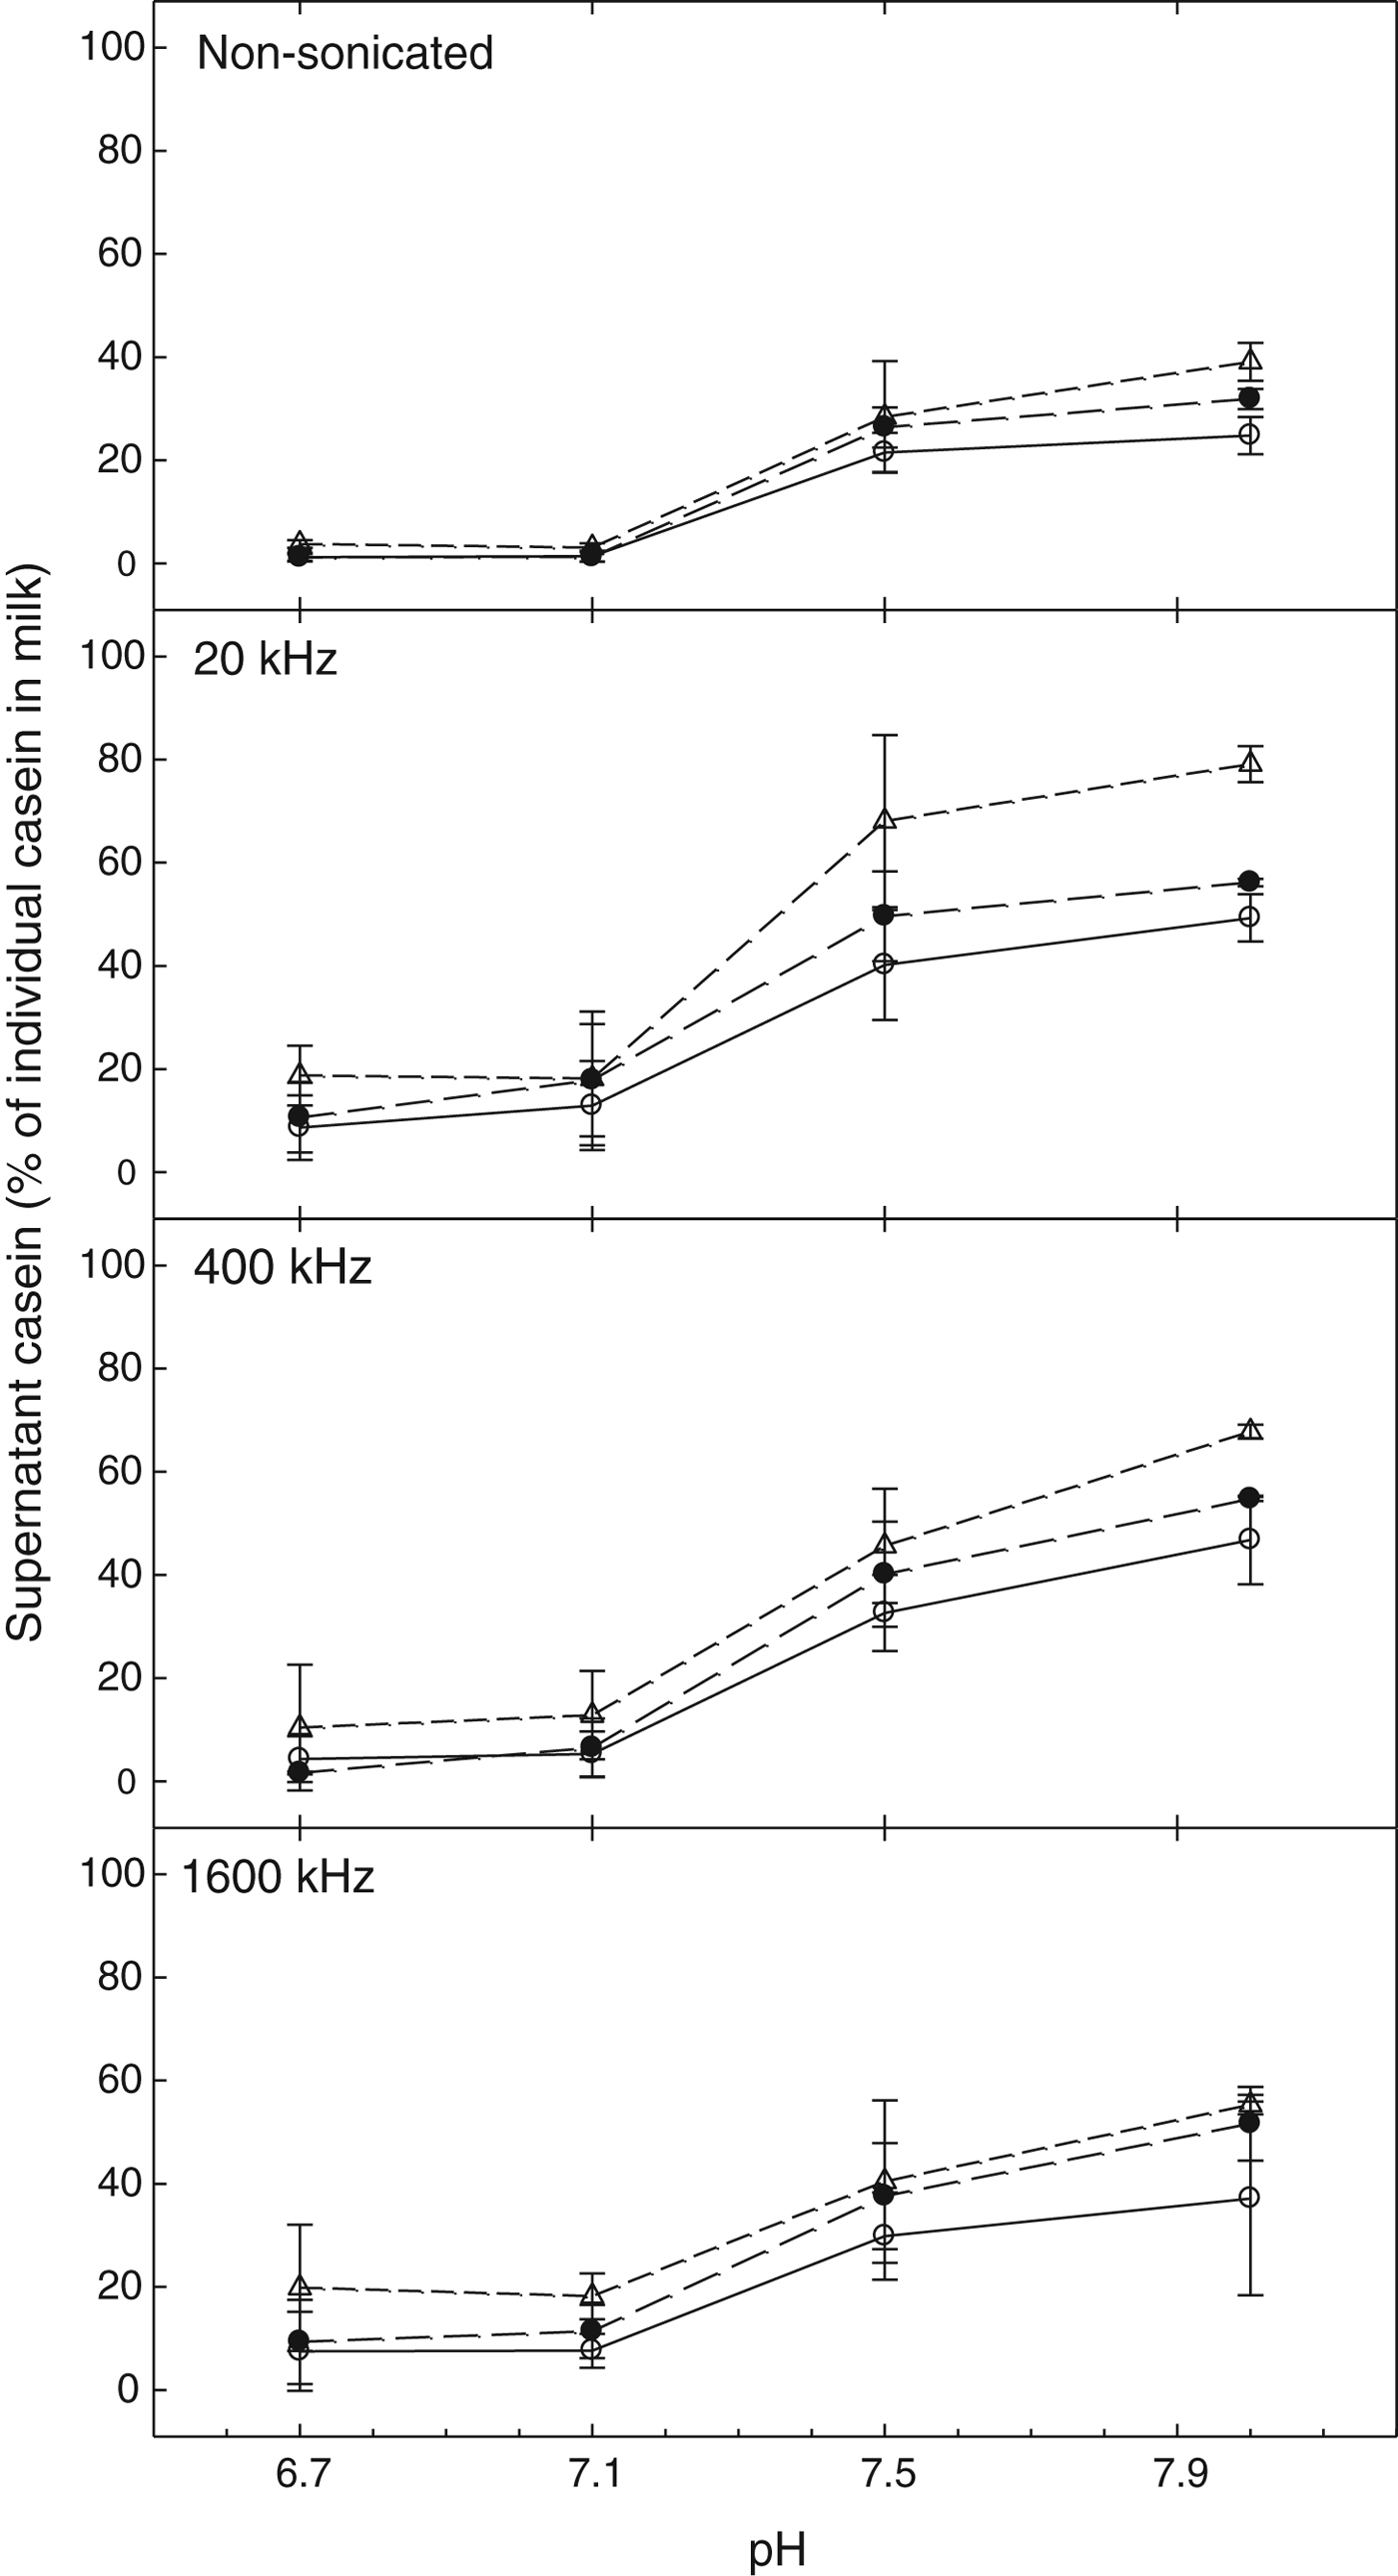
Increasing pH alone, without the application of ultrasound, caused an increase in the total protein in serum of non-sonicated milk from 22·6 to 31·8 % over the range pH 6·7 to pH 8·0 (Fig. 2). The increase was due to the release of caseins from the micelle (Fig. 3a). As shown in Fig. 2, ultrasound treatment of milk at pH 6·7 did not significantly (P>0·05) alter the serum protein concentration at any of the frequencies used. However, increasing the pH of milk above pH 6·7 increased the protein in serum of ultrasonicated milk. The ultrasound-induced increase in serum protein with increasing pH was dependent on the frequency applied, with increased dissociation of protein into the serum obtained when the low frequency (20 kHz) was applied. The highest degree of dissociation of protein into serum (51·0 %) was observed in milks at pH 8·0 after ultrasonication at 20 kHz. This was significantly higher than the 44·6 and 42·1 % observed for milk ultrasonicated at 400 and 1600 kHz, respectively, and 31·8 % for non-sonicated milk (P<0·05) (Fig. 2). In all cases, the increase in protein in the serum was due to an increase in serum concentration of α-, β- and κ-caseins (Fig. 3a). There was no significant change in the total whey protein content of the supernatant (P>0·05) (data not shown). The absence of low molecular weight proteinaceous material in SDS-PAGE analysis suggests that ultrasound did not result in scission of covalent bonds. The level of α-, β- and κ-caseins in serum, expressed as a percentage of each of the individual caseins in non-sonicated milk at each corresponding pH, is shown in Fig. 4. Individual caseins tended to dissociate in the order of κ->β->α-casein, in both non-sonicated and all ultrasonicated milks.
SDS-PAGE gels. (a) Non-sonicated milk (pH 6·7) and supernatant from non-sonicated milk (Lanes 1, 5, 9, 13) and milk ultrasonicated at 20 KHz (2, 6, 10, 14), 400 kHz (3,7,11,15) or 1600 KHz (4,8,12,16) at various pH, (b) Non-sonicated milk (pH 6·7) and soluble aggregate fraction from non-sonicated milk (Lanes 1, 5, 9, 13) and milk sonicated at 20 KHz (2, 6, 10, 14), 400 kHz (3,7,11,15) or 1600 KHz (4,8,12,16) at various pH.
Casein in the supernatant obtained on ultracentrifugation of non-sonicated and ultrasonicated milk. [(○)α-casein, (●)β-casein and (▵) κ-casein expressed as the quantity of each casein in the supernatants as a percentage of the total amount of corresponding casein in milk. Data are the average±sd of 2 independent trials.].
31P NMR
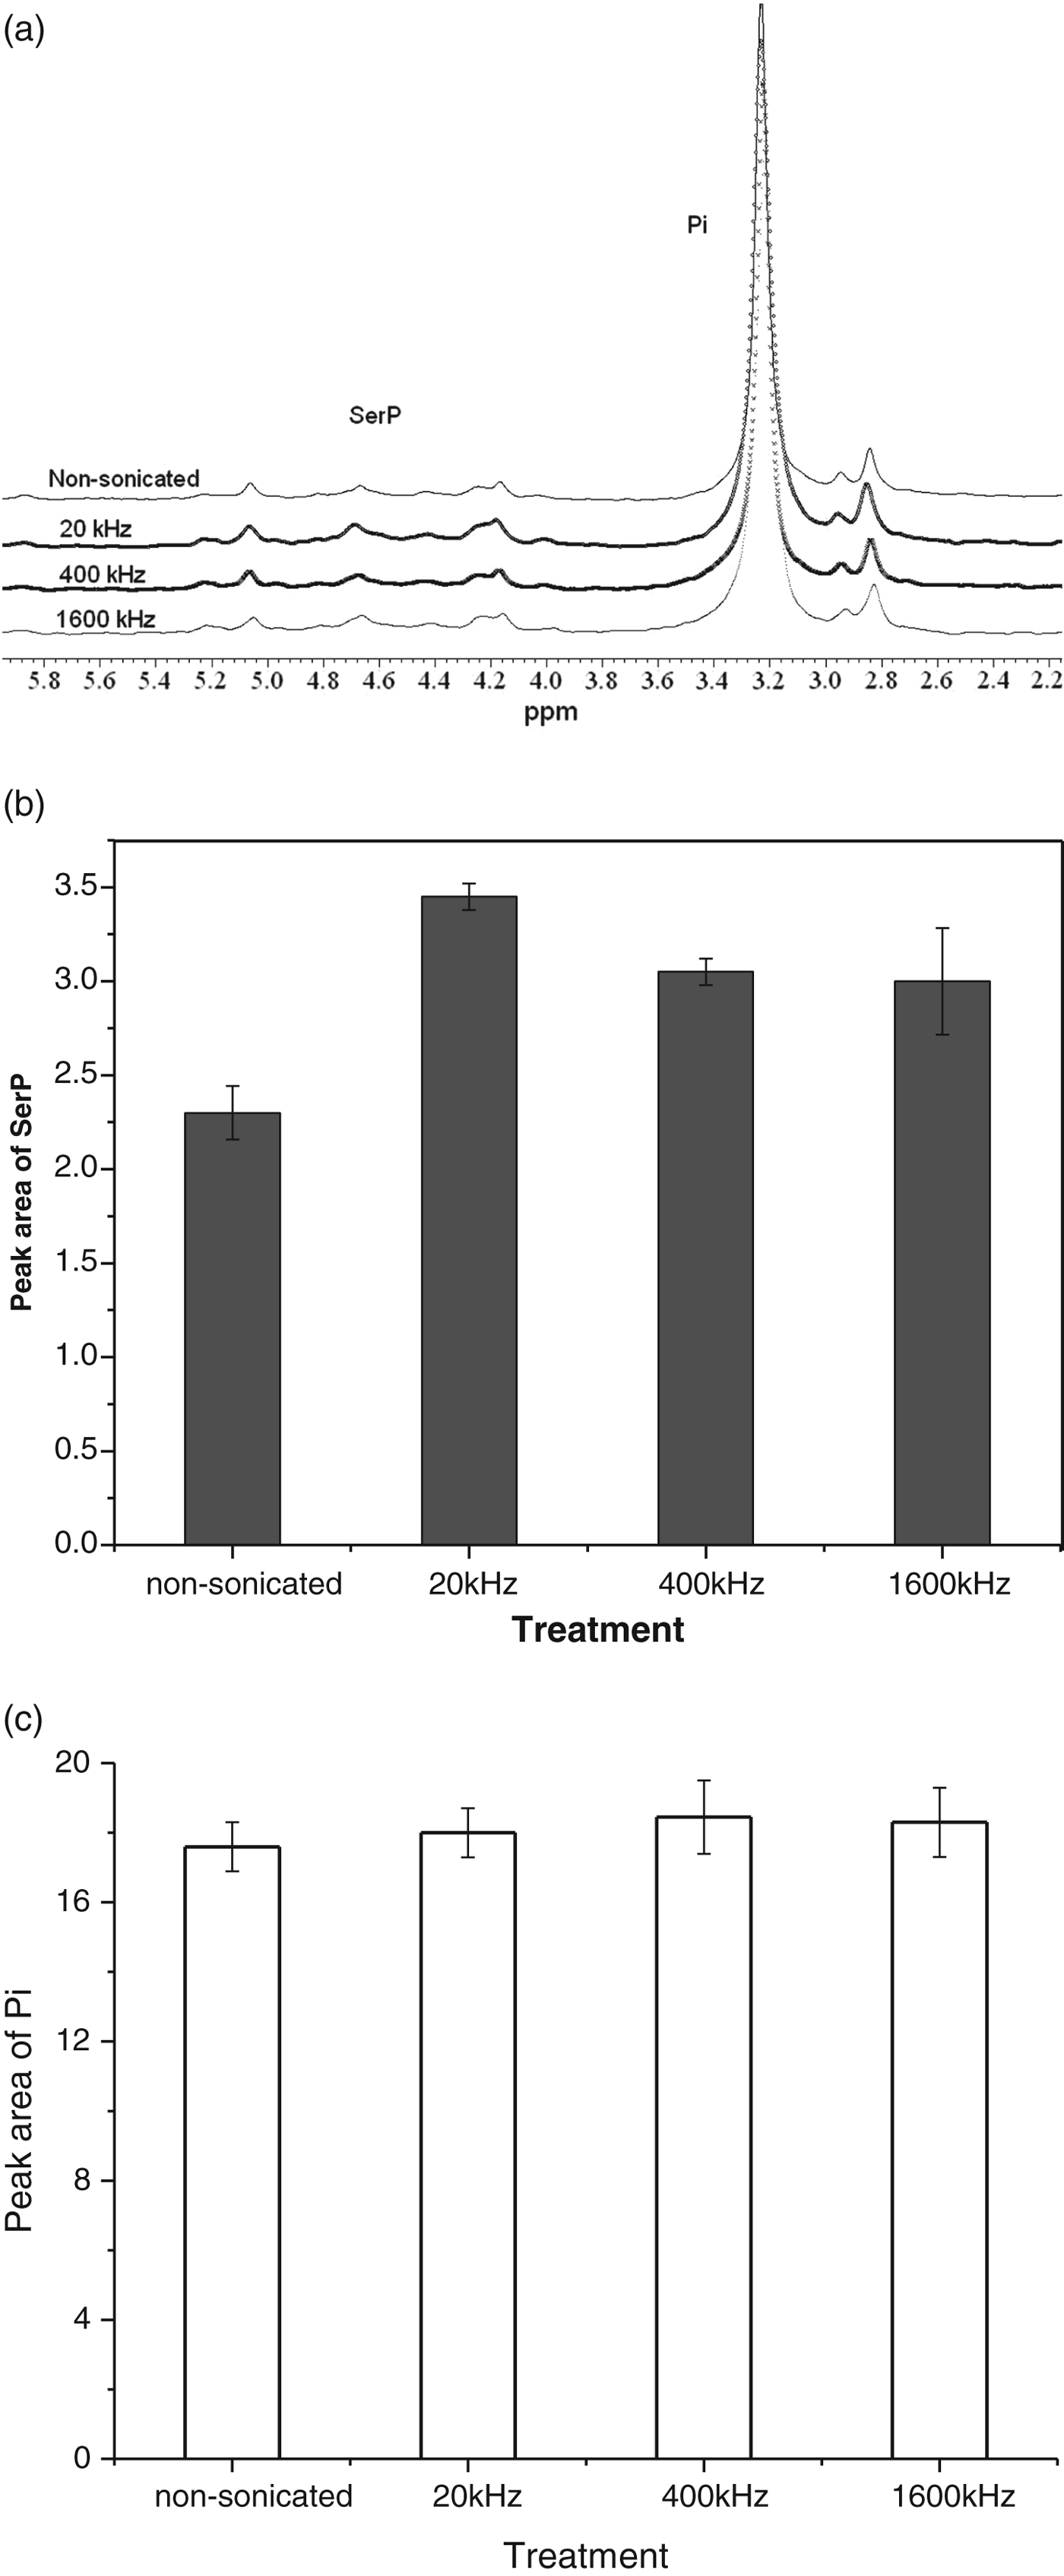
31P NMR spectra of milk supernatant from non-sonicated or ultrasonicated samples at pH 8·0 were obtained (Fig. 5a). The assignments of the peaks in spectra of the supernatant were based on previous studies of milk (Belton et al. Reference Belton, Lyster and Richards1985). The major peak at 3–3·6 ppm and the broad peak at chemical shift 4·1–5·2 ppm correspond to Pi and seryl phosphate (SerP) residues respectively (Ishii et al. Reference Ishii, Hiramatsu, Ohba and Tsutsumi2001). The integrated peak areas for SerP are shown (Fig. 5b). The phosphoseryl residue peak was significantly increased (P<0·05) after ultrasonication, especially at low frequency (20 kHz) which suggests an increased release of caseins into the serum (Fig. 5b). This is consistent with the information obtained from SDS-PAGE. Figure 5c shows the peak area of Pi in the serum. Although there was no significant change (P>0·05) there were small but noticeable changes in the absolute amounts of Pi. Taken together the results suggest that the altered partitioning of caseins into the serum is accompanied by changes in colloidal calcium phosphate.
31P NMR Analysis (a) Spectra of supernatant obtained from non-sonicated or ulrasonicated milk (pH 8·0) and (b) Peak area of SerP. [Data are the average±sd of 2 independent trials.].
Characteristics of soluble aggregates in serum
SEC profiles
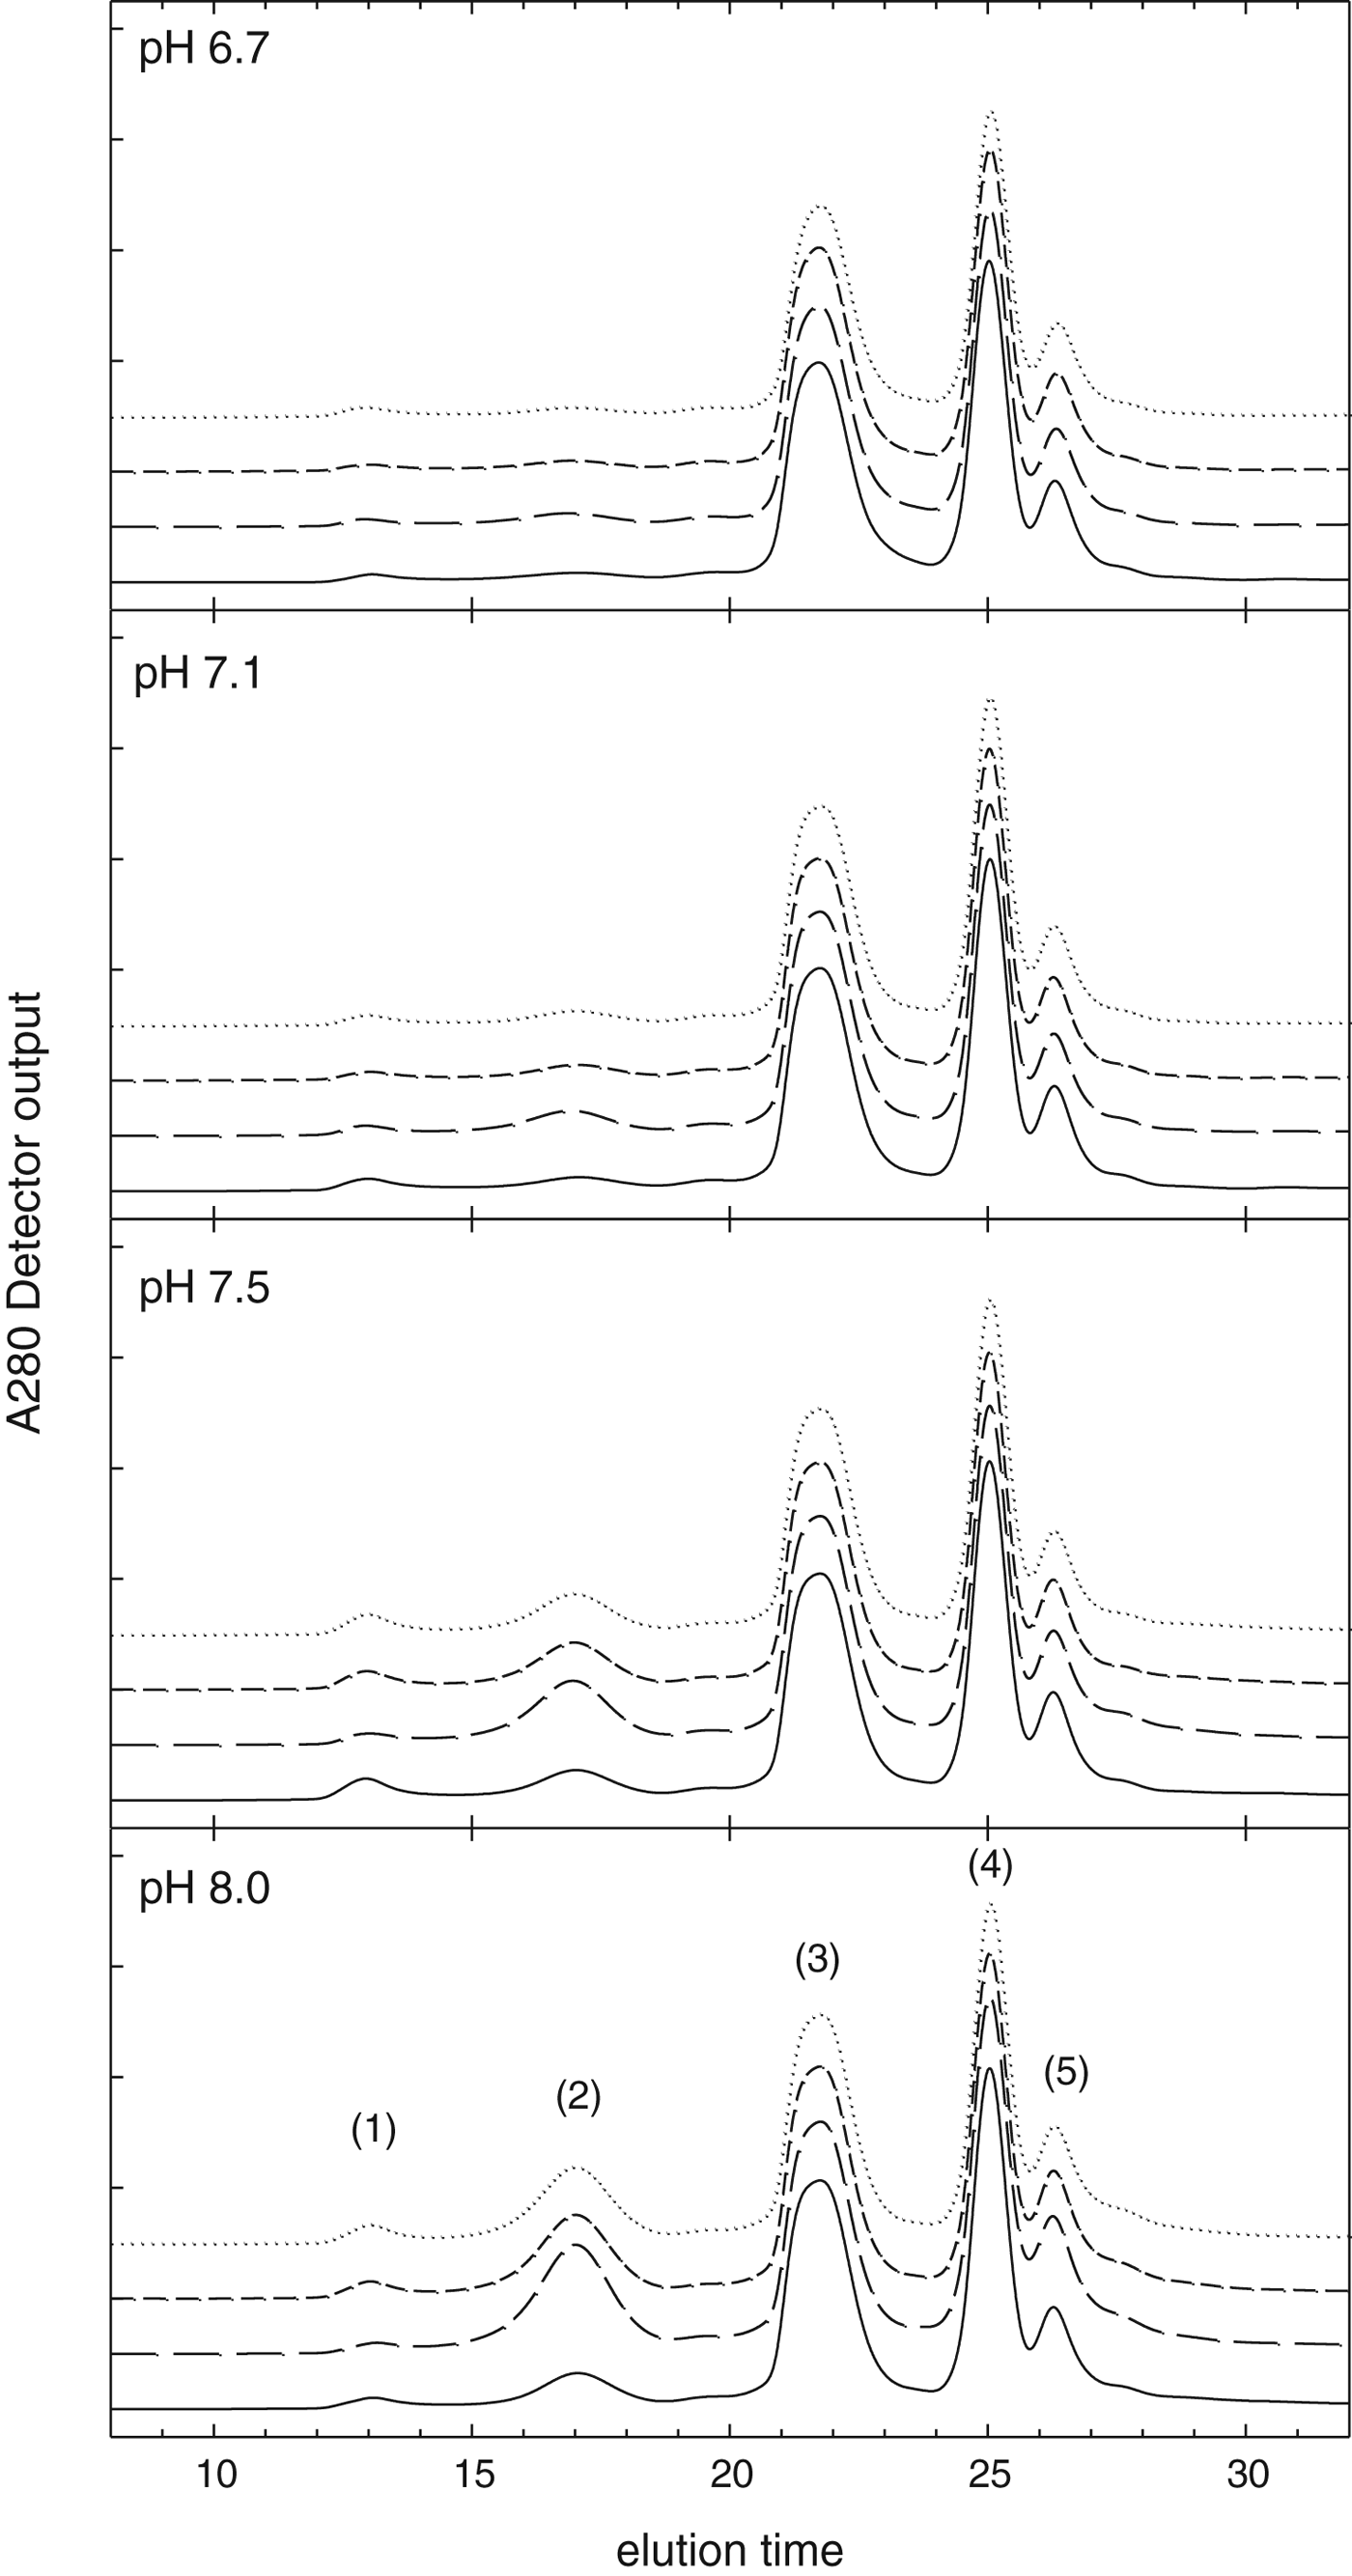
The SEC profiles obtained from sera of non-sonicated and ultrasonicated milks are shown in Fig. 6. The peak assignments, based on that obtained in previous work (Guyomarc'h et al. Reference Guyomarc'h, Law and Dalgleish2003; Donato & Dalgleish, Reference Donato and Dalgleish2006; Williams et al. Reference Williams, D'Ath and Zisu2008), were as follows: Peak 1 (excluded volume of the column), Peak 2 (soluble aggregates), Peak 3 (whey proteins) and Peaks 4 & 5 (orotic acid and other small solutes). In non-sonicated milk, the soluble aggregate peak (Peak 2) increased slightly with increasing pH. There was a negligible effect of ultrasonication of milk at pH 6·7 or 7·1 on the SEC profiles. However at higher milk pH (7·5 or 8·0), ultrasonication caused an increase in the soluble aggregate peak, with the largest increase observed at pH 8·0 after ultrasonication at 20 kHz (Fig. 6).
SE-HPLC profiles of supernatant obtained on ultracentrifugation: (——) non-sonicated milk or milk ultrasonicated at (– – – –) 20 kHz (- - - -), 400 kHz or (········) 1600 kHz at various pH. Peak (1) excluded volume, (2) soluble aggregates, (3) monomeric whey proteins, (4–5) orotic acid and other small solutes. [3 independent trials were carried out and similar results were obtained.].
Particle size, ζ-potential and protein components of soluble aggregates
The average particle size of the soluble aggregates (fraction collected at 16–17 min of Peak 2, Fig. 6) was 43 nm for all tested frequencies and pH. There is no previously reported information of particle size of ultrasound-induced soluble aggregates in milk in the literature.
The ζ-potential of the ultrasound-induced soluble aggregates ranged from −13·5±0·4 mV at pH 6·7 to −20·3±1·2 mV at pH 8·0 (Fig. 1c). As with the ζ-potential of particles in original milk (Fig. 1b), there was the expected increase in negative charge with increasing pH. The ζ-potentials of the ultrasound-induced soluble aggregates were not significantly different (P<0·05) compared with that of the casein micelle in the original milk, suggesting that the surface properties of the soluble aggregates formed from the dissociated caseins were similar to that of the casein micelles in the original milk.
The SDS-PAGE of the soluble aggregates separated from non-sonicated and ultrasonicated milk is shown (Fig. 3b). The intensity of the casein bands increased with increasing pH in both non-sonicated and ultrasonicated milk. At a given pH, the band intensity was greatest for the soluble aggregate peak obtained from the serum of milk ultrasonicated at 20 kHz, confirming that treatment of milk at 20 kHz increased the formation of soluble aggregates to a greater extent than treatment at 400 or 1600 kHz. The data also showed that only ultrasound (20 kHz) treatment of milk (pH 8·0) resulted in the incorporation of whey proteins into the soluble aggregates (3b). The presence of whey proteins in the soluble aggregate peak is presumably due to the inclusion of denatured whey proteins in the soluble aggregate fraction. However, from the SEC data and SDS-PAGE analysis, it is not possible to determine if the whey proteins in the soluble aggregate peak were whey proteins attached to casein or aggregates comprised only of whey proteins with the same hydrodynamic radii as casein aggregates.
Discussion
The particle size and ζ-potential data (Fig. 1) combined with the analysis of proteins in the serum phase by various methods (Figs. 2–6) used in this study all provided confirmatory evidence that ultrasound primarily disrupted the casein micelles in milk and that the dissociated caseins re-assembled into smaller particles with similar surface charge. This is despite the greater total surface area created by the increase in the number of smaller particles. Others have found that casein micelles of different sizes obtained by centrifugation have higher amounts of κ-casein (Dalgleish et al. Reference Dalgleish, Horne and Law1989) and have an expected different ζ-potential. However the fact that ζ-potential is the same in the re-assembled particles after application of ultrasound suggests that the relationship between κ-casein and particle size does not hold in this system. There is other evidence in the literature which also suggests that this relationship between κ-casein and particle size is not observed (de Kruif & Huppertz, Reference de Kruif and Huppertz2012; Bijl et al. Reference Bijl, de Vries, van Valenberg and Hooijdonk2014).
Ultrasound did not cause whey protein denaturation except in milk at pH 8·0 ultrasonicated at 20 kHz, as shown by the presence of whey proteins in soluble aggregates isolated from this milk (Fig. 3b). The presence of whey protein in aggregates is preceded by whey denaturation and this could be due to denaturation caused by adsorption to bubble surfaces (Xu et al. Reference Xu, Dickinson and Murray2007) as well as the greater localised heating occurring at lower frequency ultrasound processing (20 kHz) caused by the implosion of cavitation bubbles (Kentish & Ashokkumar, Reference Kentish, Ashokkumar, Barbosa-Cánovas, Feng and Weiss2011). As the high pH (pH 8·0) favours the denaturation of whey proteins (Law & Leaver, Reference Law and Leaver2000), these two factors possibly contributed to the denaturation of whey proteins.
Effect of pH
The increase in the particle size and increasing negative charge of the casein particles with increase in pH (Fig. 1), the increased solubilisation of proteins (Fig. 2) and the release of caseins observed on increasing pH from 6·7 to 8·0 (Figs. 3a & 4) are similar to that observed by other workers (Anema & Klostermeyer, Reference Anema and Klostermeyer1997; Liu & Guo, Reference Liu and Guo2008; Ahmad et al. Reference Ahmad, Piot, Rousseau, Grongnet and Gaucheron2009). The alkaline-induced dissociation of caseins from the micelles is driven by the increased negative charge on the individual caseins which cause swelling of the micelle and alterations to mineral-protein interactions (Ahmad et al. Reference Ahmad, Piot, Rousseau, Grongnet and Gaucheron2009).
Ultrasound application to milk at different pH altered the properties of the milk, with greater effects at higher pH when the same frequency was used. The larger effects of ultrasound at higher pH may be linked to a looser micellar structure as pH is increased, which facilitates transfer of caseins into the serum phase. This result corroborates the observations of others who also found that increasing pH increased the disruptive effects of ultrasound on re-assembled casein particles in reconstituted casein powder dispersions in phosphate buffer when ultrasound (35 or 135 kHz at 4·1 W per 100 ml for 6 h, corresponding to 885·6 kJ/kg) was applied (Madadlou et al. Reference Madadlou, Mousavi, Emam-Djomeh, Ehsani and Sheehan2009b).
Previous studies using low-frequency US application to reconstituted milk (Nguyen & Anema, Reference Nguyen and Anema2010) or fresh milk (Chandrapala et al. Reference Chandrapala, Martin, Zisu, Kentish and Ashokkumar2012) at natural pH show that US did not disrupt casein micelles. In our study, there was US-induced disruption of casein micelles (Fig. 1a) when the pH of milk was increased from the natural pH to pH 8·0 prior to ultrasonication.
Ultrasound effects in each tested system
The effects of ultrasound-induced changes were found to be greatest at low frequency (20 kHz) and was decreased at a given milk pH for each frequency. At low frequency (20 kHz) the changes observed on ultrasound application are primarily due to physical effects of cavitation, which cause localised shear effects and therefore enhance casein micelle dissociation. The frequency of the ultrasound influences the total number of bubbles that may be sonochemically active in the system (Leighton, Reference Leighton1995). Higher frequency ultrasound produces a larger number of pressure antinodes that may increase the number of active bubbles. As the frequency is increased, the cavitation bubbles become smaller. Therefore the force resulting from the implosion of cavitation bubbles is decreased (Leighton, Reference Leighton1995; Ashokkumar et al. Reference Ashokkumar, Lee, Kentish and Grieser2007, Reference Ashokkumar, Bhaskaracharya, Kentish, Lee, Palmer and Zisu2010). The linear resonance size equation and Blake Threshold Radius equation specify the boundaries for active bubble implosion (Yasui et al. Reference Yasui, Tuziuti, Lee, Kozuka, Towata and Iida2008). This means that with increasing frequency from 20 to 400 to 1600 kHz, the effects of shear on casein micelle dissociation will be reduced. Madadlou et al. (Reference Madadlou, Mousavi, Emam-djomeh, Ehsani and Sheehan2009a) showed the disruption of re-assembled casein particles in dispersions of casein powder in phosphate buffer by applying ultrasound at higher specific energy (35 kHz at 2–6·6 W per 100 ml for 6 h, corresponding to specific energies ranging from 432–1426 kJ/kg). These authors observed increased disruption of casein particles with increasing cavitation efficiency when the specific energy was increased at a fixed ultrasound frequency (35 kHz) and suggested that shear forces were responsible for these effects.
Our results which showed increased disruption of casein micelles in reconstituted milk with decreasing ultrasound frequency (from 1600 to 20 kHz) at the same specific energy (286 kJ/kg) were in contrast with previously reported effects of ultrasound frequency (35 and 135 kHz at a specific energy of 885·6 kJ/kg) on casein dispersions in phosphate buffer (Madadlou et al. Reference Madadlou, Mousavi, Emam-Djomeh, Ehsani and Sheehan2009b). These authors observed greater disruption of re-assembled casein particles in phosphate buffer by application of ultrasound at 135 kHz compared with 35 kHz when ultrasound was applied at the same specific energy. They suggested that higher concentration of free radicals and greater strain rates resulting from imploding cavitation bubbles generated by higher frequency were responsible for the greater effects at 135 kHz than at 35 kHz (Madadlou et al. Reference Madadlou, Mousavi, Emam-Djomeh, Ehsani and Sheehan2009b). It is possible that the altered responses to frequency between our work and that of Madadlou et al. (Reference Madadlou, Mousavi, Emam-Djomeh, Ehsani and Sheehan2009b) are due to the differences in the size and nature of the casein micelles in reconstituted milk compared with re-assembled particles in dispersions made with casein powder and phosphate buffer. These differences may have altered the interaction of the particles with the acoustic wave and therefore led to the altered response of the particles to different frequencies.
Soluble aggregates formed in ultrasonicated milk
This is the first study that reports the composition and characteristics of soluble aggregates formed by processing milk with ultrasound. The soluble aggregates found in the sera of milk ultrasonicated at 20 kHz, were comprised primarily of caseins (Fig. 3b), although small amounts of whey proteins were present in the aggregates formed when milk was ultrasonicated at pH 8·0. This contrasts with the soluble aggregates formed as a result of heat processing which are comprised mainly of β-lactoglobulin, α-lactalbumin and κ-casein linked through thiol-disulphide bonds in the mass ratio of 1–5 whey proteins to 1 κ-casein (Donato & Guyomarc'h, Reference Donato and Guyomarc'h2009).
The caseins released from the micelles re-associated in the serum phase to form aggregates with a smaller size than the original casein micelles but with similar surface charge (Fig. 1a, b), and without significantly affecting the partitioning of Pi between the micellar and serum phase (Fig. 5). The size of the low frequency ultrasound-induced soluble aggregates (43 nm) is within the range found in that of heat-induced aggregates (40–140 nm) obtained in heated milk (Vasbinder & de Kruif, Reference Vasbinder and de Kruif2003; Donato & Dalgleish, Reference Donato and Dalgleish2006). The ζ-potential of soluble aggregates in ultrasonicated milk (−13·5±0·4 to −20·3±1·2 mV over the pH range 6·7 to 8·0) was not markedly different from that of heat-induced soluble aggregates (−15 to −20 mV at pH 6·7 to pH 7·0) reported by Donato & Dalgleish (Reference Donato and Dalgleish2006).
The re-assembled aggregates carry the same charge as the original micelles due to the natural self-assembly behaviour of the caseins. It is generally considered that κ-casein largely locates to the surface of the native casein micelle during their natural assembly through driving forces for the self-assembly of caseins, as have been previously discussed (Holt, Reference Holt1992; Horne, Reference Horne2006). It is therefore likely that re-formed casein particles will also have a surface predominantly covered by κ-casein.
Ultrasound of milk disrupts casein micelles causing release of protein from the micellar to the serum phase and the re-assembly of the protein particles in milk. The properties and composition of the heat-induced aggregates can influence the functional properties of milk products (Donato & Guyomarc'h, Reference Donato and Guyomarc'h2009), and therefore it may be expected that ultrasound treatment, which introduces primarily casein-based aggregates, may also be used to introduce novel functionality in milk in a fashion that is different from that of heat treatment of milk.
Zheng Liu would like to acknowledge the award of Office of the Chief Executive (OCE) Scholarship from CSIRO and the RMIT School of Applied Sciences Scholarship from RMIT University for PhD studies.