INTRODUCTION
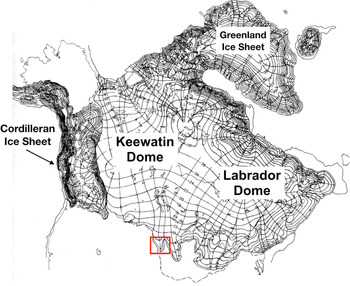
During the last glacial period, the southern terminus of the Laurentide Ice Sheet spanned more than 3000 km from South Dakota to Massachusetts, terminating in multiple lobes (Fig. 1). The dynamics that controlled the ice sheet margin remain incompletely understood; in particular, the timing of its maximum last glacial southern extent may have been asynchronous (Clayton and Moran, Reference Clayton and Moran1982; Hallberg and Kemmis, Reference Hallberg and Kemmis1986; Mickelson and Colgan, Reference Mickelson and Colgan2003). The easternmost five lobes underwent relatively early advances to their maximum positions before ~20.0 ka (e.g., Heath et al., Reference Heath, Loope, Curry and Lowell2018), whereas a limited data set indicates the western Des Moines Lobe in Iowa advanced to its maximum extent after ~16.1 ka (Lowell et al., Reference Lowell, Hayward and Denton1999). This difference between eastern and western sectors is important for understanding ice sheet dynamics. If the maximum extent was indeed asynchronous, this implies either internal glaciological control or external climatic control of individual regions. The purpose of this paper is to address this possible asynchronous pattern between the two sectors by expanding the western sector chronology. We focus on the westernmost of the terminal Laurentide lobes, the James Lobe of South Dakota, specifically a western offshoot here called the Pierre Sublobe.
Map of the Laurentide Ice Sheet during the last glacial period. Thin black lines represent approximate flowlines from the major ice domes, after Denton and Hughes (Reference Denton and Hughes1981). The red box is the area shown in Fig. 2. (For interpretation of the reference to color in this figure legend, the reader is referred to the web version of this article.)

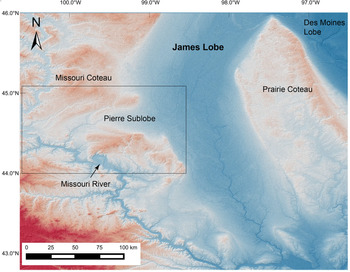
(color online) Digital elevation model of the central James Lobe showing the location of the Pierre Sublobe. The Missouri and Prairie Coteaus, which abut the James Lobe to the west and east, respectively, are indicated. The Pierre Sublobe cuts into the Missouri Coteau. The black box is the Pierre Sublobe, detailed in Fig. 3.

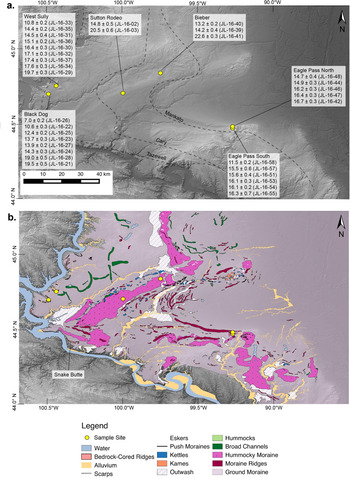
(a) Digital elevation model of the Pierre Sublobe. Yellow dots mark boulder sample sites. Surface exposure ages for each site are reported in thousands of years before present (ka). Drift limits as suggested by Flint (Reference Flint1955) are marked with dashed lines. They are labeled as “Tazewell,” “Cary,” and “Mankato.” (b) Surface geomorphic map of the Pierre Sublobe. (For interpretation of the references to color in this figure legend, the reader is referred to the web version of this article.)

The existing framework for James Lobe stratigraphy is based on the work of Flint (Reference Flint1955), who identified three surficial drift units deposited by the James Lobe during the late Pleistocene, called “Tazewell,” “Cary,” and “Mankato.” Subsequent county-scale geologic reports by the South Dakota Geological Survey have improved this work on a local scale. Multiple reports (e.g., White, Reference White1960; Duchossois, Reference Duchossois1993) provide stratigraphic cross sections and more detailed geomorphic maps. We use these reports as a basis for a new detailed geomorphic map of the Pierre Sublobe and surface exposure age dating of its landforms.
Cosmogenic surface exposure age dating by in situ 10Be has established a glacial chronology for the southern Laurentide Ice Sheet in New England (e.g., Balco et al., Reference Balco, Briner, Finkel, Rayburn, Ridge and Schaefer2009; Bierman et al., Reference Bierman, Davis, Corbett, Lifton and Finkel2015; Bromley et al., Reference Bromley, Hall, Thompson, Kaplan, Garcia and Schaefer2015; Davis et al., Reference Davis, Bierman, Corbett and Finkel2015; Hall et al. Reference Hall, Borns, Bromley and Lowell2017; Corbett et al., Reference Corbett, Bierman, Wright, Shakun, Davis, Goehring, Halsted, Koester, Caffee and Zimmerman2019). This method has been less successful in other places along the southern Laurentide margin, likely due to the degree to which postdepositional landscape activity (e.g., permafrost, erosion) affects the boulders.
Our objective is to develop a new geomorphic map of the Pierre Sublobe and a preliminary numerical glacial chronology for the James Lobe using 10Be exposure age dating.
Regional setting
During the late Pleistocene, the James Lobe occupied the James River Lowland of eastern South Dakota (Flint, Reference Flint1955; Clayton and Moran, Reference Clayton and Moran1982; Mickelson and Colgan, Reference Mickelson and Colgan2003. The lobe was flanked by two plateaus—the Missouri Coteau to the west and the Prairie Coteau to the east (Fig. 2). Its southernmost margin terminated at the Missouri River, based on till and moraine correlations by Flint (Reference Flint1955) and extensive mapping efforts by local state geologic survey workers (Christensen and Stephens, Reference Christensen and Stephens1967; Christensen, Reference Christensen1974; McCormick and Hammond, Reference McCormick and Hammond2004; Johnson and McCormick, Reference Johnson and McCormick2005).
The presence of the elevated Missouri Coteau along the James Lobe's western flank allowed for the preservation of glacial deposits associated with several ice-margin positions through the Pleistocene (Flint, Reference Flint1955). The James Lobe advanced westward onto the Missouri Coteau in several places, one example being to the Missouri River near Pierre, SD, which we refer to here as the “Pierre Sublobe” (Fig. 2). This lobe deposited a series of distinct, arcuate moraine ridges separated by extensive plains of ground moraine and stagnation deposits. Scattered, rounded igneous boulders on the western side of the Missouri River suggest an earlier expansion beyond the current river route (“Iowan” glaciation; Flint, Reference Flint1955); however, we focus only on the more recent glacial period. Based on the well-preserved, extensive moraines east of the Missouri River, Flint (Reference Flint1955) proposed three advances during the last glacial period. These phases were named “Tazewell,” “Cary,” and “Mankato,” with suggested ages of >20.0, 20.0, and 15.0 ka, respectively (Flint, Reference Flint1955; Clayton and Moran, Reference Clayton and Moran1982).
GEOMORPHIC MAPPING
Methods
The purpose of producing a geomorphic map of the Pierre Sublobe glacial deposits was to establish a relative age sequence of surficial features, as well as geologic context for the 10Be surface exposure age dating efforts. Geomorphic mapping was completed in two scales. A broad-scale map covering the entire Pierre Sublobe was based on Shuttle Radar Topography Mission (SRTM; earthexplorer.usgs.gov) imagery. This map served as a base for field mapping and verification. Finer-scale maps for each sampling site were made from drone-derived digital elevation models (DEMs). We discuss each method in turn.
SRTM 1 arc second (~30 m) resolution DEM files were downloaded as 1° tiles from the U.S. Geological Survey's EarthExplorer tool (earthexplorer.usgs.gov). The SRTM images were collected in 2000 and published online in 2014. The individual 1° DEM files were then uploaded into QGIS open-access geographic information system software (v. 2.8.1) and stitched together. With QGIS, hillshade layers were created using the DEM files. Surface features were classified based on their orientation, size, shape, and relief and divided into the following interpretive categories: ground moraine, hummocky moraine, moraine ridges, outwash, eskers, kames, kettles, scarps, bedrock, bedrock-cored ridges, and alluvium. In some cases, lithologic logs provided by the South Dakota Geological Survey were used to differentiate between bedrock ridges and moraine ridges. Local county reports produced by the South Dakota Geological Survey (Crandell, Reference Crandell1958; White, Reference White1960; Duchossois, Reference Duchossois1993) were also consulted for subsurface information and for map comparison.
To develop site-scale geomorphic maps for the sample sites, a drone flightpath was created for each site that covered the entire sample area. Postflight processing was completed using the Structure from Motion (Carrivick et al., Reference Carrivick, Smith and Quincey2016) algorithm employed by PhotoScanPro V. 1.4.2. by Agisoft (agisoft.com). Hillshade layers were created using QGIS v. 2.8.1 software. These site-specific DEMs are provided as Supplementary Figures 1–6.
Results of geomorphic mapping
We separate the mapping into three distinct regions, based on landform morphology (Fig. 3b).
1. The western region of the Pierre Sublobe is characterized by large ridges standing up to 40 m tall that wrap around massive gully systems that drain into the river trench. These features are surrounded by broad ground moraine with <1.0 m relief, as well as abandoned channels. These features were previously interpreted as terminal moraines due to their relief and the presence of boulders (Flint, Reference Flint1955). However, subsequent mapping and drill cores have revealed that these features are actually bedrock-cored buttes overlain by ground moraine. Further, one lithologic log (core location 111N79W17ADDD; South Dakota Geological Survey Lithologic Log Database http://cf.sddenr.net/lithdb) from Snake Butte (Fig. 3) suggests that these bedrock-cored buttes are overlain by a relatively thin (~10 m) layer of till. This lithologic log also indicates that these features consist of a continuous, in situ bedrock sequence with no evidence of tectonization, which suggests they are in place.
2. The central Pierre Sublobe is characterized by two dominant types of surficial features. The first consists of broad, flat till plains with large hummocks as much as ~1.0 km in diameter, which are interpreted as ground moraine. The second type of feature consists of very broad, hummocky ridges as much as 40 km long, consisting of round, flat-topped mounds as much as ~1.0 km in diameter. One such feature underlies the Sutton Rodeo and Bieber sites (Fig. 3). Due to their orientation, hummocky surface, and lack of ridges or other clear structures, they are interpreted here as hummocky stagnation moraine (Martin et al., Reference Martin, Sawyer, Fahrenbach, Tomhave and Schulz2004), formed by the abandonment and subsequent melting of glacial ice following glacial retreat. Lateral stream channels, both active and abandoned, are present along several stagnation moraine features.
3. The eastern Pierre Sublobe is characterized by a large arcuate moraine complex with abundant ridge segments and large abandoned channel systems. This moraine complex abuts stagnation moraine features to the west. The Eagle Pass sites lie on two ridge segments along the southern edge of the moraine complex. Abandoned lateral channels lie adjacent to the moraine complex and, in many cases, hold kettle lakes ~1.0 km in diameter.
Overall, we found that determining ice-margin positions based solely on geomorphology is difficult in the Pierre Sublobe, because of the absence of continuous moraine ridges. Many of the moraines are hummocky and discontinuous and likely products of ice stagnation, rather than actively flowing ice.
COSMOGENIC SURFACE EXPOSURE AGE DATING
Site selection
10Be surface exposure age dating was chosen as a potentially useful geochronology tool for this region due to the presence of boulders on the surface drift. The working hypothesis was that glaciation of the Pierre Sublobe occurred in three phases as suggested by Flint (Reference Flint1955) and that surface exposure ages would produce different absolute ages for the three phases. Based on our mapping and the drift limits proposed by Flint (Reference Flint1955), we inferred that the “Tazewell” sites were West Sully and Black Dog, our “Cary” sites were Sutton Rodeo and Bieber, and our “Mankato” site were Eagle Pass South and Eagle Pass North. Seventeen samples came from “Tazewell” sites, 5 samples came from “Cary” sites, and 11 samples came from the “Mankato” sites. All sites were active grazing pastures but, as far as we know, have never been plowed (typically indicated by boulder piles).
Methods
Thirty-three samples were collected from the six sites (Figs. 3 and 4). We targeted relatively flat-topped boulders embedded in the ground surface. We sought coarse-grained granitic boulders for sampling. Each sample was collected following methods of Kelly (Reference Kelly2003), using a battery-powered hammer drill and explosive caps to remove the upper ~5 cm of the boulder surface. Samples were transported to the University of Cincinnati for initial processing, crushing, and sieving. The remainder of processing was completed at the University of Maine cosmogenic isotope laboratory. Quartz isolation and purification of the 250–500 micron grain-size fraction were completed using surfactants and weak hydrofluoric acid (Kohl and Nishiizumi, Reference Kohl and Nishiizumi1992). Beryllium was isolated using ion-exchange chemistry protocols after Ditchburn and Whitehead (Reference Ditchburn, Whitehead, Hancock and Wallbrink1994). The samples were precipitated as beryllium hydroxide, combusted, mixed with niobium, and packed into cathodes. Cathodes were analyzed by Lawrence Livermore National Laboratory and are normalized to the 07KNSTD standard (Nishiizumi et al., Reference Nishiizumi, Imamura, Caffee, Southon, Finkel and McAninch2007).
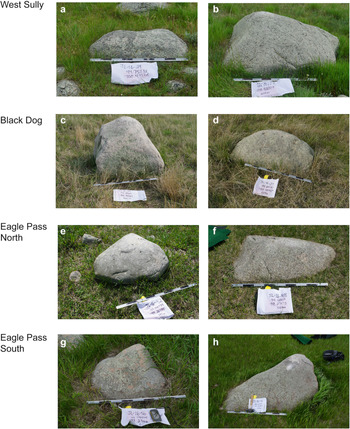
(color online) Photographs of boulders sampled from West Sully (a, b), Black Dog (c, d), Eagle Pass North (e, f), and Eagle Pass South (g, h). The scale bar in each photo is divided into alternating black and gray 10-cm bars.

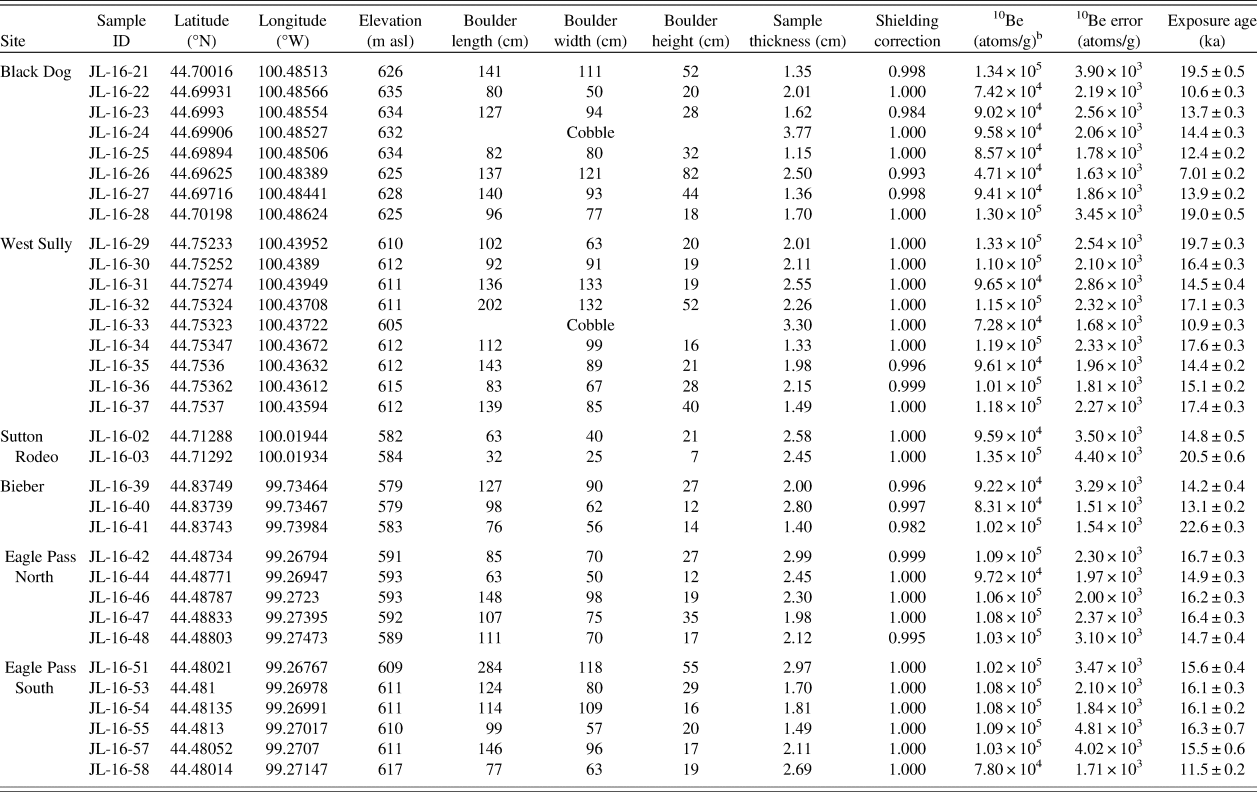
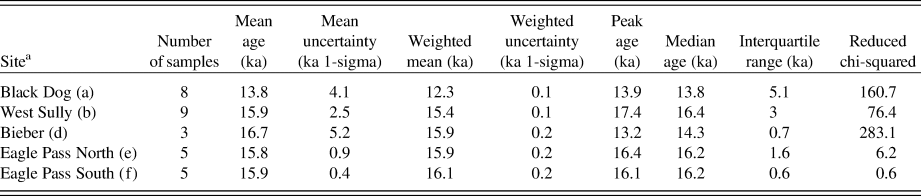
10Be ages were calculated using the online exposure age calculator of Balco et al. (Reference Balco, Stone, Lifton and Dunai2008, v. 3.0), using the northeastern North American production rate developed by Balco et al. (Reference Balco, Briner, Finkel, Rayburn, Ridge and Schaefer2009) and the scaling scheme described by Stone (Reference Stone2000) following Lal (Reference Lal1991). Blank-corrected 10Be concentrations and all other sample parameters used to calculate ages are presented in Table 1, including both internal and external errors. Peak ages, mean ages, and reduced chi-squared values, which are presented in Table 2, were calculated using the open-source Camelplot software developed by Greg Balco (https://cosmognosis.wordpress.com/2009/07/13/matlab-code-for-camel-diagrams/).
Sample details and 10Be surface exposure ages from six sites within the Pierre Sublobe.a

a All samples were calculated using the value of 2.7 g/cm3 for sample density, and zero for erosion.
b Blank-corrected values. Seven blanks associated with these samples yielded ratios ranging from 8 × 10⁻¹⁶ to 2 × 10⁻¹⁵, corresponding to ~10,000 to 31,000 atoms of 10Be.
Statistics for surface exposure ages from each site as calculated by the Camelplot software by Greg Balco (https://cosmognosis.wordpress.com/2009/07/13/matlab-code-for-camel-diagrams/). Outliers were removed to calculate statistics for West Sully (JL-16-29, JL-16-33) and Eagle Pass South (JL-16-58).

a The Sutton Rodeo site was omitted because it only had two ages. The letters next to each site name refer to the summed probability plot for each site in Fig. 5.
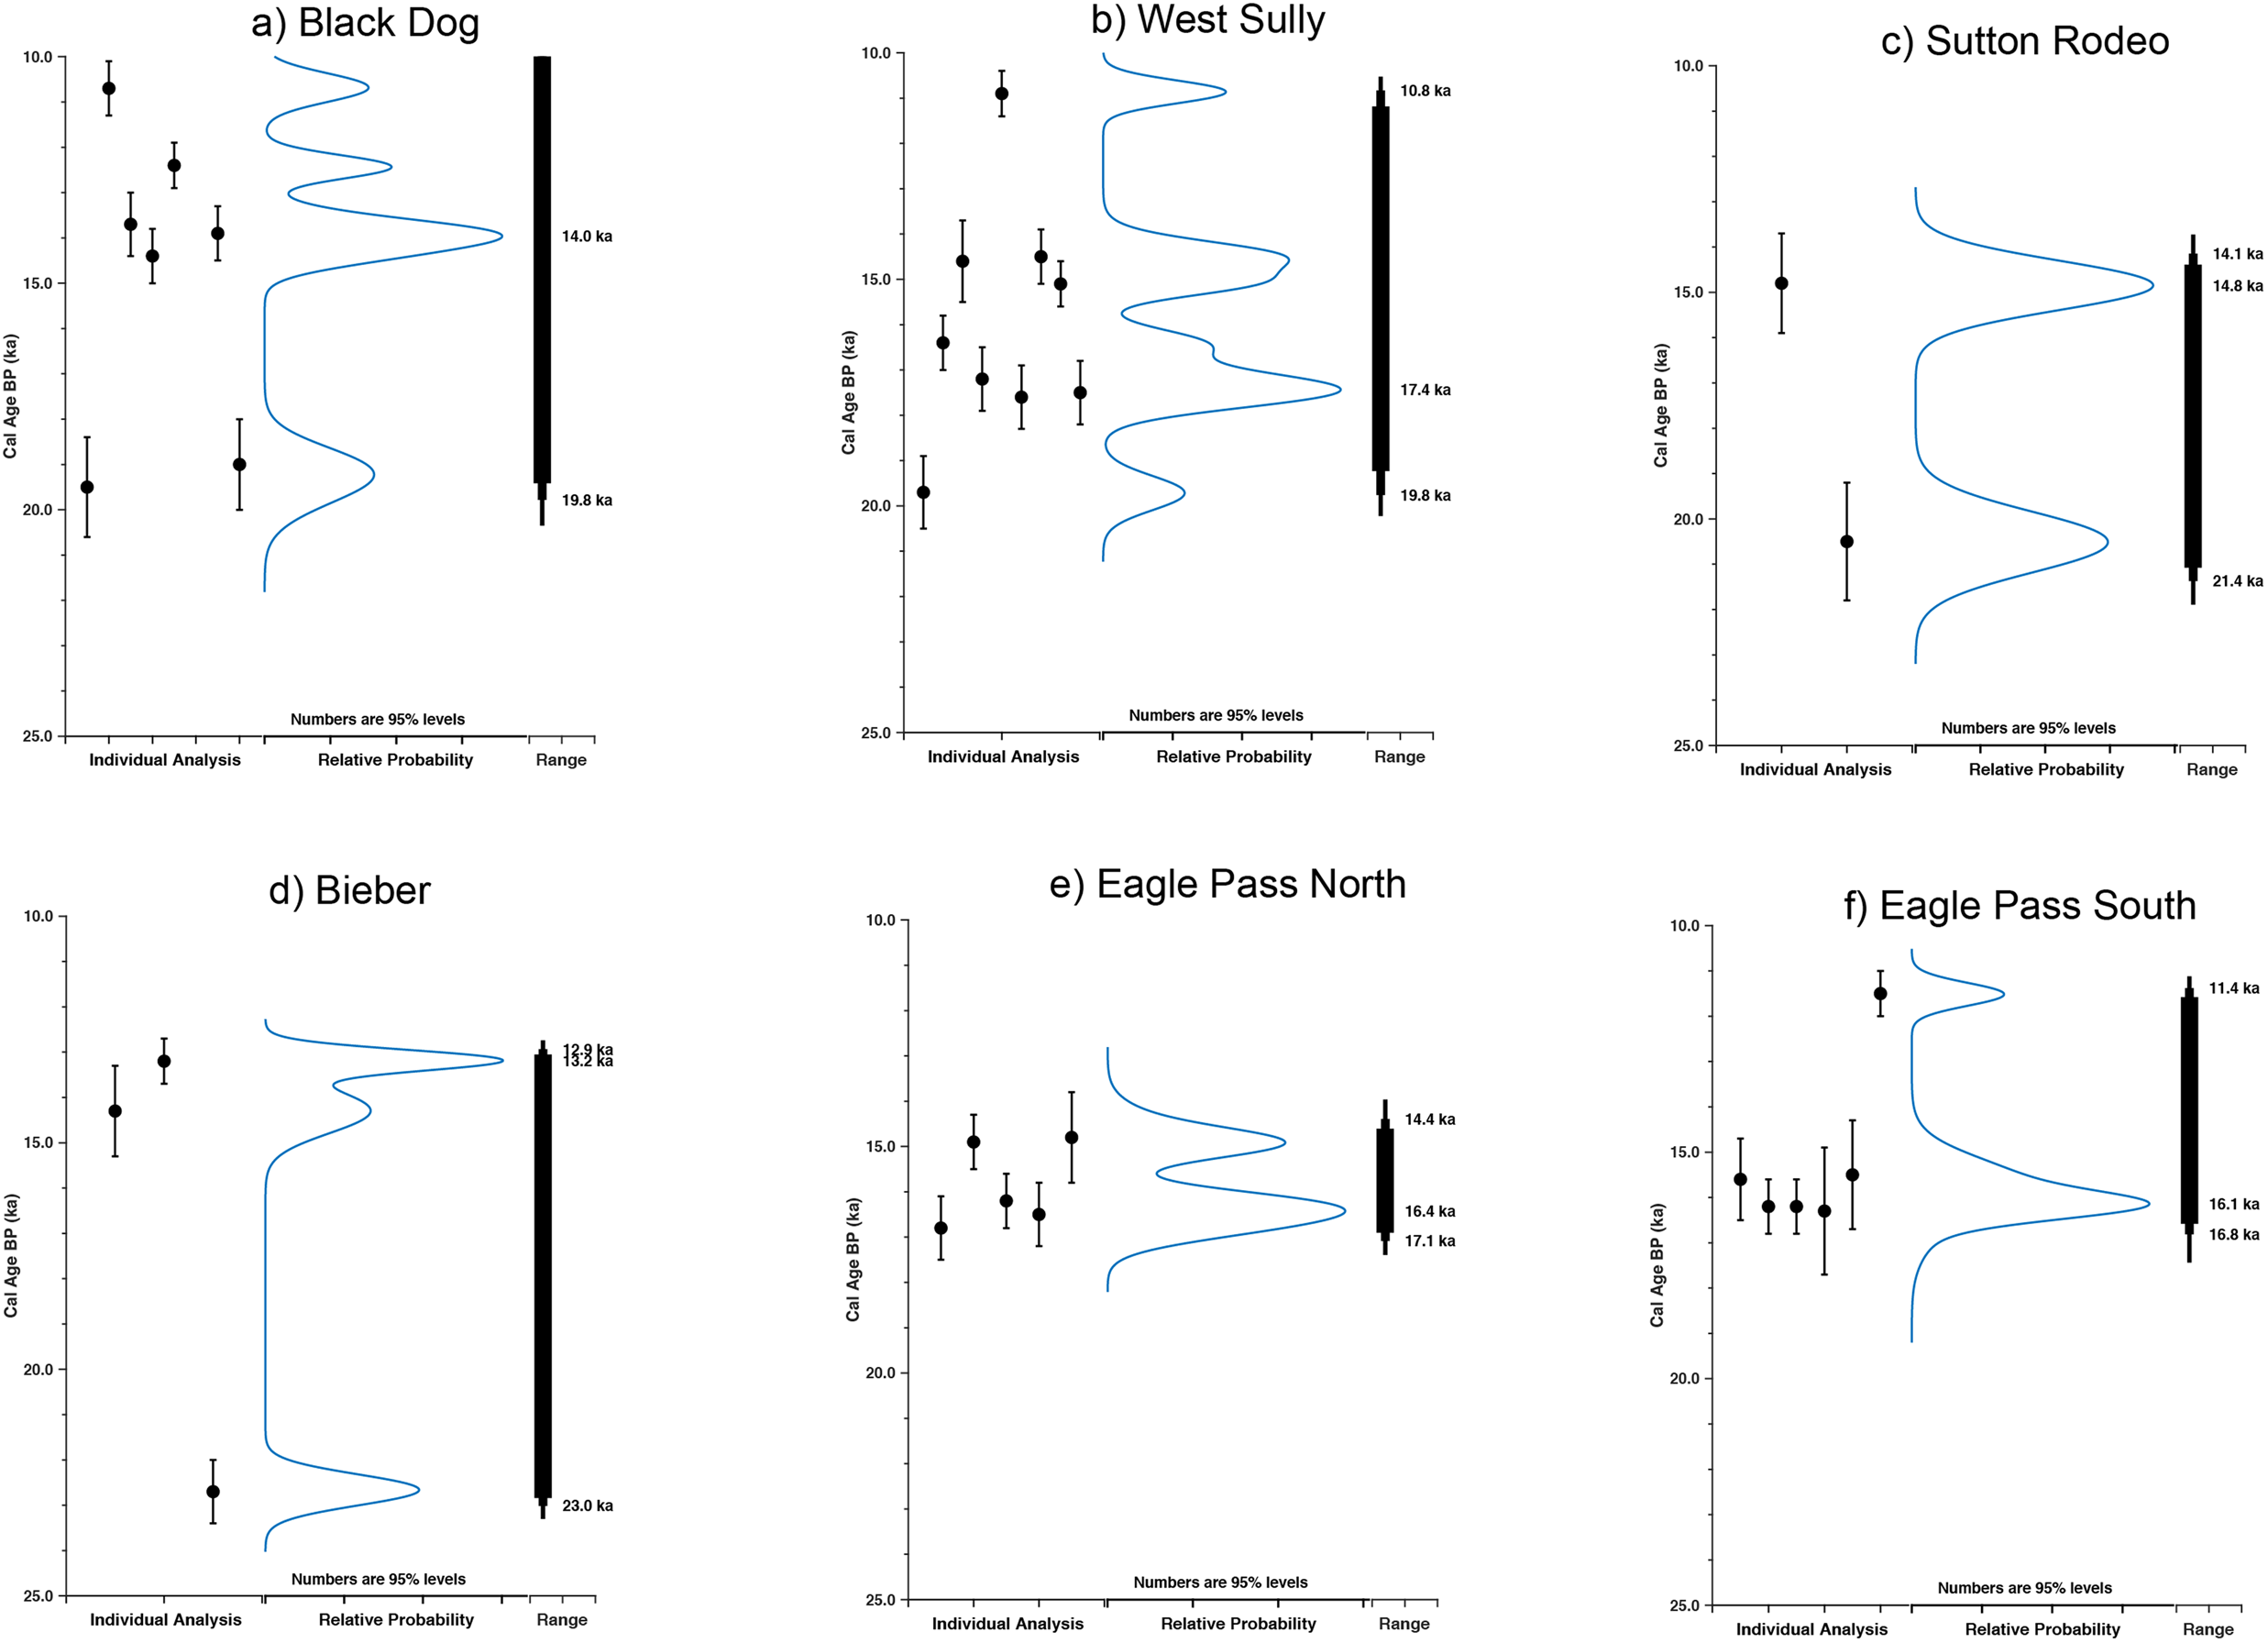
Relative probability distributions for (a) Black Dog, (b) West Sully, (c) Sutton Rodeo, (d) Bieber, (e) Eagle Pass North, and (f) Eagle Pass South. Each individual surface exposure age is plotted as a black dot, with the black bar representing internal error. The y-axis is time, in thousands of years before present (ka). The blue line represents the summed probability of all of the samples. The highest probability age is generally taken as the most likely indication of the age of the landform, assuming there are no other geologic processes at work. The black bars represent the total range of the summed probability at 90%, 95%, and 99% confidence intervals. The numbers to the left of the bar are the 95% probability. The formal metrics for these curves are in Table 2. Note the trimodal distribution at Black Dog and West Sully sites where a single age cannot be extracted. (For interpretation of the references to color in this figure legend, the reader is referred to the web version of this article.)

In the following section, we present geomorphology and 10Be surface exposure dating results for each site. We report internal error for all 10Be surface exposure ages presented in the text and in figures. 10Be surface exposure ages are plotted on site-specific DEMs, which are provided as Supplementary Material. Summed probability distributions were generated for each site to identify peak ages (Fig. 5). In the following sections, we report mean age and error for sites with ages that exhibit a normal distribution. Surface exposure ages that were greater than 1-sigma from the mean were determined to be outliers.
“Tazewell” sites
Black Dog
The Black Dog site lies on a large bedrock-cored feature known as the Sully Buttes (Bolin and Wilson, Reference Bolin and Wilson1950) that wraps around Bakers Gulch, a large gully system that drains to the west into the Missouri River (Fig. 3). The Virgin Creek Member of the Pierre Shale forms the core of Sully Buttes (Bolin and Wilson, 1950). The roughly north–south-trending, 200-m-long sinuous ridge rises up to 45 m above the gently rolling till plains to the east. Outboard of the Black Dog Ridge lies a 0.8 km swath of hummocky ground moraine that extends westward to the Missouri River trench. The Black Dog ridge appears to be affected by gullying largely to the west, although the 50-m-wide ridge crest from which boulders were collected appears stable. Eight 10Be surface-exposure ages from the Black Dog Site range from 19.5 ± 0.5 ka to 7.0 ± 0.2 ka (Fig. 3a, Table 1).
West Sully
The West Sully site lies on a northeast–southwest-trending bedrock-cored ridge in western Sully County, north of Pierre, SD (44.75233°N, 100.43952°W; 612 m above sea level). The ridge has ~23 m relief with a broad, flat crest. This crest is ~500 m wide at its southwestern point and gradually narrows to ~100 m wide at its northeastern end. Its northwestern slope is affected by active gullying that extends down the Missouri River trench, and its southern slope gradually gives way to extensive low-relief topography. Thin and discontinuous outwash deposits that directly overlie the Pierre Formation shale (Stevens et al., Reference Stevens, Bogan, Burge and Fenske1949) lie outboard of the ridge. The plain to the south of the ridge is composed of as much as 40 m of interbedded till and alluvium and is interpreted as ground moraine (Stevens et al., Reference Stevens, Bogan, Burge and Fenske1949). Similar to the Black Dog site, this ridge is a bedrock-cored butte covered with a relatively thin layer of till. Nine boulder samples from West Sully were analyzed, and the ages range from 19.7 ± 0.3 ka to 10.9 ± 0.2 ka (Fig. 5). The youngest age of 10.9 ± 0.2 ka (JL-16-33) was excluded as an outlier. The oldest age of 19.7 ± 0.3 ka (JL-16-29) is also excluded statistically, though it is still a minimum age for glacier cover. The remaining data are similar to those from Black Dog (Figs. 3a and 5), in that both sites exhibit age distributions with peaks at ~19.0 and ~14.0 ka. The West Sully site exhibits an additional peak at ~17.0 ka.
“Cary” sites
Sutton Rodeo
The Sutton Rodeo site lies on a broad, hummocky ridge in central Sully County. This site lies roughly in the center of the Pierre Sublobe footprint. This northeast–southwest-trending ridge is ~40 km long, as much as 15 km wide, and has ~50 m of relief. The ridge is bounded to the northwest and southeast by abandoned channels with abundant kettles (1.0–1.5 km diameter) and ground moraine deposits. Its surface is characterized by abundant raised, ~0.5-km-diameter circular terraces with ~5.0 m relief. The Sutton Rodeo site is atop one such flat-topped raised surface that measures ~0.6 km in diameter with ~2.0 km relief. Flint (Reference Flint1955) interpreted this feature as an end moraine. Two boulder samples from Sutton Rodeo yield surface exposure ages of 20.5 ± 0.6 (JL-16-03) and 14.8 ± 0.5 ka (JL-16-02). Sample JL-16-01 was not processed due to low quartz content. These samples were all collected from near the edge of the same large hummock.
Bieber
The Bieber site lies along the same northeast–southwest-trending hummocky ridge as Sutton Rodeo. The site encompasses two ~100-meter-diameter hummocks and lies adjacent to a roughly north–south-trending sinuous, abandoned stream channel that dissects the moraine feature (Fig. 3). Three samples from the Bieber site yield surface exposure ages of 22.6 ± 0.3 (JL-16-41), 14.2 ± 0.4 (JL-16-39), and 13.1 ± 0.2 ka (JL-16-40). These were collected from two different hummocks along the same stagnation moraine.
“Mankato” sites
Eagle Pass North
The Eagle Pass North site lies on an east–west-trending ridge segment that is part of the large continuous arcuate moraine mapped by Flint (Reference Flint1955) as the extent of the “Mankato,” or the latest phase of glacial advance. The ridge lies parallel to and north of the Eagle Pass South ridge. North of the site is the gradual slope down into the broader Pierre Sublobe footprint (Fig. 3). Five samples from Eagle Pass North yield 10Be exposure ages that range from 16.7 ± 0.3 ka to 14.7 ± 0.4 ka (Figs. 3a and 5e). These ages produce a mean age of 15.8 ± 0.9 ka.
Eagle Pass South
Eagle Pass South is located on an east–west-trending hummocky ridge perched on the Missouri Coteau. This ridge is mapped within Flint's (Reference Flint1955) “Mankato” limit. The site is on a ~4.0-km-long ridge segment near the junction of two moraines. To the south of the EPS site lies the eastern limit of a large stagnation moraine, traceable for ~62 km to the west. The stagnation moraine is characterized by these small ridge segments, as well as large raised hummocks up to 1.0 km in diameter. To the north of EPS is the southernmost extent of a large arcuate moraine on which Eagle Pass North lies. Six samples from Eagle Pass South yield ages that range from 16.3 ± 0.7 ka to 11.5 ± 0.2 ka (Table 1). The youngest age of 11.5 ± 0.2 ka (JL-16-58) is excluded as an outlier. The remaining ages exhibit a normal distribution and produce a mean age of 15.9 ± 0.4 ka (Figs. 3d and 5f).
Summary of 10Be surface exposure age dating results
The two sites that represent “Tazewell” drift, Black Dog and West Sully were from drift-covered bedrock ridges and produce 10Be surface exposure age data sets that show a wide range of ages with a non-simple distribution (Fig. 5).
The two sites that represent the “Cary” drift, Bieber and Sutton Rodeo are characterized by hummocky terrain with few in-place boulders and provide minimum ages of 22.6 ± 0.3 and 20.5 ± 0.6 ka, respectively.
The two sites that represent “Mankato” drift, Eagle Pass North and Eagle Pass South lie on parallel moraine ridge crests and produce ages that exhibit a tight distribution. The two sites produce mean ages of 15.8 ± 0.9 and 15.9 ± 0.4 ka, respectively.
DISCUSSION
In the following discussion, we first evaluate and interpret the 10Be exposure age data set from the Pierre Sublobe and then extract preliminary information on the glacial chronology of the Pierre Sublobe.
Preliminary glacial chronology of the Pierre Sublobe
Despite the non-simple distribution of surface exposure ages from the Black Dog and West Sully sites, the cluster of ages ~20–19 ka suggests retreat of the Pierre Sublobe from the Missouri River at that time. As a working hypothesis, the ages of ~22 ka at Bieber and ~20 ka from Sutton Rodeo are taken to represent minimum ages for ice incursion in the western Pierre Sublobe. The absence of older ages from any of the six sites suggests that inheritance may not be a factor. Further, we compared the age distributions from Black Dog and West Sully with hypothetical data sets produced by the inheritance model of Applegate et al. (Reference Applegate, Urban, Keller, Lowell, Laabs, Kelly and Alley2012) to determine whether inheritance could be a factor. We used parameter input values that reflected actual site conditions (i.e. slope, ridge height, boulder size) and found that if inheritance was a factor, then the maximum ages would be closer to ~50 ka, rather than clustering around ~19 ka (Supplementary Figure 7). The age cluster ~19.0 ka at the Black Dog and West Sully sites may provide an upper age bracket for the start of some post-deglaciation processes, such as episodic boulder exhumation. The trimodal distribution at both the Black Dog and West Sully sites lends support to this concept—the probability peaks at ~17 and ~14 ka may represent specific episodes of erosion and subsequent boulder exhumation and exposure.
The Eagle Pass sites provide normal distributions of tightly clustered, overlapping 10Be surface exposure ages and indicate ice recession from these sites at ~16 ka (Fig. 5). Geomorphic mapping shows that the sites lie on separate ridge segments but are part of the same massive arcuate moraine complex interpreted by Flint (Reference Flint1955) as the “Mankato” advance. We interpreted these small ridge segments as minor moraines, the result of ice-margin stabilization. Based on the minor moraines’ proximity and geomorphic context, the surface exposure ages from both sites provide acceptable age distributions that provide chronological control on the position of the Pierre Sublobe at ~16 ka.
Implications for southern Laurentide Ice Sheet dynamics
Surface exposure ages of ~22–20 ka from the West Sully, Black Dog, Sutton Rodeo, and Bieber sites within the Pierre Sublobe suggest possible expansion of the James Lobe during the last glacial maximum. However, the possibility exists that these ages may be the product of exhumation and that the age of the drift is much older. Collectively, these indicate that the till units of the “Tazewell” drift and the hummocky topography were deposited at least 22–20 ka.
Our new surface exposure age chronology from the Pierre Sublobe suggests that the James Lobe achieved a stable position as late as ~15.8 ± 0.9 ka. If this is correct, the Pierre Sublobe's behavior may be similar to that of the nearby Des Moines Lobe in Iowa, which underwent an advance that culminated at ~16.1 ka, based on radiocarbon ages from alluvium below till (Lowell et al., Reference Lowell, Hayward and Denton1999; Heath et al., Reference Heath, Loope, Curry and Lowell2018). These 16 ka ages from both lobes indicate a relatively late episode of stabilization or advance in the western sector of the southern Laurentide margin. During this time, lobes farther east in Wisconsin and Illinois were retreating. This could be taken to show an apparent difference between the two sectors, as suggested by Heath et al. (Reference Heath, Loope, Curry and Lowell2018).
Several internal and external mechanisms may explain the difference in southern Laurentide behavior at this time. One hypothesis is that the development of multiple Laurentide domes during late-glacial time affected the dynamics of the southern Laurentide margin. In this model, the James and Des Moines Lobes flowed from the Keewatin Dome over northwestern Canada, and the eastern sector lobes flowed from the Hudson Dome near Hudson Bay (Denton and Hughes, Reference Denton and Hughes1981; Dyke and Prest, Reference Dyke and Prest1987; Patterson, Reference Patterson1997; Lusardi et al., Reference Lusardi, Jennings and Harris2011; Margold et al., Reference Margold, Stokes and Clark2015). Further, for a brief time after ~20.5 ka, the source area for the James and Des Moines Lobes may have shifted farther west to the Laurentide–Cordilleran Saddle (Ross et al., Reference Ross, Lajeuness and Kosar2011 Margold et al., Reference Margold, Stokes and Clark2018). Fullerton et al. (Reference Fullerton, Colton, Bush and Straub2004) suggest that the relatively late readvance of the southwestern Laurentide margin at ~16.3 ka was sourced from the Keewatin Dome following collapse of the Hudson Dome. If the eastern and western sectors of the southern Laurentide Ice Sheet were controlled by two different domes during late-glacial time and deglaciation, the two domes may have been affected by differences in accumulation or subglacial geomorphology or hydrology. This hypothesis is supported by our new surface exposure chronology from the James Lobe.
CONCLUSIONS
Surface exposure ages from the Black Dog and West Sully (“Tazewell”) sites along the Missouri River allow possible retreat of the Pierre Sublobe from its westernmost maximum extent at ~20.0 ka, followed by episodic erosion and boulder exhumation in areas adjacent to the Missouri River. The outermost “Tazewell” drift, from which several surface exposure ages of ~20 ka were obtained, requires further investigation.
At ~16.0 ka, the Pierre Sublobe stabilized and deposited the arcuate moraine complex in the eastern Pierre Sublobe. This allows the hypothesis that the dynamics of the James Lobe and Des Moines Lobe are linked, at least at ~16 ka. Further, this suggests that both western sector lobes remained at an extended position at a time when the eastern sector lobes were undergoing retreat.
ACKNOWLEDGMENTS
The Gary C. Comer Science and Education Foundation provided financial support for this research. We thank the various landowners in central South Dakota for allowing access to their land for mapping and sample collection. We are grateful to Jill Pelto, Peter Strand, Elizabeth Orr, and Sarah Hammer for lab assistance.
SUPPLEMENTARY MATERIAL
The supplementary material for this article can be found at https://doi.org/10.1017/qua.2020.16.