


Many questionnaires have been developed to measure psychological constructs or to assess patients’ condition and its impact with items that include ordered response categories from disagreement to agreement, from low to high frequency of occurrence of a symptom, or from negligible to severe implications on normal functioning. Analogous instruments are used in educational settings to assess students’ knowledge with open-ended items scored under a graded system that captures levels of mastery expressed in the response. The psychometric properties of these instruments are often assessed using item response theory (IRT) models for polytomous responses, an approach that helps to investigate item functioning and to suggest action that could improve the instrument.
Polytomous IRT models for items with K response (or score) categories comprise K option response functions (ORFs) expressing probability of response in each category as a function of trait level θ and item parameters. Thissen and Steinberg (Reference Thissen and Steinberg1986) described two types of models that differ as to how ORFs are derived: difference models and divide-by-total models. The building blocks of difference models are monotone functions describing how probability of responding beyond each category increases with θ and, then, the ORF for each category is obtained by subtraction. Samejima’s (Reference Samejima1969; Reference Samejima, van der Linden and Hambleton1997) graded response model (GRM) and Muraki’s (Reference Muraki1990) rating scale model (RSM) belong in this class. Divide-by-total models are constrained versions of Bock’s (Reference Bock1972; Reference Bock, van der Linden and Hambleton1997) nominal response model (NRM) in which the ORF is directly modeled as the ratio of a category-specific function of θ to the sum of those functions across categories. The NRM accommodates items with ordered categories but its derivation does not impose such restriction and, thus, the NRM is the most general model of its kind. In variants that assume ordered categories, the building blocks are again monotone functions but now describing the conditional probability of responding in a category given that the response is either in that category or in the previous one. In such variants, the ORF is again the ratio of a category-specific function of θ to the sum of those functions across categories. Variants include the polytomous Rasch model (PRM)—also known as the Rasch rating model (RRM; Andersen, Reference Andersen, van der Linden and Hambleton1997; Andrich, Reference Andrich1978a; Reference Andrichb) or the partial credit model (PCM; Masters, Reference Masters1982; Masters & Wright, Reference Masters, Wright, van der Linden and Hambleton1997) under alternative parameterizations—and the generalized partial credit model (GPCM; Muraki, Reference Muraki1992; Reference Muraki, van der Linden and Hambleton1997).
All models can be classified according to whether scaling properties are common to all items (equispaced models) or differ across items (non-equispaced models). In equispaced models (e.g., the RSM among difference models and the RRM among divide-by-total models), the ensemble of ORFs has a common shape and only differs across items by rigid translation along the θ continuum. Then, each item has its own global location parameter but the relative locations of category parameters are the same for all items. In non-equispaced models (e.g., the GRM among difference models and the PCM among divide-by-total models), ORFs differ across items in shape and by translation. Then, there is no global location parameter for each item and the relative locations of category parameters vary across items.
In addition, unidimensional and multidimensional variants exist for either type of model (see Reckase, Reference Reckase2009, Ch. 4). Yet, our analyses will be limited to unidimensional cases, which is indeed the context in which the issues addressed in this paper arose. Thus, all items measure one and the same dimension and responses are determined only by item parameters and the respondent’s location along that dimension. Unidimensionality holds in all the cases discussed throughout the paper, and also for simulation results presented later. Repetitive references to unidimensionality will be avoided in the sequel.
Practical application of either type of model rests on the assumption that the actual order of categories matches the pre-assumed order. In principle, disordered categories are unlikely with Likert-type items where the response scale ranges from strong disagreement to strong agreement through several intermediate levels: It does not seem logical that, e.g., mild agreement represents a more extreme position on some issue than strong agreement. The same holds when categories reflect increasingly higher levels of dysfunction. Yet, situations are conceivable in which categories are not ordered as initially assumed. An example is the graded scoring of open-ended ability items, which may not capture adequately the increasing levels of mastery portrayed by more elaborate or complete answers. Establishing the proper order of categories is a pre-condition for adequate use of IRT models for ordered responses. However, there is no general agreement as to how such empirical order can be established.
In principle, it stands to reason that a model incorporating the assumption that response categories are ordered in the stated way cannot fit data from items whose categories happen to be empirically ordered differently. The built-in assumption about the order of categories turns into a straitjacket that the data can only refuse to fit into. Then, misfit could indicate that the assumed order of categories is inadequate, but misfit can also occur for other reasons (content irrelevance, multidimensionality, etc.) even when the assumed order of categories is adequate.
Alternatively, the estimated values of category parameters could be used as a proxy to category order, on the assumption that the order of parameters reflects the order of categories. Yet, by construction, estimated category parameters in difference models must necessarily be ordered as categories were assumed to be: Disordered category parameters in difference models produce negative-valued ORFs for one or more categories, an impossible feature. In contrast, category parameters in divide-by-total models can be ordered or disordered relative to the pre-assumed order of categories without such implications. Then, the order of estimated category parameters in divide-by-total models for ordered responses could be taken to indicate the order of categories, a position strongly supported by some (e.g., Andrich, Reference Andrich, Smith and Smith2004; Reference Andrich2013a; Reference Andrichb; Andrich, de Jong, & Sheridan, Reference Andrich, de Jong, Sheridan, Rost and Langeheine1997) but contended by others (e.g., Adams, Wu, & Wilson, Reference Adams, Wu and Wilson2012). Almost invariably, empirical studies developing tests or assessing their psychometric properties under divide-by-total models use this approach and take corrective action at the encounter of disordered category parameters.
There is at least one reason to doubt that category parameters in divide-by-total models for ordered responses indicate the order of categories. A number of studies have shown that difference and divide-by-total models fit data equally well, rendering almost identically shaped ORFs across models (e.g., Baker, Rounds, & Zevon, Reference Baker, Rounds and Zevon2000; De Ayala, Dodd, & Koch, Reference De Ayala, Dodd and Koch1992; Gordon, Fujimoto, Kaestner, Korenman, & Abner, Reference Gordon, Fujimoto, Kaestner, Korenman and Abner2013; Maydeu-Olivares, Drasgow, & Mead, Reference Maydeu-Olivares, Drasgow and Mead1994; see also extensive results reported below). Despite the good fit and the similar ORFs, estimated category parameters are always ordered in difference-model fits but they are often disordered in divide-by-total-model fits. This raises the question of whether categories are ordered (as per the fit of the difference model) or disordered (as the fit of the divide-by-total model might be taken to indicate). The question is relevant because use of (fitting) difference models would not question the order of categories, whereas use of (fitting) divide-by-total models would, usually followed by the adoption of measures to instate order.
There is a need to reconcile category parameter order in difference models and category parameter disorder in divide-by-total models with nearly identical ORFs under both models. One reason for the difficulty to reconcile these seemingly contradictory outcomes is that category parameters are referred to as “thresholds” in both types of models, despite the fact that they represent distinctly different aspects in each model. In difference models, thresholds relate to the global response process across the set of categories; in divide-by-total models, they instead describe local aspects pertaining to two consecutive categories, with no link to other categories. Thresholds in difference models are always ordered but the ORFs for consecutive categories cross at points that may be ordered or disordered; in contrast, thresholds in divide-by-total models for ordered responses represent the crossing points of the ORFs for consecutive categories (in the pre-assumed order) and they may be ordered or disordered. As will be shown here, thresholds (in the difference-model sense) are always ordered as categories are assumed to be in all models; on the other hand, thresholds (in the divide-by-total-model sense) can be ordered or disordered in either type of model.
This paper has three main goals. The first goal is to analyze if and how the native category parameters in either type of model inform of the empirical order of categories. This requires dealing with four issues each of which is addressed in one of the next four sections: Defining common referents (thresholds and crossings) for parameters across types of models, defining the empirical order of categories, discussing how the response process assumed under each type of model relates to the order of thresholds, crossings, and categories, and providing an empirical illustration by fitting models of both types to responses to Likert-type items. The second goal is to investigate, across simulation studies with item parameters that reflect a known reality, how parameter estimates from difference and divide-by-total models capture or distort such reality, including the estimated order of categories. The third goal is to analyze also via simulation the practical consequences of the most common empirical action taken when estimated parameters of divide-by-total models presumably inform of disordered categories, namely, modifying the response scale by collapsing categories to instate order.
In a nutshell, results show that only the NRM can assess the empirical order of categories, although estimated NRM parameters generally portray ordered categories as if they were disordered. Also, models that assume ordered categories always return parameter estimates reflecting the stated order of categories, with no indication of a potential mismatch with their empirical order. Finally, collapsing categories in reaction to presumed indicators of disordered categories only deteriorates the psychometric properties of the instrument. Practical implications are discussed in the final section.
Thresholds and crossings in difference and divide-by-total models
Category parameters are referred to as thresholds in both types of models, but with different meanings. To avoid the confusion that this creates, henceforth the term “category parameter” will be used to refer to the item parameters in either type of model and this section defines common referents for both types of models. Specifically, thresholds are defined as the points along θ at which the probability of a response beyond category k equals the probability of a response at or below category k and crossings are defined as the points at which the probability of a response in category k equals the probability of a response in category k + 1. This presentation uses the GRM as the sample difference model and the NRM as the sample divide-by-total model but thresholds and crossings exist for all other variants.
The GRM for items with K ordered categories posits that the probability
 $p_k^*$
of a response beyond category k (with 1 ≤ k ≤ K − 1) increases with θ according to the logistic function
 $$p_k^*({\rm{\theta }}) = {1 \over {1 + {\rm{exp[}} - a({\rm{\theta }} - {b_k}){\rm{]}}}}$$
,
Where a is the discrimination parameter and the various b
k
are the category parameters. (A subscript for the item is omitted on the understanding that parameters vary across items.) The functions
 $p_k^*$
relate to dichotomies between disjoint and exhaustive subsets of contiguous categories and b
k
is the point at which the probability of response beyond category k equals the probability of response at or below category k. Hence, these category parameters are thresholds under our definition. By construction, the order relation b
k
≤ b
k+1 (for 1 ≤ k ≤ K – 2) holds because the probability of responding beyond category k cannot be lower than the probability of responding beyond category k + 1. This order relation represents the definition of ordered thresholds and it is important to stress that thresholds are defined relative to the cumulative functions
 $p_k^*$
. The ORF describing the probability p
k
of a response in category k is obtained by subtraction (see the bottom panel of Fig. 1a), namely,
 $${p_k}({\rm{\theta }}) = p_{k - 1}^*({\rm{\theta }}) - p_k^*({\rm{\theta }})$$
,
Thresholds and crossings in two equivalent items parameterized under the graded response model (a) and the nominal response model (b). The top panels show the cumulative probability functions
 $p_k^*$
; the bottom panels show the probability p
k
of each response.

with
 $p_0^*({\rm{\theta }}) = 1$
and
 $p_K^*({\rm{\theta }}) = 0$
so that
 ${p_1}({\rm{\theta }}) = 1 - p_1^*({\rm{\theta }})$
and
 ${p_K}({\rm{\theta }}) = p_{K - 1}^*({\rm{\theta }})$
. Clearly,
 $$p_k^*({\rm{\theta }}) = \sum\nolimits_{m = k + 1}^K {{p_m}({\rm{\theta }})}$$
.
The ORFs for categories k and k + 1 cross at the point τ
k
satisfying p
k
(τ
k
) = p
k+1 (τ
k
). Closed-form expressions for τ
k
do not exist but the location of these crossing points (see the bottom panel of Fig. 1a) can easily be obtained numerically. As seen in Fig. 1a, thresholds b
k
and crossings τ
k
do not coincide. Although thresholds defined with respect to
 $p_k^*$
are ordered by construction, crossings defined with respect to p
k
do not always satisfy τ
k
≤ τ
k+1. If they do, as in Fig. 1a, we will refer to ordered crossings.
In divide-by-total models, the ORFs p
k
are defined without recourse to functions
 $p_k^*$
. In the NRM, the ORF for category k is directly given by
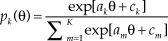 $${p_k}(\theta ) = {{\exp [{a_k}{\rm{\theta }} + {c_k}]} \over {\sum\nolimits_{m = 1}^K {\exp [{a_m}{\rm{\theta }} + {c_m}]} }}$$
subject to the constraint
 $\sum\nolimits_{k = 1}^K {{a_k}} = \sum\nolimits_{k = 1}^K {{c_k}} = 0$
. The bottom panel of Fig. 1b shows a sample case with parameters that produce ORFs virtually identical to those for the GRM in Fig. 1a. When the NRM characterizes items with ordered categories, the crossings τ
k
of consecutive ORFs can be easily determined and, for 1 ≤ k ≤ K – 1, they are given by
 $${\tau _k} = {{{c_{k + 1}} - {c_k}} \over {{a_k} - {a_{k + 1}}}}$$
.
In the sample case of Fig. 1b these crossings are also ordered, a consequence of the manner in which NRM parameters were selected for this example.
To determine NRM thresholds that conform to our definition (provided that the NRM is used with items that have ordered categories), functions
 $p_k^*$
need to be constructed that relate to dichotomies between disjoint and exhaustive subsets of contiguous categories. By analogy with Eq. 3, this is achieved by making
 $$p_k^*({\rm{\theta }}) = \sum\nolimits_{m = k + 1}^K {{p_m}({\rm{\theta }})} = {{\sum\nolimits_{m = k + 1}^K {\exp [{a_m}{\rm{\theta }} + {c_m}]} } \over {\sum\nolimits_{m = 1}^K {\exp [{a_m}{\rm{\theta }} + {c_m}]} }}$$
.
The resultant functions are shown in the top panel of Fig. 1b. The 50% points on them cannot be determined analytically but they can be obtained numerically, yielding the thresholds t k indicated at the top of the panel. Thresholds thus defined also do not coincide with crossings under the NRM, as seen in Fig. 1b.
Ordered thresholds that render disordered crossings may occur in both models (see Fig. 2). The GRM category parameters b 2 and b 3 are closer to each other than they were in Fig. 1a and, hence, the ORF for intermediate category 3 (green curve in the bottom panel of Fig. 2a) is dwarfed by the others. This yields disordered crossings (i.e., τ2 = 0.73 > τ3 = −0.77) despite the ordered thresholds. An NRM item with parameters listed on the right of the bottom panel of Fig. 2b has nearly identical ORFs also with disordered crossings (i.e., τ2 = 1.14 > τ3 = −1.20) despite the ordered thresholds (top panel of Fig. 2b).
Thresholds and crossings in two equivalent items parameterized under the graded response model (a) and the nominal response model (b). The top panels show the cumulative probability functions
 $p_k^*$
; the bottom panels show the probability p
k
of each response.

Defining thresholds relative to the functions
 $p_k^*$
is natural under difference models because those functions are the building blocks of such models. In contrast, those functions do not participate in the derivation of divide-by-total models, although post-hoc definition of
 $p_k^*$
does not alter the principles under which divide-by-total models were developed. Thresholds and crossings reflect distinct aspects of the response process and the ORFs. In difference models, thresholds are category parameters whereas crossings are by products. In the NRM (for items with ordered categories), category parameters are neither thresholds nor crossings, both of which are byproducts. In variants of the NRM such as the PRM or the GPCM, category parameters (referred to as thresholds) are crossings (as defined here) whereas thresholds (as defined here) are a byproduct. The illustrations in Figs. 1b and 2b used the NRM but analogous GRM-like ORFs exist under the PRM or the GPCM that also result in ordered or disordered crossings despite the ordered thresholds.
Order of categories in difference and divide-by-total models
The order of thresholds, as defined here, relates to the order of categories: The functions
 $p_k^*$
describe dichotomies between disjoint and exhaustive sets of contiguous categories and, hence, these functions are defined relative to the assumed order of categories. Establishing the empirical order of categories is thus crucial for determining thresholds and crossings and the Introduction discussed some difficulties associated with this task. This section defines a measure for this purpose that differs from those proposed by Adams et al. (Reference Adams, Wu and Wilson2012), and discusses whether category parameters may inform of category order.
If the item content is relevant to the trait, endorsing a given category will be more likely for respondents in a certain range of θ and, if categories are properly ordered, this range will progressively shift upward from the lowest to the highest category. It is important to realize that “the range of θ within which endorsing a certain category is more likely” is not defined in comparison to other categories in the same range of θ but in comparison to other ranges of θ for the same category, for two reasons. First, and most important, the relevant issue in this context is not which response is more likely given some θ but, rather, which range of θ is associated with a given response. In fact, categories are provided because the respondents’ choice of category is informative of their unknown θ. The bottom panel of Fig. 1a makes this clear. The ordinates of the ORFs for categories 2–4 (red, green, and blue curves) never exceed .5 and, hence, at all θ between −1.75 and 1.75 there is no category whose endorsement is more likely overall and, yet, each intermediate category has a specific range of prevalence over any other category considered individually. In other words, in ranges of θ where no individual ORF satisfies p k (θ) > .5, not endorsing the prevalent category is the most likely outcome. The second reason is practical: Defining the order of categories in terms of how category modality varies as θ increases is bound to leaving one or more categories out of any ordering. The bottom panel of Fig. 2a makes this clear. As θ increases, categories 1, 2, 4, and 5 are progressively modal whereas category 3, which is never modal, does not have any ordinal position by such criterion.
The order of categories must thus be defined according to the location of the ORFs along θ. The lowest category is that associated with the monotone decreasing ORF; the highest category is that associated with the monotone increasing ORF; for intermediate categories (whether modal, non-modal, or super-modal; Linacre, Reference Linacre, Smith and Smith2004), a suitable measure of location is
 ${{\rm{\bar \theta }}_k} = {{\int_{ - \infty }^\infty {{\rm{\theta }}{\kern 1pt} {p_k}({\rm{\theta }})} {\kern 1pt} {\rm{d\theta }}} \mathord{\left/ {\vphantom {{\int_{ - \infty }^\infty {{\rm{\theta }}{\kern 1pt} {p_k}({\rm{\theta }})} {\kern 1pt} {\rm{d\theta }}} {\int_{ - \infty }^\infty {{p_k}({\rm{\theta }})} {\kern 1pt} {\rm{d\theta }}}}} \right. \kern-\nulldelimiterspace} {\int_{ - \infty }^\infty {{p_k}({\rm{\theta }})} {\kern 1pt} {\rm{d\theta }}}}$
, which matches the empirical approach of assessing category location via the average estimated trait of respondents endorsing that category (e.g., Linacre, Reference Linacre1999; Wetzel & Carstensen, Reference Wetzel and Carstensen2014).
With the symmetric ORFs for intermediate categories under the GRM, the location of p
k
is
 ${{\rm{\bar \theta }}_k} = {{({b_{k - 1}} + {b_k})} \mathord{\left/ {\vphantom {{({b_{k - 1}} + {b_k})} 2}} \right. \kern-\nulldelimiterspace} 2}$
. These locations satisfy the order relation
 ${{\rm{\bar \theta }}_k} \le {{\rm{\bar \theta }}_{k + 1}}$
for 1 < k < K – 1 and, thus, categories and thresholds are identically ordered under the GRM, as they are under any other difference model. One might thus surmise that disordered estimates of category parameters inform of disordered categories. As discussed earlier, disordered category parameters are impossible under difference models. Yet, it has been reported that fitting the GRM with MPlus (www.statmodel.com), irtpro (www.ssicentral.com), parscale (du Toit, Reference du Toit2003), or multilog (du Toit, Reference du Toit2003) occasionally returns disordered b
k
(e.g., Baker, Reference Baker1997a; Reference Bakerb; Forrest et al., Reference Forrest, Bevans, Pratiwadi, Moon, Teneralli, Minton and Tucker2014; García-Pérez, Alcalá-Quintana, & García-Cueto, Reference García-Pérez, Alcalá-Quintana and García-Cueto2010; Hahn et al., Reference Hahn, DeVellis, Bode, Garcia, Castel and Eisen2010; Osborne, Batterham, Elsworth, Hawkins, & Buchbinder, Reference Osborne, Batterham, Elsworth, Hawkins and Buchbinder2013; Rubio, Aguado, Hontangas, & Hernández, Reference Rubio, Aguado, Hontangas and Hernández2015; Wang, Deutscher, Yen, Werneke, & Mioduski, Reference Wang, Deutscher, Yen, Werneke and Mioduski2014). The reason for this outcome, which cannot logically inform of disordered categories, will be documented later.
A closed-form expression for
 ${{\rm{\bar \theta }}_k}$
does not exist for the NRM. Yet,
 ${{\rm{\bar \theta }}_k}$
and α
k
are monotonically related and, thus, the order of categories is given by the order of parameters α
k
(Bock, Reference Bock1972; Reference Bock, van der Linden and Hambleton1997; Thissen, Steinberg, & Fitzpatrick, Reference Thissen, Steinberg and Fitzpatrick1989). Thus, in Figs. 1b and 2b, where α
k
≤ α
k+1, categories are ordered as initially assumed. In contrast, category parameters in divide-by-total models for ordered responses are unrelated to
 ${{\rm{\bar \theta }}_k}$
and, hence, they do not inform of category order. Furthermore, these models are analogous to difference models in that they enforce the pre-assumed order of categories: Item parameters in these models cannot infringe the built-in order relation
 ${{\rm{\bar \theta }}_k} \le {{\rm{\bar \theta }}_{k + 1}}$
, as discussed later.
To illustrate these points, consider items whose response categories were assumed to be ordered but whose estimated NRM parameters turn out as in the bottom row of Fig. 3. In Fig. 3a, categories 4 (blue) and 5 (gray) are reversed (α4 = 2.16 > α5 = 1.02); in Fig. 3b, categories 2 (red) and 3 (green) are reversed (α2 = −0.01 > α3 = −0.83). These reversals are also clearly appreciated in the location of the ORFs: In the bottom panel of Fig. 3a, the rightmost super-modal category is not category 5 (gray curve) but category 4 (blue curve); in the bottom panel of Fig. 3b, the ORF for category 2 (red curve) is on the right of the ORF for category 3 (green curve), yielding
 ${\bar \theta _2} = 0.024 &gt; {\bar \theta _3} = - 1.511$
. And note that crossings are ordered in Fig. 3a but they are disordered in Fig. 3b (τ2 = 0.73 > τ3 = 0.07). In other words, items with disordered categories can have ordered or disordered crossings, attesting to the fact that the order of crossings and the order of categories are unrelated in divide-by-total models.
Disordered categories with ordered (a) or disordered (b) crossings in items parameterized under the nominal response model. The top panels show the cumulative probability functions
 $p_k^*$
; the center panels show incorrectly computed functions
 $p_k^*$
that do not take the actual order of categories into account; the bottom panels show the probability p
k
of each response.

Because of category disorder in these examples, the cumulative functions
 $p_k^*$
computed (incorrectly) via Eq. 6 for the pre-assumed order have the shapes shown in the center row of Fig. 3. Although t
1, t
2, and t
3 might arguably be computed from such functions in the case of Fig. 3a (since these thresholds are not affected by the disorder of categories 4 and 5), t
4 is impossible to compute; in contrast, all thresholds can be computed in the case of Fig. 3b, but t
2 will be in error because it is affected by the disorder of categories 2 and 3. Reordering categories using parameters α
k
allows adequate computation of the functions
 $p_k^*$
and renders ordered thresholds for the rearranged categories (top row of Fig. 3).
It should also be noted that rearranging categories into their proper order may not affect the order of crossings. In the bottom panel of Fig. 3a, rearrangement makes τ3 be the crossing of the green and gray curves (instead of the crossing of the green and blue curves), but crossings remain ordered. Analogously, crossings are still disordered in the bottom panel of Fig. 3b after rearrangement: τ1 is now the crossing of the yellow and green curves (instead of the crossing of the yellow and red curves) and τ3 is now the crossing of the red and blue curves (instead of the crossing of the green and blue curves), but crossings remain disordered. In other words, ordered or disordered crossings do not inform of ordered or disordered categories when the NRM is used for items with ordered responses. Only the order of parameters α
k
(which matches the order of
 ${{\rm{\bar \theta }}_k}$
) informs of category order.
These sample items are also useful to illustrate that divide-by-total models for ordered responses cannot produce ORFs that violate
 ${{\rm{\bar \theta }}_k} \le {{\rm{\bar \theta }}_{k + 1}}$
. Suppose the crossings in the bottom panel of Fig. 3a were taken as the category parameters under the PRM. The resultant ORFs (top panel of Fig. 4a) depict instead ordered categories by
 ${{\rm{\bar \theta }}_k}$
(i.e., now category 4 precedes category 5), reflecting the built-in assumption of these models: Parameters relate to categories in their pre-assumed order. If these category parameters were reversed (top panel of Fig. 4b) or disordered (top panel of Fig. 4c), the order of categories defined by the location
 ${{\rm{\bar \theta }}_k}$
of the ORFs is not affected and, in all cases, thresholds defined relative to the functions
 $p_k^*$
are always ordered (bottom row of Fig. 4). By construction, divide-by-total models enforce the order of categories that was assumed in the definition of the conditional probability functions and their parameters cannot contradict this order.
Ordered categories with ordered (a), reversed (b), or disordered (c) crossings in items parameterized under the partial credit model. The top panels show the probability p
k
of each response; the bottom panels show the cumulative probability functions
 $p_k^*$
.

Disordered crossings are often interpreted as evidence of disordered categories (Andrich, Reference Andrich, Smith and Smith2004; Reference Andrich2013a; Reference Andrichb; Andrich et al., Reference Andrich, de Jong, Sheridan, Rost and Langeheine1997) despite contradictory evidence from
 ${{\rm{\bar \theta }}_k}$
and from the fact that the unconditional probability of responding beyond category k (as indicated by the functions
 $p_k^*$
) increases monotonically with θ for all k. Ironically, accepting that categories are disordered at the encounter of disordered crossings instates a contradiction: The conditional probability functions at the foundations of the model (defined between now admittedly non-consecutive categories) are in error and the construction collapses.
Figure 4 is also useful to discuss the inappropriate interpretation of disordered crossings within a framework that is only natural for ordered crossings, namely, what response is (unconditionally) more likely as θ increases. Consider the ordered crossings in Fig. 4a first. All categories are modal within some range of θ and crossings are the points at which, loosely speaking, category k gives way to category k + 1: As θ increases, category k ceases to be modal in favor of category k + 1. Because categories k and k + 1 are both modal at their crossing, consideration of the conditional probability of category k + 1 given that the response is in categories k or k + 1 is meaningful: The response is indeed highly likely to be in one of those categories. None of this applies when crossings are disordered: Although τ2 = 1.09 is undoubtedly the point at which categories 2 and 3 are equally likely in Fig. 4b, their unconditional probabilities are next to nothing and their crossing is not the point at which one gives way to the other (because none of them was ever modal). Disordered crossings cannot be interpreted in a context of category modality and the fact that τ4 < τ1 in Fig. 4b is consistent with the order of the response scale and the latent continuum: For a respondent at θ = τ4 = −1.82, p 1(θ) > p 2(θ) > p 3(θ) > p 4(θ) = p 5(θ) and the expected item score is low; instead, for a respondent at θ = τ1 = 2.12, p 1(θ) = p 2(θ) < p 3(θ) < p 4(θ) < p 5(θ) and the expected item score is high. The same holds with the ordered crossings in Fig. 4a, where τ1 < τ4 instead: At θ = τ1 = −1.82, p 1(θ) = p 2(θ) > p 3(θ) > p 4(θ) > p 5(θ) and the expected item score is low; at θ = τ4 = 2.12, p 1(θ) < p 2(θ) < p 3(θ) < p 4(θ) = p 5(θ) and the expected item score is high. In fact, expected item score describes an increasing function of θ whether crossings are ordered or disordered.
In sum, thresholds and crossings represent different aspects of the ORFs. Thresholds (as defined here) are always ordered, sometimes in accordance with the pre-assumed order of categories (Figs. 1 and 2) and sometimes after rearrangement of the categories that were disordered (Fig. 3). In contrast, crossings may be ordered or disordered independently of the order of categories. Crossings are ordered when each ORF is modal within some range (Figs. 1, 3a, and 4a) and they are disordered when some ORF is non-modal (Figs. 2, 3b, 4b, and 4c). Finally, disordered categories are impossible to identify via models for ordered responses. With those models, the only indicator of potentially disordered categories is misfit (for an example, see the discussion of a physical science item on pages 359–360 of Muraki, Reference Muraki1993), although misfit can also have other causes. The natural approach to identifying the order of categories is by fitting a model that makes no assumptions about such order but whose parameters can be interpreted in the context of ordered categories. Only the NRM has this property and it has been used earlier for this purpose (e.g., González-Romá & Espejo, Reference González-Romá and Espejo2003; Gordon et al., Reference Gordon, Fujimoto, Kaestner, Korenman and Abner2013; Hernández, Espejo, & González-Romá, Reference Hernández, Espejo and González-Romá2006; Maydeu-Olivares, Reference Maydeu-Olivares2005; Murray, Booth, & Molenaar, Reference Murray, Booth and Molenaar2016; Preston, Reise, Cai, & Hays, Reference Preston, Reise, Cai and Hays2011; see also Bock, Reference Bock, van der Linden and Hambleton1997; Samejima, Reference Samejima1972; Reference Samejima1996). However, we will show later that the order of categories returned by an NRM fit is often spurious and incorrect.
Response processes in difference and divide-by-total models
Difference models belong in the Thurstonian tradition in which a K-category item relates to a latent continuum ξ partitioned into K disjoint regions at boundaries ξ
k
, with ξ
k
≤ ξ
k+1 for 1 ≤ k ≤ K – 1. Each region is associated with one of the response categories. Presenting an item to a respondent with trait level θ elicits a latent response which is the realization of a continuous random variable with mean θ, variance σ2, and probability density f over ξ. The probability p
k
of a response in category k is thus the area under f within the applicable range of ξ. The GRM derives from this characterization of the response process when f is the logistic probability density function, σ2 = π2/3α2 (where α is the item discrimination parameter), and ξ
k
= b
k
. Other difference models arise for alternative f or alternative parameterizations of the boundaries. Such response process produces cumulative functions
 $p_k^*$
that have a common functional form and only differ by translation (i.e., by the value of their location parameter).
Divide-by-total models for ordered responses do not admit this characterization. This is immediately obvious upon noticing that the functions
 $p_k^*$
lack a common functional form: As the right-hand side of Eq. 6 reveals (for the NRM), the number of addends in the numerator decreases from K – 1 to 1 as k increases. Such ORFs cannot thus arise from a single distribution f that slides along the latent continuum ξ as θ varies, and the same holds for all divide-by-total models. Divide-by-total models for items with ordered categories instead assume K – 1 dichotomous and non-independent processes between pairs of consecutive categories considered in isolation. These dichotomies are described by the conditional probability functions of a response in category k given that the response is in categories k – 1 or k and they differ from the functions
 $p_k^*$
that relate instead to a dichotomous process between exhaustive and disjoint subsets of categories.
Empirical example
The previous section discussed thresholds and crossings with the help of artificial item parameters, and discussed also that only a model that does not assume ordered categories can assess their empirical order. This section illustrates this with empirical data. True item parameters and response processes are unknown in such cases but a look at estimated item parameters and ORFs across types of models fitted to the same data is informative. The data consist of responses to a 37-item questionnaire on interest in soccer that was developed as a classroom exercise. The questionnaire had Likert-type items with six categories and was administered to 102 respondents. multilog 7.03 (du Toit, Reference du Toit2003) was used to estimate NRM, GRM, and GPCM item parameters.
Figure 5a shows the distribution of responses in four illustrative items. The response distribution is uneven in items 4, 11, and 23, with the largest frequency occurring in category 1; in item 4, all categories received one or more responses; in contrast, item 11 received no responses in category 5 and item 23 received no responses in categories 3 or 4. The response distribution is instead relatively uniform in item 28. The rest of the items had similarly even or uneven response distributions.
Empirical response distributions for four items (a) and estimated option response functions under the nominal response model (NRM; b), the graded response model (GRM) without correction for zero counts (c) and with it (d), and the generalized partial credit model (GPCM; e).
Note: Negative-valued curves in (c) reach an ordinate of −1 but are drawn with a compressed scale.

The NRM fit returned the ORFs in Fig. 5b. The inset table on the left in each panel lists the crossings τ k , which are disordered (values printed in red) due to the dwarfing of some ORFs. In item 4, category 3 (green) was endorsed by a single respondent and its ORF hardly rises above zero; analogously, category 5 was not endorsed by any respondent in item 11 and its ORF virtually evaluates to zero along θ; the same holds for the zero-count categories 3 and 4 in item 23; and disordered crossings occurred also in item 28 despite the relatively uniform response distribution. The inset table on the right of each panel lists estimated α k , indicating disorder also in red. Disordered α k suggests disordered categories, a clearly spurious outcome affecting the unit-count category 3 in item 4, the zero-count category 5 in item 11, and the zero-count categories 3 and 4 in item 23. The NRM fit further suggests that categories 5 and 6 are reversed in the latter item. This is arguably a spurious outcome too, given that categories 5 and 6 were endorsed by only one and two respondents, respectively. Disorder of categories is also returned for item 28 (i.e., α3 = −0.40 > α4 = −0.42) despite the even response distribution, although this is only under an inflexibly strict interpretation of the order of point estimates.
Some aspects of these results might be attributed to the uneven distribution of responses, but this is disconfirmed by the fact that disordered crossings and parameters α k are observed in items with more uniform response distributions. In fact, the NRM calibration flagged 32 of the 37 items as affected by category reversals. The outcome of disordered categories according to an NRM characterization (with or without disordered crossings) has also been reported in empirical studies involving very large samples: Using 3-category items, Murray et al. (Reference Murray, Booth and Molenaar2016) found that an NRM characterization flagged the middle category as first or last in a good number of items in two separate studies with 10,261 and 1,212 respondents, respectively. They only reported the average endorsement rates of the middle category in subgroups of items and, hence, purportedly disordered categories as indicated by the NRM fit cannot be linked to the form (uniform or skewed) of the response distributions, as is done in Fig. 5 here. This issue will be addressed in simulation studies later.
It is also worth stressing that multilog handles small (or zero) counts adequately under the NRM: Parameter estimates are such that the ORFs for intermediate categories with small or zero counts are appropriately small. Yet, zero counts cause problems to other algorithms (see Andrich, Reference Andrich2010; Linacre, Reference Linacre, Smith and Smith2004). In contrast, difference models accommodate zero counts naturally, although the following discussion shows that multilog fails to do so.
The results of a first GRM characterization are shown in Fig. 5c, where the inset table in each panel now lists estimated category parameters (thresholds). In items 4 and 28, thresholds are ordered and the distance between consecutive thresholds reflects the frequency of responses in each category: For instance, in item 4, b 2 and b 3 (joined by an arc in the list) are very close, due to the fact that a single respondent endorsed category 3. The same holds for item 11, where category 3 was endorsed by a single respondent and, accordingly, b 2 and b 3 (joined by an arc in the list) are very close. Naturally, a zero count in intermediate category k (i.e., for 1 < k < K) should result in b k = b k−1 but this is not what multilog produces. The zero count in category 5 of item 11 renders disordered thresholds and, hence, the ORF for the zero-count category 5 (magenta curve) is negative-valued and there is a broad range of θ in which the probability of a response in categories 4 (blue curve) or 6 (black curve) are both unity. An analogous anomaly occurs for item 23, where zero counts occur in two categories.
Disordered GRM threshold estimates arise because multilog does not seem to enforce the order constraint that holds for difference models: b
1 may be unconstrained but, for
 $2 \le k \le K - {\rm{1}},{b_k} = {b_{\rm{1}}} + \sum\nolimits_{m = 2}^k {{\Delta _m}} {\rm{with\ }}{\Delta _m} \ge 0$
. Besides α, the free parameters to estimate are b
1, Δ2, ..., Δ
K−1, which can subsequently be converted into the b
k
that users expect. One way around this glitch is to adjust the syntax file to exclude categories with zero counts, with the result shown in Fig. 5d. This adjustment solves the problem and shows that the glitch did not meaningfully affect parameter estimates for items with non-zero counts (compare the results for the first and second GRM calibrations for items 4 and 28 in Fig. 5). Another way around zero counts is to add K fake respondents each of whom selects one and the same category on all items, but fake responses alter parameter estimates. This was confirmed in a third GRM calibration run, but presentation of these results is omitted.
It is also interesting that ORFs from NRM and GRM characterizations are similarly shaped when the NRM does not estimate disordered categories. In contrast, estimated ORFs from the GPCM characterization were generally sharper (see Fig. 5e). This feature will be assessed later via simulation. Reporting of GPCM results for these data will be discontinued, but note that the GPCM also yields virtually null ORFs for categories with small or zero counts.
The GRM (in the second calibration) fitted the data better than the NRM, as seen in Fig. 6a: On an item-by-item basis, fit statistics reveal larger discrepancies between observed and expected counts of responses in the NRM characterization than in the GRM characterization. Better fit of the GRM compared to the PCM was also reported by Baker et al. (Reference Baker, Rounds and Zevon2000) for empirical data. Other empirical and simulation studies have reported better fit of difference models compared to divide-by-total models (e.g., De Ayala et al., Reference De Ayala, Dodd and Koch1992; Maydeu-Olivares, Reference Maydeu-Olivares2005; Maydeu-Olivares et al., Reference Maydeu-Olivares, Drasgow and Mead1994). Despite the inferior fit, the NRM rendered a superior test information function (TIF; Fig. 6b), suggesting more precise estimation of trait levels. Yet, expected a posteriori (EAP) GRM and NRM trait estimates were almost identical (see Fig. 6c). This apparent superiority of the NRM in terms of TIFs will be explored later via simulation.
Comparison of the account of data provided by the nominal response model (NRM) and the graded response model (GRM) as to item fit (a), test information functions (b) and trait estimates (c).

It is also worth documenting the validity of our previous statement that only the NRM can identify truly disordered categories. For this purpose, we used a larger data set of 262 responses to the same questionnaire, which was free of zero counts. The data were fitted with the GRM, the NRM, and the GPCM as above, but also with the PCM. In a second run, the same models were identically fitted after responses on item 28 had been coded in reverse to simulate reversed categories; responses on the remaining 36 items were left untouched.
The top row of Fig. 7 shows the (relatively uniform) distribution of original responses on item 28 along with the estimated ORFs under each model. The ORFs describe very similar shapes across models and concur as to the order of categories, with disordered crossings. The bottom row of Fig. 7 shows the distribution of reversed responses and the estimated ORFs under each model. Category locations
 ${{\rm{\bar \theta }}_k}$
in each case under each model are listed in Table 1. As expected, the NRM (Fig. 7b) succeeds at identifying the disordered categories: ORFs are virtually identical in both cases, but ascribed to categories in reverse order. This can be appreciated in the estimated parameters (i.e., α
k
and c
k
in the bottom panel of Fig. 7b are virtually identical to α
K+1−k
and c
K+1−k
in the top panel) and in the color of the ORFs (e.g., the lowest category is 1 in the top panel but it is 6 in the bottom panel; see also category locations in Table 1). Surprisingly, the GPCM (Fig. 7c) also identified the reversed categories (as noted by the color of the ORFs and category locations in Table 1), but this is only an opportune consequence of the fact that multilog fits the GPCM via a constrained form of the NRM that allows the discrimination parameter α to come out negative. Yet, this allowance is insufficient to recover the ORFs adequately: They differ in shape and location in the top and bottom panels of Fig. 7c. Fitting the PCM (which forces equal α on all items; Fig. 7d) yields a positive-valued α that misses the reversed categories and produces reasonable-looking ORFs in which the misfit is not apparent. Finally, direct implementation of the GRM in multilog does not allow negative-valued estimates of α either and, hence, produces nearly flat ORFs with ordered category parameters that clearly indicate misfit (bottom panel of Fig. 7e). Additional runs simulating disordered categories (e.g., turning 1–2–3–4–5–6 into 4–5–6–1–2–3, as opposed to simply reversing them), confirmed that only the NRM identifies the proper order of categories, but presentation of these results is omitted.
Estimated option response functions under the nominal response model (NRM; b), the generalized partial credit model (GPCM; c), the partial credit model (PCM; d), and the graded response model (GRM; e) for an item with the original distribution of responses across categories (top row) and with recoded responses to simulate reversed categories (bottom row).

Location of intermediate categories in the top and bottom rows of Fig. 7

In sum, either under difference models or under divide-by-total models, crossings are disordered due to dwarf ORFs for some intermediate categories. Threshold disorder returned by multilog under the GRM is not indicative of category disorder either but the result of a glitch at the encounter of zero counts. In turn, although the NRM fit can identify disordered categories, the overwhelming prevalence of purportedly disordered categories suggests that it also provides spurious evidence to this effect.
Simulaton study
The preceding section discussed order of categories, thresholds, and crossings, and finished with an empirical example that raised a number of issues bearing on these matters, one of which is the influence of zero (or small) counts and uneven response distributions on category parameter estimates. An investigation of those issues requires knowledge of the reality that generated the data, which is unavailable in empirical studies. This section thus presents simulation results that investigate the conditions for impossibly disordered GRM threshold estimates and the conditions for spuriously disordered categories in NRM characterizations. The simulations also allow assessing the superiority of the TIF from NRM characterizations.
The main simulation (simulation 1) was designed to produce GRM data with zero counts at selected categories across 20 items. True thresholds were thus placed to render items in which one or more intermediate categories end up with zero counts, items in which zero counts occur at extreme categories, and items for which the response distributions are uniform or skewed (see Table 2; with these parameters, crossings are disordered except for item 19). Item discrimination parameters were drawn from a uniform distribution on [1, 3].
True GRM parameters for the 5-category items in simulation 1

Data were simulated for 500 respondents whose true θs were drawn from a unit-normal distribution. This sample size may be regarded as small according to commonly held beliefs that data from several thousands of respondents are needed to estimate parameters accurately, despite evidence to the contrary (e.g., De Ayala & Sava-Bolesta, Reference De Ayala and Sava-Bolesta1999; DeMars, Reference DeMars2003; García-Pérez et al., Reference García-Pérez, Alcalá-Quintana and García-Cueto2010; Kieftenbeld & Natesan, Reference Kieftenbeld and Natesan2012; Maydeu-Olivares et al., Reference Maydeu-Olivares, Drasgow and Mead1994; Reise & Yu, Reference Reise and Yu1990; Wollack, Bolt, Cohen, & Lee, Reference Wollack, Bolt, Cohen and Lee2002). Results reported below show that estimation accuracy is not compromised with samples of this size, which are appropriate in a study that mimics the conditions of many empirical situations. Simulations were nevertheless repeated with sample sizes of 5,000, with no meaningful change in the main results.
For ease of manipulation of zero counts, parameters were estimated across several runs in which the number of respondents read from the data file increased progressively from 20 to 500 in steps of 20. Thus, zero counts prevailed at small sample sizes and they progressively disappeared as sample size increased. Zero counts disappeared when sample size reached 160. GRM parameters were estimated with multilog as before, without adjusting the syntax to leave out categories with zero counts; NRM and GPCM parameters were similarly estimated.
A second simulation (simulation 2) produced analogous NRM data. For this purpose, NRM item parameters were chosen such that the resultant ORFs virtually match those of the GRM items in simulation 1 (see Fig. A1 in the Supplementary Materials). NRM data were simulated for the same 500 respondents. This second simulation differs only as to what model generated data for items with ordered categories and thresholds but disordered crossings. Data were analyzed as in simulation 1, using multilog to obtain NRM, GRM, and GPCM parameter estimates as a function of the size of the sample of respondents.
A final simulation (simulation 3) used GRM parameters from items in the depressive symptoms bank of the Patient-Reported Outcomes Measurement Information System (PROMIS; for item parameters, see Table 3 in Choi, Reise, Pilkonis, Hays, & Cella, Reference Choi, Reise, Pilkonis, Hays and Cella2010). These 28, 5-category Likert-type items have large discrimination parameters (from 2.02 to 4.54) and large separation of category parameters so that crossings are ordered. Yet, the highest category parameter is somewhat high for some items (e.g., b 4 = 3.13 for item 27) so that zero counts are not unlikely with small samples and uneven response distributions occur at all sample sizes. Simulated data were also generated for 500 respondents and submitted to multilog for GRM, NRM, and GPCM calibrations as a function of sample size.
The main goal of these simulations is to compare the ORFs estimated by each model with the true ORFs that generated the data. All analyses used this as the main criterion and, hence, conventional goodness of fit measures will not be reported: Those measures are useful in an empirical scenario in which estimated ORFs can only be assessed against the data for lack of knowledge of the true ORFs that generated the data.
Disordered GRM threshold estimates
This section explores the relation of zero counts and disordered GRM threshold estimates. Figure 8 shows the results of simulation 1 in a form that highlights this aspect. Each column reports GRM calibration results for data from the number of respondents indicated at the top. Each cell depicts an item and is divided into five consecutive vertical stripes denoting each response category. A black stripe at some location indicates a zero count in the applicable category. A red cross over a cell indicates disordered threshold estimates. Disorder occurred when some intermediate category had zero counts, and ceased to occur when additional data entered responses in those categories. In some cases (items 2 and 18), all categories had non-zero counts and threshold estimates were never disordered. Understandably, zero counts at extreme categories (e.g., items 4, 17, and 19) do not render disordered threshold estimates.
Disordered threshold estimates under the graded response model when zero counts occur in intermediate response categories.

Figure 9 plots estimated against true parameters for data from 80 (Fig. 9a) and 160 respondents (Fig. 9b), excluding in the former case the five items with disordered threshold estimates. Clearly, disordered threshold estimates for some items do not affect parameter estimation for the remaining items: At both sample sizes, symbols line up along the diagonal although naturally more tightly around it with the larger sample. It is remarkable that GRM parameters can be accurately recovered with small samples even when response distributions are uneven and endorsement rates are low for some categories. The anomaly caused by zero counts does not contradict this statement, as it speaks of a glitch in the estimation algorithm.
Relation between estimated and true item parameter values under the graded response model when there are zero counts in some categories for some items (a) and when all categories have non-zero counts on all items (b).

Thoroughly analogous results were obtained in the GRM analysis of data from simulations 2 and 3, but a graphical presentation of these results is omitted. (Obviously, results in the form of Fig. 9 could not be reported for simulation 2 because estimated GRM parameters do not relate to the generating NRM parameters.) To ensure that these results are not incidental, simulation 1 was repeated numerous times for items with other true parameters and other numbers of response categories, with identical outcomes.
Disordered NRM response categories
Simulated data were also used to investigate estimation under the NRM. Since all items had ordered categories, NRM parameter estimates should not contradict this reality. Figure A1 in the Supplementary Materials shows that NRM parameters exist that reproduce almost exactly the ORFs of the GRM items in simulation 1, and the same holds for the GRM items in simulation 3. Hence, fitting the NRM to data from simulation 1 should render estimated ORFs that are similar to the generating ORFs, reflecting the true order of categories.
Figure 10 shows the results of the NRM calibration of data from simulation 1 in the form of Fig. 8, except that red crosses now indicate that estimated NRM parameters inform of category reversals (i.e., α k > α k+1 for some 1 ≤ k < K – 1). Category reversals are returned for most items at all sample sizes and irrespective of zero counts, appearing and disappearing haphazardly as sample size increases. Disorder of categories is the most common outcome of multilog when categories are indeed ordered in the reality that generated the data. This result questions the validity of a similar outcome encountered in the NRM analysis of empirical data (e.g., Murray et al., Reference Murray, Booth and Molenaar2016), at least for analyses based on point estimates of parameters αk. Sampling error must be considered for better-grounded decisions (Salzberger, Reference Salzberger2015), but this approach will not be pursued here.
Disordered categories returned upon fitting the nominal response model to data generated from items with ordered categories.

Category disorder in the NRM calibration indicates that ORFs were not recovered adequately. The estimated ORFs from the GRM and NRM characterizations of data from 500 respondents were thus compared to the generating ORFs. Figure 11 shows representative results for four items in simulation 1, including also GPCM results to be discussed later. Figure 11a shows the distribution of responses across categories and Fig. 11b shows the generating ORFs. The results of the GRM calibration are shown in Fig. 11c, revealing the accurate recovery that had already been documented for smaller sample sizes in Fig. 9. In contrast, the NRM calibration (Fig. 11e) failed to recover adequately the shapes of the ORFs. In general, ORFs from the NRM differed from the generating ORFs within the range of θ associated with categories used infrequently, that is, the lower range of θ for items 15 and 8 (first and third rows of Fig. 11) and the upper range of θ for item 20 (bottom row of Fig. 11). Note also the category reversals for items 8 and 20 (α k parameters joined with arcs in the bottom half of Fig. 11), which are also clearly apparent in the estimated ORFs. Results for other items were analogous: accurate recovery of the generating ORFs in the GRM calibration and poor recovery with frequent (and spurious) category reversals in the NRM calibration. Generally, the NRM outcome of disordered categories affected the extreme super-modal categories (as in the bottom half of Fig. 11), particularly for items with skewed response distributions. Although NRM parameters exist that can reproduce the generating ORFs of the GRM items in simulation 1, multilog seems incapable of coming close to them, at least when the response distribution is skewed.
Simulated response distributions for four items (a), true option response functions that generated the data under the graded response model (GRM; b), and estimated option response functions from the GRM (c), the generalized partial credit model (GPCM; d), and the nominal response model (NRM; e).

Analysis of NRM data from simulation 2 yielded identical results for NRM calibration. The GRM calibration of NRM data recovered the generating ORFs more accurately than the NRM calibration itself (see Fig. A2 in the Supplementary Materials). Thus, poor NRM recovery of ORFs for GRM data (Fig. 11) is not a consequence of the discrepancy between generating and fitted models. Rather, it points to an intrinsic difficulty in NRM estimation when response distributions are skewed. The same anomaly occurred in simulation 3, despite the separated categories and ordered crossings of the PROMIS items. Category reversals and disordered crossings were also returned for most items except at the largest sample sizes (400 or more), and the estimated ORF of the uppermost super-modal category was often too shallow even with the largest sample size (see Fig. A3 in the Supplementary Materials).
Peculiarities of the GPCM characterization
Figure A4 in the Supplementary Materials shows that GPCM item parameters also exist that reproduce almost exactly the true ORFs of the GRM items in simulation 1, and the same holds for simulations 2 and 3. We discussed earlier that the GPCM characterization of empirical data renders ORFs that are much sharper than those arising from NRM of GRM characterizations (Fig. 5). The same outcome was observed with simulated data (Fig. 11d and Figs. A2 and A3 in the Supplementary Materials), revealing a systematic misestimation. Remarkably, and compared to a GRM characterization, the GPCM characterization annihilates the ORFs of rarely-used intermediate categories (see the red curves for items 8 and 15 in Fig. 11d, compared to estimated GRM curves in Fig. 11c and to true ORFs in Fig. 11b). In any case, the estimated ORFs reflected the assumed order of categories (with ordered or disordered crossings as needed) without misbehavior due to zero counts.
Superiority of NRM test information function and standard errors
Figure 6b suggested that an NRM characterization renders a superior TIF than a GRM characterization. This was also reported in other empirical studies comparing the NRM with other polytomous models (e.g., Preston et al., Reference Preston, Reise, Cai and Hays2011) and holds the promise of more precise estimation of trait levels. Some studies have nevertheless shown that this superiority is an artifact (e.g., García-Pérez, Reference García-Pérez2014) and this study offers another opportunity to check it out.
The black curve in each panel of Fig. 12a shows true TIFs in each simulation given the model and item parameters. Also plotted in each panel is the estimated TIF in the GRM calibration (blue curve) and in the NRM calibration (red curve) with 500 respondents. Estimated TIF under the GRM calibration is very close to the true TIF except for a downward shift in simulation 3, which is an understandable change of scale. A close match between true and GRM estimates of the TIF is the result of accurate recovery of the ORFs, regardless of which model generated the data. In contrast, NRM calibrations rendered estimated TIFs that are sometimes superior within some range of θ (e.g., between −2 and 0 in simulation 2) and sometimes slightly inferior too (e.g., between −3 and −1.5 in simulation 1, or between 0.5 and 2 in simulation 3). Despite these differences, EAP trait estimates from the GRM calibration are no more or less tightly related to true traits (Fig. 12b) than are estimated NRM traits (Fig. 12c) and, additionally, GRM and NRM trait estimates are much more tightly related to one another (Fig. 12d) than either is to true trait. The systematic estimation bias apparent in the bottom panels of Figs. 12b and 12c (for simulation 3) relates to the change of scale discussed earlier when average thresholds are positive in all items, which is also responsible for the floor estimates assigned to respondents endorsing the lowest category on all items.
True and estimated test information functions (a) with the graded response model (GRM) and the nominal response model (NRM), relation between true traits and estimated traits with the GRM (b) or with the NRM (c), and relation between GRM and NRM trait estimates (d) in each of the simulation studies (rows).

For a closer look at the comparative accuracy of GRM and NRM trait estimation in simulations 1 and 2, administration of the applicable test was simulated for 5,000 respondents at each trait level θ between −3 and 3 in steps of 0.1. Simulated responses were generated using the true item parameters and model in each case, and they were subsequently used to obtain EAP trait estimates from the previously estimated GRM and NRM item parameters. This simulation thus mimics empirical situations in which data are collected with a test whose items have fixed (but unknown) parameters and trait estimation uses item parameters previously estimated with a calibration sample. Trait estimates of respondents at each θ were used to compute empirical bias (average difference between estimated and true trait, plotted in the lower panels of Fig. 13 as a function of θ) and empirical standard errors (standard deviation of estimated traits, plotted as black curves in the upper panels of Fig. 13 as a function of θ). Also plotted in each of the upper panels of Fig. 13 is the theoretical standard error, computed as the square root of the inverse of the estimated TIF plotted with the corresponding color in the top and center panels of Fig. 12a.
Bias and standard error of trait estimates obtained with the graded response model (GRM) or the nominal response model (NRM) for GRM data in simulation 1 (a) and for NRM data in simulation 2 (b).

It is clearly apparent in the upper panels of Fig. 13 that the TIF computed from parameter estimates in a calibration study describes standard errors adequately for intermediate values of true θ (say, between −2 and 2). Then, expectations based on a comparison of estimated TIFs for alternative calibrations of the same data (Fig. 12a) are fulfilled. However, the lower panels of Fig. 13 qualify this conclusion. In principle, estimation bias should be uniform across θ, reflecting only a possible scale shift. Uniform bias at intermediate θ (again, between −2 and 2) is indeed prevalent in GRM estimation (bottom-left panel in Figs. 13a and 13b), whereas NRM estimation results in a bias whose magnitude varies with θ (bottom-right panel in Figs. 13a and 13b) and is indeed highest within the range of θ where standard errors are comparatively lower than those arising from GRM estimation. In other words, in the range of θ where NRM trait estimates are more tightly packed (i.e., smaller standard errors) they are also further away from the true value (i.e., larger bias). These characteristics hold for GRM and NRM estimation with GRM data (Fig. 13a) or NRM data (Fig. 13b).
Fitting the model that was used to generate data should give a better account than fitting any other model, except when mimicry allows several models to give identical accounts of the data. Our results document a failure of multilog to find the equivalent NRM characterization of GRM items (as well as a proper characterization of NRM items) and, thus, the unsuitability of NRM calibration results for identifying a mismatch between assumed and empirical orders of categories. NRM characterization via multilog is much too prone to spuriously flagging items whose categories were indeed correctly ordered and it also results in a spuriously higher TIF within some range of θ. As for the GRM characterization, not even a massive presence of items with disordered crossings hampers adequate recovery of the generating ORFs and accurate estimation of respondents’ trait levels, provided that zero counts do not occur or that measures have been taken to circumvent the estimation anomaly of multilog.
Disordered crossings and the consequences of collapsing response categories
Some researchers acknowledge that disordered crossings in divide-by-total models do not imply disordered categories or any other problem with the response scale or the items (Adams et al., Reference Adams, Wu and Wilson2012; Annoni, Weziak-Bialowolska, & Farhan, Reference Annoni, Weziak-Bialowolska and Farhan2013; Linacre, Reference Linacre1999; Wang et al., Reference Wang, Deutscher, Yen, Werneke and Mioduski2014; Wetzel & Carstensen, Reference Wetzel and Carstensen2014). Yet, the most common action at the encounter of disordered crossings is the removal of the incumbent items (Bokhary, Suttle, Alotaibi, Stapleton, & Boon, Reference Bokhary, Suttle, Alotaibi, Stapleton and Boon2013; Wetzel, Hell, & Pässler, Reference Wetzel, Hell and Pässler2012) or the collapsing of categories so that the reformatted scale produces ordered crossings (Ashley et al., Reference Ashley, Smith, Keding, Jones, Velikova and Wright2013; Bee, Gibbons, Callaghan, Fraser, & Lovell, Reference Bee, Gibbons, Callaghan, Fraser and Lovell2016; Bell et al., Reference Bell, Low, Jackson, Dudgeon, Copolov and Singh1994; Bourke, Wallace, Greskamp, & Tormoehlen, Reference Bourke, Wallace, Greskamp and Tormoehlen2015; Brogårdh, Lexell, & Lundgren-Nilsson, Reference Brogårdh, Lexell and Lundgren-Nilsson2013; das Nair, Moreton, & Lincoln, Reference das Nair, Moreton and Lincoln2011; Dougherty, Nichols, & Nichols, Reference Dougherty, Nichols and Nichols2011; Grimbeek & Nisbet, Reference Grimbeek and Nisbet2006; Lundgren-Nilsson, Tennant, Grimby, & Sunnerhagen, Reference Lundgren-Nilsson, Tennant, Grimby and Sunnerhagen2006; Oluboyede & Smith, Reference Oluboyede and Smith2013). Yet, collapsing categories to eliminate disorder does not generally improve model fit (Nilsson, Sunnerhagen, & Grimby, Reference Nilsson, Sunnerhagen and Grimby2005; Smith, Richardson, & Tennant, Reference Smith, Richardson and Tennant2009), attesting to the fact that disordered crossings were not a problem. The arguments justifying these practices as well as their utility have been questioned (Wetzel & Carstensen, Reference Wetzel and Carstensen2014) and this section assesses its efficacy by consideration of TIFs and accuracy of trait estimation before and after collapsing categories.
Collapsing adjacent categories is only straightforward under difference models, where it simply amounts to eliminating the parameter separating their regions in the partition of ξ without affecting other category parameters. Specifically, if categories k and k +1 are collapsed, the ORF for the joint category is, from Eq. 2,
 ${p_k}({\rm{\theta }}) + {p_{k + 1}}({\rm{\theta }}) = p_{k - 1}^*({\rm{\theta }}) - p_{k + 1}^*({\rm{\theta }})$
, which also conforms to Eq. 2: Only parameter b
k
has been removed with no effect on other parameters and, hence, on the ORFs for the remaining categories.
We used data from simulation 1 to assess the effect of a reduction from five to three categories aimed at solving the “problem” of disordered crossings. Let the original categories be labeled 1, 2, 3, 4, and 5. Provision of only three response categories (now labeled 1*, 2*, and 3*) might make respondents mark 1* when their original response would have been 1 or 2, mark 2* when their original response would have been 3, and mark 3* when their original response would have been 4 or 5; but it might as well make them mark 1* when their original response would have been 1, mark 2* when their original response would have been 2, 3, or 4, and mark 3* when their original response would have been 5. Which strategy respondents use surely depends on how categories are labeled (if they are), but even then it is uncertain that all respondents will use the same strategy. Because variations across respondents or across items in this respect are myriad, the following analysis will consider that one or the other strategy is uniformly used by all respondents on all items.
The effects of collapsing categories under the GRM can be easily described relative to the original calibration by adding the ORFs of collapsed categories and leaving the remaining ORFs unchanged. Figure 14a shows the TIF of the original 5-category scale (black curve, reproduced from the top panel of Fig. 12a) along with the TIFs that result from the strategies discussed in the preceding paragraph: collapsing the ends (blue curve) and collapsing central categories (red curve). Alternatively, new item parameters for the reduced scale could be sought by recoding responses and recalibrating, with the result shown in Fig. 14b also along with the TIF of the original 5-category scale. In both cases, collapsing categories produces a drop in the TIF.
True test information function (TIF) of the original 5-category scale and after collapsing categories after the fact (a) or upon recalibration (b) with the graded response model. Bias and standard error of trait estimation are shown underneath in each of the three scenarios (c–e).

The bottom part of Fig. 14 shows the consequences using parameter estimates from the after-the-fact approach (results for the recalibration approach were analogous and are omitted). The method was again to simulate responses (to items with their true parameters) for 5,000 respondents at each trait level from −3 to 3 in steps of 0.1 using the original 5-category scale. Bias and standard error of estimation at each θ were computed in three ways: for the original scale (using responses on the 5-category scale and item parameters estimated in the original calibration with five categories), after collapsing the ends and after collapsing the central categories (recoding responses accordingly and using after-the-fact item parameters for each collapsing approach). The results show that bias is more uniform and standard errors are smaller when the original 5-category scale is used and trait levels are estimated using the original item parameter estimates (Fig. 14c), in comparison with the outcomes of collapsing categories at the ends (Fig. 14d) or collapsing central categories (Fig. 14e).
In contrast, the effects of collapsing categories under divide-by-total models can only be assessed via recalibration because collapsing categories invalidates all the parameters. Indeed, from Eq. 4, the ORF of the new category that results from collapsing categories k and k +1 is p
k
(θ) + p
k+1(θ) =
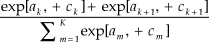 ${{\exp [{a_k}{\rm{\theta }} + {c_k}] + \exp [{a_{k + 1}}{\rm{\theta }} + {c_{k + 1}}]} \over {\sum\nolimits_{m = 1}^K {\exp [{a_m}{\rm{\theta }} + {c_m}]} }}$
, which cannot be expressed in the form of Eq. 4 and, thus, is incompatible with the structure of the NRM. The same holds for other divide-by-total models. Then, recalibration is needed to estimate parameters for the new scale. In other words, under the NRM (and, in general, under all divide-by-total models), collapsing categories affects the ORFs of all categories, often dramatically (see Figures 1 and 2 in Dougherty et al., Reference Dougherty, Nichols and Nichols2011; Figures 3 and 4 in Gothwal, Wright, Lamoureux, & Pesudovs, Reference Gothwal, Wright, Lamoureux and Pesudovs2011; Figure 3 in Wang et al., Reference Wang, Zhou, Luo, Xu, She, Chen and Wang2015; and Figure 1 in Zhong, Gelaye, Fann, Sanchez, & Williams, Reference Zhong, Gelaye, Fann, Sanchez and Williams2014). This feature made Jansen and Roskam (Reference Jansen, Roskam, Degreef and van Buggenhaut1984; Reference Jansen and Roskam1986; Roskam & Jansen, Reference Roskam and Jansen1989) question the validity of divide-by-total models (see also the exchange between Andrich, Reference Andrich1995 and Roskam, Reference Roskam1995). Recalibration after responses in the original K categories are recoded into the new K
* categories (with K
*
< K) has two related implications. First, item parameters thus estimated for the K
*-category scale do not portray how respondents would have used it. Second, if the K
*-category scale with recalibrated item parameters turns out superior by any analyses, its direct use is still unwarranted because it entails a different response process.
To assess the magnitude of these implications, we used in a simulation PCM item parameters reported by Alexandrowicz, Friedrich, Jahn, and Soulier (Reference Alexandrowicz, Friedrich, Jahn and Soulier2015) in an empirical application of this recalibration approach. They conducted a comparative study of several scoring schemes for 30–, 20–, and 12-item versions of the General Health Questionnaire (GHQ). Items were administered once with a 4-category scale that we will label 1–2–3–4 and PCM item parameters were estimated from these responses. Collapsing methods included a trichotomization that merged the two lowest categories (1–1–2–3) and trichotomized data were recalibrated also with the PCM. Crossings were not disordered in any item under the original calibration or upon recalibration. Our simulation used parameter estimates for the original 4-category scale (henceforth, original parameters) and upon recalibration of the 3-category scale (henceforth, recalibrated parameters), in both cases using the 30-item GHQ. The ORFs for each item under each calibration are plotted in Fig. A5 of the Supplementary Materials.
It should first be noted that recalibration shifted item locations: For the original 4-category scale, estimated locations ranged from −0.779 to 2.237 with an average of 0.995; upon recalibration, locations ranged instead from −1.421 to 2.115 with an average of 0.462. This shift explains why the person parameter distribution was tight, centered, and symmetric with the 4-category coding whereas it was broader, positively skewed, and displaced downward under the 3-category recoding (compare the top parts of Figures 1a and 1e in the Electronic Supplemental Material of Alexandrowicz et al., Reference Alexandrowicz, Friedrich, Jahn and Soulier2015). To equate parameter spaces in our simulations, 3-category item parameters were shifted so that the highest crossing on each item was at the same position as the highest crossing in the 4-category structure. This realignment leaves the ORFs for the non-collapsed categories virtually at the same locations in both cases.
Figure 15a shows the TIF for the 4-category scale (blue curve) and for the 3-category scale (red curve). A drop is clearly apparent at low θ, the understandable result of giving up discriminative information that the original categories 1 and 2 provided. Three simulations were run to assess bias and standard errors of trait estimates, which were analogous to simulations reported earlier (i.e., 5,000 respondents at each true θ, also in steps of 0.1 but now from −2 to 5 given the broader range of the TIFs and the focus on positive θ). In the first simulation, responses on the 4-category scale were generated using original item parameters and traits were estimated using also those parameters (to mimic use of the original GHQ). In the second simulation, identically generated responses were immediately recoded into the 3-category scale and traits were estimated from recoded data using recalibrated item parameters (to mimic a presumably improved practice that uses the original scale but estimates traits after collapsing responses). In the third simulation, responses on the 3-category scale were generated using recalibrated item parameters and traits were estimated using also those parameters (to mimic direct use of the 3-category scale, on the assumption that recalibrated parameters portray the structure of such scale).
Original test information function (TIF) for 4-category items described under the partial credit model and after collapsing the lowest two categories (a). Bias and standard error of trait estimation are shown underneath in each of three scenarios (b–d).

Results of the first simulation are plotted in Fig. 15b in the format of previous figures. Bias is relatively small and empirical standard errors match predictions from the TIF, as expected when traits are estimated with the parameters used to generate data. Results of the second simulation are plotted in Fig. 15c (and note the expanded range of the vertical axis in the bottom panel), revealing the inadequacy of collapsing data with the structure of the original scale to estimate traits using recalibrated parameters. Trait estimation is understandably poor when true θ is negative because GHQ items focus on the positive range: Many estimates attain the boundary value associated with endorsement of the lowest category on all items. Boundary estimates occurred also in the first simulation but they are more frequent here because responses originally in category 2 are now recoded into category 1. Despite inaccurate trait estimation under the conditions of our second simulation, the correlation with trait estimates from the first simulation was high although it varied with true θ. At θ = −2 (our lowest true θ) the correlation was only .485 due to the massive presence of boundary estimates in the second simulation but correlations progressively increased up to .999 at θ = 5. These results are in good agreement with Alexandrowicz et al.’s (Reference Alexandrowicz, Friedrich, Jahn and Soulier2015) report of a correlation of .885 between person parameter estimates from the original 4-category coding and from the 3-category recoding for the 30-item GHQ (see their table 3), a correlation computed for 511 respondents whose unknown true traits were surely diverse.
Results of the third simulation are plotted in Fig. 15d (and note that the vertical axis in the bottom panel is back to the range of Fig. 15b, but shifted downward). These results also indicate that bias is small and standard errors are as expected when trait levels are estimated with the item parameters used to generate the data, but only when true θ is within the range appropriate for the items (0 < θ < 5 in this case, given the red-colored TIF in Fig. 15a). Yet, a comparison with Fig. 15b reveals that estimation accuracy is superior over a broader range with the original 4-category scale than it is with the 3-category scale.
It might be argued that poor estimation is caused by unnecessarily collapsing categories, given that crossings were ordered in all items. To assess whether the same effect occurs when crossings are originally disordered, we used parameters reported by van der Wal et al. (Reference van der Wal, Tuinebreijer, Bloemen, Verhaegen, Middelkoop and van Zuijlen2012) for an RRM calibration of a 10-category scale that rendered disordered crossings and for a subsequent recalibration after collapsing categories into a 5-category scale with ordered crossings. Categories had been collapsed exclusively on evidence of disordered crossings: Reportedly, none of the items showed misfit and the observed average trait estimates were also ordered across categories. The top panel of Fig. 16a shows centralized ORFs estimated from the original 10-category responses to the six items on the patient scale of the Patient and Observer Scar Assessment Scale (POSAS), whose parameters were listed in Table 5 of van der Wal et al. (Reference van der Wal, Tuinebreijer, Bloemen, Verhaegen, Middelkoop and van Zuijlen2012). The ORFs have disordered crossings but categories are ordered via
 ${{\rm{\bar \theta }}_k}$
; the bottom panel shows the corresponding TIF using item locations listed in Table 2 of van der Wal et al. (Reference van der Wal, Tuinebreijer, Bloemen, Verhaegen, Middelkoop and van Zuijlen2012). The top panel of Fig. 16b shows the ORFs upon recalibration after the original categories were collapsed as indicated in the inset, with parameters listed in Table 6 of van der Wal et al. (Reference van der Wal, Tuinebreijer, Bloemen, Verhaegen, Middelkoop and van Zuijlen2012); the bottom panel shows the resultant TIF for the same item locations as before.
Centralized option response functions and test information function for 10-category items described with the Rasch rating model (a) and after collapsing into 5 categories (b).

An obvious consequence of the structural features of divide-by-total models (and the RRM in particular) is that the ORF for each new category upon recalibration is nowhere close to the sum of the ORFs of the categories that had been collapsed: This would have left the ORFs of the original categories 1 and 10 intact, since neither of them was merged with any other. In contrast, the ORFs for these super-modal categories are much shallower and the ORFs for intermediate categories naturally cover broader ranges of θ with higher probabilities. Collapsing categories renders ordered crossings but also gives up valuable information: At its peak (i.e., at θ ≈ −0.5), the TIF for the 10-category scale was four times higher than the TIF for the 5-category scale is at the same point. This suggests sizeable reductions in the accuracy of trait estimates. Simulations like those reported in Fig. 15 rendered identical outcomes here: larger standard errors with the 5-category scale than with the 10-category scale.
An analogous analysis was conducted under the PCM with item parameters reported by Bee et al. (Reference Bee, Gibbons, Callaghan, Fraser and Lovell2016) for the Evaluating the Quality of User and Carer Involvement in Care Planning (EQUIP) scale. Development started with 61 5-category Likert-type items for which initial analyses revealed disordered crossings in 31 items. Along successive stages, the final scale was reduced to 14 items with ordered crossings: two with five categories and 12 with only four categories. We confirmed that, compared to the original 5-category scale in all 14 items, collapsing resulted in a reduction of the TIF that was not as large as that shown in Fig. 16 for the POSAS scale (due to the comparatively smaller curtailment here) but which was accompanied by a loss of precision of trait estimates. Presentation of these results is omitted.
It should also be stressed that expectations based on analyses of recalibration “after the fact” may not hold up when an instrument is administered with a reduced response scale (Jansen & Roskam, Reference Jansen, Roskam, Degreef and van Buggenhaut1984; Reference Jansen and Roskam1986; Roskam & Jansen, Reference Roskam and Jansen1989). A separate study using the reduced scale is needed to assess its validity (see Smith, Wakely, de Kruif, & Swartz, Reference Smith, Wakely, de Kruif and Swartz2003). But even if the presumed structure is confirmed in such study, trait estimation will always be less precise if the main (or the only) reason for collapsing categories was the presence of disordered crossings. In sum, disordered crossings do not hamper estimation of trait levels and the only demonstrable effects of collapsing categories to instate ordered crossings are a reduction of the TIF of the instrument and a loss of precision of trait estimates.
Discussion
Item category parameters, referred to as thresholds, have different referents in difference and in divide-by-total models. In difference models, they denote the boundaries of dichotomies between disjoint and exhaustive subsets of consecutive categories; in divide-by-total models, they denote instead the boundaries of dichotomies between pairs of consecutive categories. In consequence, thresholds in divide-by-total models are the points at which the ORFs for successive categories cross. ORF crossings also occur in difference models but they are not indicated by their category parameters. Similarly, thresholds for dichotomies between disjoint and exhaustive subsets of consecutive categories can also be defined post-hoc for divide-by-total models, and they do not coincide with the original crossing parameters.
This paper defined thresholds and crossings so that they have the same referents across models. Thus, thresholds (the item parameters in difference models and a post-hoc aspect of divide-by-total models) were defined to denote the boundaries of dichotomies between disjoint and exhaustive subsets of consecutive categories; crossings (the item parameters in divide-by-total models for ordered responses and a post-hoc aspect of difference models) were defined to denote the points at which the ORFs for consecutive categories cross. Models of both types were subsequently analyzed under these definitions, with results that are summarized in the next section. Subsequent sections discuss the causes and meanings of disordered crossings as well as practical implications for scale development.
Summary of results
Under our definitions, we first showed that thresholds are always ordered in difference and divide-by-total models whereas crossings may be inconsequentially ordered or disordered in both types of models. By construction, response categories under both types of models have a pre-assumed order that item parameters cannot contradict, an order that renders ordered thresholds whether crossings happen to be ordered or disordered. For this reason, a potential mismatch between the pre-assumed and the empirical order of categories can only be assessed by fitting a model that does not assume ordered categories (i.e., the NRM) but whose parameters can be interpreted in that context. Our analyses of empirical and simulated data nevertheless revealed that fitting the NRM with multilog renders a large proportion of items incorrectly purported to have disordered categories, something that reduces the utility of point estimates of NRM parameters to identifying disordered categories. We also showed that the occasional outcome of disordered threshold estimates under difference models is not indicative of disordered categories but the mere result of a glitch in the estimation algorithm when one or more intermediate categories have zero counts.
We also showed that the ORFs associated with models of one type can be very accurately reproduced by models of the other type with appropriate item parameters, which indicates that both types of models should be identically capable of accounting for a given data set. Although only tangentially related to our main goals, we also showed that divide-by-total models tend to produce estimated ORFs that result in a superior TIF and, hence, in the appearance of more accurate trait estimation. Simulation results nevertheless showed that this apparent superiority is an artifact (see also García-Pérez, Reference García-Pérez2014).
Finally, we showed that the presence of disordered crossings under either type of model does not hamper trait estimation, revealing that scales are well structured by their ordered thresholds irrespective of the resultant order of crossings. Thus, collapsing response categories to instate ordered crossings does not solve any problem and only results in a deterioration of the scale and an accompanying reduction in the accuracy of trait estimation.
Disordered crossings: A cause or a consequence?
The occurrence of disordered crossings upon fitting divide-by-total models to empirical data has spurred discussion about their origin and what they reveal about scale structure (e.g., Adams et al., Reference Adams, Wu and Wilson2012; Andrich, Reference Andrich, Smith and Smith2004; Reference Andrich2013a; Reference Andrichb; Wetzel & Carstensen, Reference Wetzel and Carstensen2014). Because the true reality generating empirical data is always unknown, disordered crossings are often regarded as a consequence of the data and the usual suspect is the presence of small counts in one or more categories (Adams et al., Reference Adams, Wu and Wilson2012). Andrich (Reference Andrich2013b) contended this view by showing via simulation that small counts do not necessarily render disordered estimates of crossings and also by showing that large counts can still render disordered estimates. In those simulations, data were generated for items whose true crossings were ordered or disordered as needed for each illustration and, then, large or small counts were indeed a consequence of the true reality generating the data. What those simulations show is that the true item parameters can be accurately recovered whether crossings are ordered or disordered in such reality, with large or small counts being a consequence of the true locations of crossings.
When a model fits empirical data well, it is admissible that parameter estimates reflect the unknown reality that generated the data. Hence, disordered crossings cannot be a consequence of any aspect of the data; rather, those aspects are a consequence of the underlying reality. As shown in Figs. 2, 4b, and 4c, disordered crossings occur when one or more of the intermediate categories are non-modal which, in turn, occurs when thresholds defined with respect to
 $p_k^*$
are tightly packed. Then, small proportions of counts (but not their absolute numbers) will occur whenever the threshold structure and the resultant crossings have these characteristics. Our results show that the characteristics of such structure does not affect the utility of the scale, as ordered or disordered crossings are inconsequential for trait estimation.
Disordered crossings do not indicate disordered categories
It is very common to regard disordered crossings as evidence that respondents misunderstand the response categories, that respondents cannot discriminate between categories, that respondents misinterpret categories in comparison to test developers, that respondents give inconsistent responses, or that the scale cannot order respondents according to their trait levels (e.g., Bell et al., Reference Bell, Low, Jackson, Dudgeon, Copolov and Singh1994; Clinton, Alayan, & El-Alti, Reference Clinton, Alayan and El-Alti2014; Gothwal et al., Reference Gothwal, Wright, Lamoureux and Pesudovs2011). Such statements are made even when the model fits the data well, which indeed says that disordered crossings are consistent with the model, as discussed next.
Consider the PRM, which is built on the assumption that the conditional probability C k of a response in category k (for 1 < k ≤ K) given that the response is in categories k − 1 or k is
 $${C_k}({\rm{\theta }}) = {{{p_k}({\rm{\theta }})} \over {{p_{k - 1}}({\rm{\theta }}) + {p_k}({\rm{\theta }})}} = {1 \over {1 + \exp ({{\rm{\tau }}_{k - 1}} - {\rm{\theta }})}}$$
.
This gives rise to the ORFs
 $${p_k}({\rm{\theta }}) = {{\exp \left[ {\sum\nolimits_{m = 1}^k {{\rm{(\theta }} - {{\rm{\tau }}_{m - 1}}{\rm{)}}} } \right]} \over {\sum\nolimits_{s = 1}^K {\exp \left[ {\sum\nolimits_{m = 1}^s {{\rm{(\theta }} - {{\rm{\tau }}_{m - 1}}{\rm{)}}} } \right]} }}$$
for 1 ≤ k ≤ K, where τ0 = θ and τ k (for 1 ≤ k ≤ K − 1) are the category parameters (crossings). The unconventional notation is only adaptation to the case of categories labeled from 1 to K instead of from 0 to K – 1 (see Muraki, Reference Muraki1992). It is important to realize that this derivation does not imply the restriction τ k ≤ τ k+1 and, hence, disordered crossings are compatible with the structure of the PRM. Moreover, a pre-assumed order of categories is implicit in the definition of the conditional probability functions in Eq. 7 (i.e., categories k – 1 and k are assumed to be ordered) and, hence, disordered crossings do not contradict the pre-assumed order. Claiming disordered categories at the encounter of empirically disordered crossings is thus incompatible with the PRM (or other divide-by-total models for ordered responses).
Using the arguments mentioned in the first paragraph of this section to explain away a good fit at the encounter of disordered crossings is not without problems. For instance, claiming that respondents cannot discriminate between two categories (and, then, guess at random between them) is an explicit statement that the conditional probability functions in Eq. 7 do not hold for some k and, instead, C k = P with 0 < P < 1. Constant conditional probability functions that are independent of θ deny the PRM and cannot be responsible for disordered crossings in an item that the PRM fits well.
The analysis of a sample case will be useful to illustrate misconstruction of the meaning of disordered crossings. Consider an item with K = 3 response categories (disagree, indifferent, and agree) on an issue on which not many members of the target population are indifferent. Empirical data may well indicate that the ORFs under the PRM are as shown in Fig. 17a, with disordered crossings that nevertheless seem perfectly reasonable: Category 1 is mainly endorsed by respondents with large negative θ, category 3 is mainly endorsed by respondents with large positive θ, and indifference (category 2) is only expressed by some respondents with θ around 0. This is the type of item on which Adams et al. (Reference Adams, Wu and Wilson2012) and Andrich (Reference Andrich2013b) contended about the interpretation of disordered crossings, and also the type of item used in the studies of González-Romá and Espejo (Reference González-Romá and Espejo2003) and Murray et al. (Reference Murray, Booth and Molenaar2016). The conditional probability functions of Eq. 7 for such item are as shown in Fig. 17b, with C 2 on the right of C 3 and giving the impression that “transiting” from category 1 to category 2 occurs at a higher θ than “transiting” from category 2 to category 3. This literal interpretation of the functions C k is unwarranted, not only because there is no such thing as a transit across categories but, more importantly, because it misses consideration of the magnitudes of p k (θ) in the numerator of Eq. 7 (i.e., the ORFs in Fig. 17a) and of p k−1(θ) + p k (θ) in the denominator (plotted in Fig. 17c). At θ = τ1 = 1.5, p 1(θ) = .045 (green curve in Fig. 17a) and p 2(θ) = .045 also (red curve in Fig. 17a). There is indeed a 50% chance of a response in category 2 relative to category 1, but their respective unconditional probabilities are only .045 so that, at this θ, the response is unlikely to be in categories 1 or 2 in the first place (the probability of a response in category 3 is actually .91); the literal interpretation becomes increasingly untenable when θ > τ1: p 1 and p 2 progressively decrease to nothing (green and red curves in Fig. 17a), although p 1 decreases faster than p 2 (which is why the function C 2 is monotone increasing). Matters are analogous at θ = τ2 = −1.5, where p 2(θ) = .045 (red curve in Fig. 17a) and p 3(θ) = .045 also (blue curve in Fig. 17a), again negligible values indicating that, at this θ, the response is highly unlikely to be in categories 2 or 3. Yet, as θ increases past τ2, category 3 does become increasingly more prevalent although for all θ ∈ [τ2, 0], category 1 is still modal. Thresholds as defined here (see Fig. 17d) are indeed ordered as categories were assumed to be.
(a) Option response functions p
k
under the polytomous Rasch model for an item with K = 3 categories and disordered category parameters given in the table on the right. (b) Conditional probability functions C
k
for responding in category k given that the response is in categories k − 1 or k. (c) Functions making up the denominators in the definition of the conditional probability functions C
k
. (d) Probability functions
 $p_k^*$
revealing ordered thresholds with the values given in the table on the right.

The compatibility of τ2 < τ1 in this item with the PRM and the pre-assumed order of categories is clear but how would the order of categories be if one were to interpret disordered crossings as indicating disordered categories? Which category is first, second, and third? Since the first τ is τ2 and, in turn, τ2 relates to the categories pre-assumed to be second and third, one would be forced to conclude that the pre-assumed second category is first and the pre-assumed third category is second, turning the pre-assumed order 1–2–3 into the “empirical” order 2–3–1. But then comes τ1, which relates to categories pre-assumed to be first and second and forces the conclusion that the pre-assumed second category follows the pre-assumed first category, which is incompatible with the “empirical” order 2–3–1.
Implications for scale development
The clearest implication of our results for scale development is that disordered crossings should not be considered as a criterion for removal of items or for the collapsing of response categories. With ordered or disordered crossings, response categories are always associated with distinct ranges of θ and expected item score increases monotonically with θ. There is also no reason to give up the discriminative information that each category provides. Even when some categories are used sparingly by the respondents, they can still make distinctions that matter to practitioners.
Of course, some of the initially developed items may need to be removed when short forms are sought. In such case, items with disordered crossings may be candidates for removal in favor of items with ordered crossings, but this is not because of the disorder but instead because ordered crossings ensure that all categories are modal (or super-modal) within some range, which in turn increases the item information function. Also in this respect, collapsing categories only reduces the item information function and, hence, deteriorates the instrument.
Another important implication of our analyses is that the NRM should be cautiously used to assess the empirical order of categories, particularly when the distribution of responses across categories is skewed. Items that produce such distributions are a must in any instrument that intends to estimate trait levels also at the upper and lower ends of the θ continuum, but those items are likely to be flagged by the NRM as having disordered categories. A way around this difficulty needs to be developed so that disorder of categories is not judged simply by the order of point estimates of the NRM α k parameters.
Supplementary Material
To view supplementary material for this article, please visit https://doi.org/10.1017/sjp.2017.11.
This work was supported by grant PSI2015-67162-P (Ministerio de Economía y Competitividad, Spain). Part of the computations was carried out on EOLO, the MECD- and MICINN-funded HPC of Climate Change at Moncloa Campus of International Excellence, Universidad Complutense. I thank Rainer Alexandrowicz and co-authors for providing the item parameters of the GHQ scale, which were only reported graphically in their paper. I also thank Penny Bee and co-authors for sharing the initial and final item parameters of the EQUIP scale.



