Legislative Speeches and Legislative Votes
Accurately estimating the policy preferences of individual legislators has long formed a key part of efforts to model intra-party politics. To date, the vast majority of work in this area has relied on inductive scaling of roll call votes, using either discriminant (Poole and Rosenthal Reference Poole and Rosenthal1997) or Bayesian statistical methods (Clinton, Jackman and Rivers Reference Clinton, Jackman and Rivers2004). Yet, roll call votes in parliamentary systems suffer from a number of problems that prevent them from forming a reliable basis for estimating legislators’ ideal points. In most settings, a significant proportion of legislative votes are not recorded, often for strategic reasons, while the votes that are singled out for roll calls may also be politically motivated, both resulting in selection bias (VanDoren Reference VanDoren1990; Carrubba et al. Reference Carrubba, Gabel, Murrah, Clough, Montgomery and Schambach2006; Carrubba, Gabel and Hug Reference Carrubba, Gabel and Hug2008; Hug Reference Hug2010). Perhaps more significantly, voting in most parliamentary systems is tightly controlled through party discipline, meaning that legislators vote with their party possibly not because of their policy preferences, but rather in spite of them (Laver, Benoit and Garry Reference Laver, Benoit and Garry2003; Proksch and Slapin Reference Proksch and Slapin2010).
What legislators say, however, is relatively unconstrained by comparison, and a growing subfield devoted to estimating legislator preferences using text as data has made good use of this information (e.g., Laver and Benoit Reference Laver and Benoit2002; Monroe and Maeda Reference Monroe and Maeda2004; Slapin and Proksch Reference Slapin and Proksch2010). Party leaders, it is believed, are less likely to punish legislators based on what they may say in a debate on a controversial bill, as long as they vote with the party line. This conventional wisdom regarding the less party strategic nature of legislative speech, however, has not gone unquestioned. Legislative speeches may also be prone to selection effects, as demonstrated by Proksch and Slapin (Reference Proksch and Slapin2012) who found that in the parliaments of the United Kingdom and Germany, the stronger the institutional incentives (electoral system, regime type, candidate selection) for party leaders to protect the party label, the less likely legislative speeches are to reflect true party cohesion as party leaders prevent potentially dissident backbenchers from taking the floor. This suggests that speeches may also underestimate the ideological differences within parties, especially if the electoral system is party centered, but this effect has yet to be explored in other contexts or in direct comparison with voting.
This paper directly compares the political positions estimated through roll call votes to those estimated through legislative speeches, using the example of an energy policy debate from the Swiss legislature in 2002–2003. Switzerland’s parliament forms an ideal case for comparing votes to speeches because all legislative speeches as well as complete sets of all votes taken during each floor debate are recorded.Footnote 1 As multiple votes are taken during the debate and passage of most bills, this provides multiple opportunities to observe votes during the debate over a single piece of legislation. In the energy debate, we have selected, for instance, there were 66 different legislative votes, in addition to 30 separate speakers. To compare the measurement of policy preferences using votes versus speeches, we use different combinations of scaling procedures for roll call votes and speeches, for example, one-dimensional item response theory (IRT)-based scaling on the roll call votes (using a logit-based likelihood) and a similar one-dimensional IRT-based scaling procedure on the speeches (using a Poisson-based likelihood). To investigate whether the selection of speakers is systematically related to political variables, we also test a model of speaker selection. Moreover, we test a model to predict text scaling positions using the nuclear policy preferences in legislators’ electoral districts, extracted from two federal nuclear policy referenda in Switzerland in 2003.
Our analysis confirms the widely held view that compared with the disciplined party voting that takes place in most parliamentary systems, the positions expressed in legislative speeches reveal larger heterogeneity in intra-party preferences. Spoken positions display a considerably larger range of preferences than those expressed through voting, particularly within parties with highly unified voting behavior. Furthermore, these divergences in observed behavior—votes versus speeches—vary systematically according to constituency-level electoral preferences. Legislators tend to vote with their parties but speak to their constituents.
Data: Swiss Nuclear Legislation 2002–2003
Our comparison of policy measures constructed from votes and speeches come from a key debate that occurred in the Swiss legislature of the future of its nuclear policy. Following the 1986 nuclear disaster at Chernobyl, the Swiss voters had approved a ten-year moratorium on new nuclear plants, but in the same vote rejected a full-scale nuclear phase out. After the expiration of the moratorium, the debates in 2002–2003 revisited the nuclear phase out question, focusing as well on national energy policy with respect to alternative forms of renewable energy. This followed a period during which many European countries debated a nuclear phase out, with Germany for instance deciding to phase out its nuclear reactors in 2000. In Switzerland, these decisions were made through parliamentary decision followed by referendums.
The Swiss Legislative Context
Switzerland’s legislative institutions meet three important conditions for the analysis of the differences between scaling results based on roll call votes and those based on texts. First, during most legislative debates, many votes are taken and all votes are recorded as roll calls, providing a large amount of voting data to estimate the positions of individual legislators. In the energy debate that we examine, we draw on 66 different roll call votes taken during the debate and passage of a major energy reform bill.
Second, the protracted debate also leaves a rich record of statements and speeches made by individual legislators, with every major party clearly setting out its position on the bill in the debates. Our analysis is based on 30 MPs from six parties, with an average speech length per MP of 2580 words.Footnote 2
Finally, the Swiss legislature is characterized by relatively weak party control over who speaks and what may be said. Swiss parliamentary rules and procedures provide for relatively strong individual and minority rights for MPs (Damgaard Reference Damgaard1995; Döring Reference Döring1995; Schwarz, Bächtiger and Lutz Reference Schwarz, Bächtiger and Lutz2011) as well as flat internal hierarchies. Formal and informal agenda-setting powers of the parliamentary elite (party leaders, most senior MPs like committee chairs, parliamentary presidents), which would lead to “incomplete” records of floor debates because of the control of legislative procedures by partisan actors (Proksch and Slapin Reference Proksch and Slapin2012), are in many ways curbed in the Swiss case. The rules of procedure in the Swiss parliament empower each MP to file petitions (amendments)Footnote 3 to any lawmaking proposal, leaving few mechanisms for party leaders to stifle or punish MPs who speak freely in a debate.Footnote 4 Furthermore, each petition ensures the submitting MP the right to present and defend it during the floor debate, and there is a vote on every petition. Every lawmaking project is therefore accompanied by detailed debates about disputed aspects with separate votes taken on each of these aspects, in addition to the compulsory votes on the entire lawmaking project (such as the final passage).
Rules and Procedures During Debates
Government bills undergo extensive debate in committees before reaching the floor. Committee decisions, however, do not bar opposing party groups or MPs from later filing petitions to rewrite specific parts of the bill (see also Schwarz, Bächtiger and Lutz Reference Schwarz, Bächtiger and Lutz2011). The usual procedure is as follows. First, committee majority speakers (rapporteurs) present a general introduction to the matter. Second, party group speakersFootnote 5 communicate the official party position to the proposed bill. Third, the government lays down its position. Next, a vote is taken as to whether the chamber shall refuse the bill from the outset or enter a detailed debate (article-by-article). If they decide to enter the debate, all disputed parts of the bill (where petitions have been filed in the run-up to the floor debate) are separately discussed with opinions given by the originator(s) of the petition, the committee rapporteur(s), party group speakers and the government. Having discussed and voted on all petitions, the chamber then takes an overall vote on the wording of the entire bill and refers it to the second chamber where the whole process starts anew. After resolving any disagreements on the wording of the bill (through the navette procedure), each chamber takes a final passage vote.
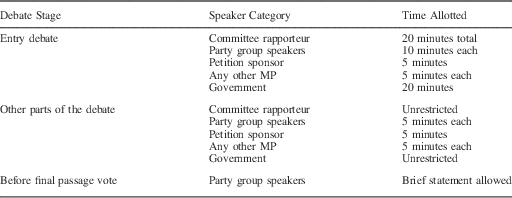
The rules of the Swiss National Council limit each MP’s speaking time. There are six debate categories ranging from “free debate” to “written procedure.”Footnote 6 The energy policy debate explored here was held under the category “free debate.”Footnote 7 Table 1 specifies how speaking time in free debates is assigned to MPs and parliamentary roles.
Allocation of Speaking Times in the Selected Energy Debate

The rules of procedure also determine who is entitled to speak. Compared with conventional parliamentary systems, the role of party leaders in controlling the selection of speakers is relatively weak. The role of the party group speaker is usually assigned to MPs who are members of the related committee (but committee members are not party speakers by default). Moreover, as any MP is entitled to file any petition to rewrite specific sections of a lawmaking proposal, which then allows her to present and defend it on the floor, party leader control over who speaks is limited to informal methods (e.g., internal appeals to preserve the party brand and apply self-constraint, or exerting peer pressure, see Cox and McCubbins (Reference Cox and McCubbins1993); Owens (Reference Owens2006)).Footnote 8 We explore the question of systematic selection of speakers below, but first we briefly describe the main features of the energy policy debate and outline our data analysis procedure to measure policy preferences of Swiss legislators from both the votes and speeches.
The Energy Policy Debate of 2002–2003
Our analysis in this paper focuses on a piece of legislation central to Switzerland’s energy policy. The debate took place between June 20, 2002 and 21 March 21, 2003 within the 46th legislature convened from 1999 to 2003.Footnote 9 The legislation concerned several much-debated and long-standing issues of energy policy: whether to phase out nuclear power, as well as strategies to increase the share of renewable energies.Footnote 10 In the aftermath of the 1986 Chernobyl disaster, the Swiss voters had approved a ten-year moratorium on new nuclear plants, but in the same vote had rejected a full phase out of nuclear power. The 2002–2003 debate we analyze covers two popular initiatives almost identical to those of 1990: the first demanding a renewal of the 1990 ban and the second again aiming at a nuclear phase out. The Swiss government disagreed with both but drafted a new Federal Act on Nuclear Energy, which was debated in parliament together with the two initiatives. This law was designed as a counter-proposal to the anti-nuclear initiatives, which would automatically take effect if the initiatives were to be rejected. The government’s draft took some of the initiatives’ concerns into account while at the same time neglecting their main points (ban and/or phase out). It provided for tougher rules for the construction permit of new plants and the recycling of nuclear materials, as well as an energy tax to promote renewable energies. The sometimes quite heated debates pitted environmental interests, led by the Greens (GPS) and the Social-democrats (SP), against the economic concerns emphasized by a majority of Christian-democrats (CVP), the Liberal Free Democrats (FDP) and the national-conservative Swiss People’s Party (SVP). During these debates, 66 votes were taken in the National Council.Footnote 11 In May 2003, two months after the final passage vote in parliament, a popular vote on the two initiatives took place. The Swiss electorate’s rejection of the initiatives paved the way for the rather nuclear-friendly federal act to come into force.
In the speeches made during the various stages of the debate, all political parties were represented. Our analysis is based on 275 speeches made by 30 legislators (median length 2000 words, mean 2580 words).
Measuring Legislator Positions from Roll Call Votes
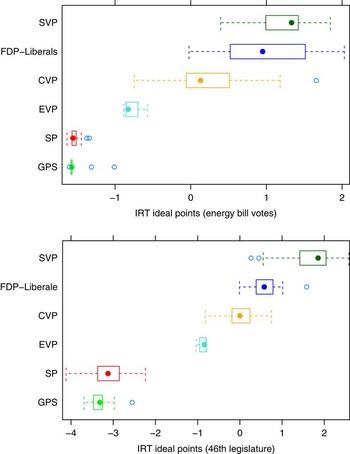
We begin by scaling the one-dimensional positions of MPs in the energy debate using IRT-based roll call vote analysis. We selected the 66 votes held during the energy legislation, as well as the entire set of 3194 votes from the 46th legislative period as a baseline. In the one-dimensional representation of ideal points,Footnote 12 the line-up of all parties represents their expected order and is quite similar to the full picture of the 46th legislative period, as depicted in Figure 1.Footnote 13 In both models, the SP (red) and the GPS form the left (i.e., environmentalist, anti-nuclear) position, the CVP (orange) occupy the center, while the FDP-Liberals (blue) and the SVP (dark green) take center-right to right-end positions on the scale. The position of the small Protestant People’s Party (turquoise) is located between the two main camps.
Box plots of MP one-dimensional ideal points from roll call votes (energy bill and entire 46th legislature, grouped by party) Note: SVP=Swiss People’s Party; FDP=Liberal Free Democrats; CVP=Christian-democrats; EVP=Protestant People’s Party; SP=Social-democrats; GPS=Greens; IRT=item response theory.

The results of the two IRT models are highly correlated (Pearson’s r=0.95). The model for the single debate differs in two respects compared with the entire legislature, however: we find considerably smaller intra-party variation among the left and a more blended picture among the parties to the right. These differences reflect the fact that party unity is above average on energy-related votes in the (already highly united) left camp while it is below average for CVP, FDP-Liberals and SVP (Schwarz Reference Schwarz2009). While the attitude of all MPs in both left parties is firmly anti-nuclear, there are well-known outliers in all political directions (nuclear hardliners and MPs with moderately anti-nuclear positions) within the bourgeois parties.
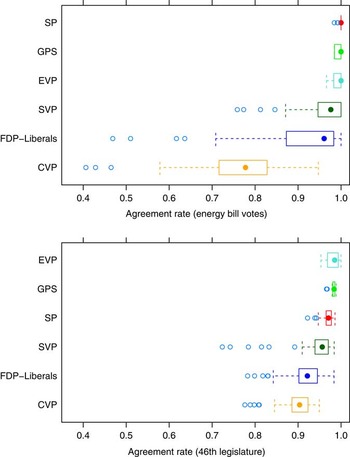
The distributions of MP ideal points in the energy bill votes according to Figure 1 suggest that the relatively homogeneous left camp (GPS and SP) faces a far less united bourgeois camp on the center-right. But how often do MPs actually vote in accordance or against the majority of their party? The box plots in Figure 2 visualize the distribution of MP agreement rates by party.Footnote 14 As expected, we find the lowest agreement average and the highest dispersion of MP agreement with a considerable number of outliers within the two center-right parties (CVP, FDP-Liberals), but also the more extreme right SVP has a number of outliers within their ranks. Moreover, the agreement rates particularly for the CVP and the FDP-Liberals are somewhat lower in the selected energy case than in the entire 46th legislature, while we find the opposite picture for the two parties on the left. This fits well to the ideal point estimations in Figure 1.
Box plots of MP agreement with own party (energy bill votes and entire 46th legislature) Note: EVP=Protestant People’s Party; SP=Social-democrats; GPS=Greens; SVP=Swiss People’s Party; FDP=Liberal Free Democrats; CVP=Christian-democrats.

All in all, the distribution of the roll-call votes (RCV) ideal point estimates and the agreement rates point to the relatively low capabilities among center-right parties to enforce party discipline (weakly restricted voting behavior) while party unity among the SP and the GPS is very high.
Measuring Legislator Positions from Speeches
What Determines Who Speaks?
Roll call vote analysis to estimate ideal points is often criticized because the selection of observable votes is politically determined, thereby producing downward-biased estimates of intra-party heterogeneity (Carrubba et al. Reference Carrubba, Gabel, Murrah, Clough, Montgomery and Schambach2006). Recent research has centered on a similar discussion with regard to selection effects in parliamentary speeches, suggesting that bias in speaker selection as well as the content of speeches varies with the institutional context (Proksch and Slapin Reference Proksch and Slapin2012). Proksch and Slapin’s (Reference Proksch and Slapin2012) argument is based on a well-established view that parliamentary rules and legislative behavior are endogenous to electoral competition (e.g., Mayhew Reference Mayhew1974; Hix Reference Hix2004; Carey Reference Carey2007). Thus, in political systems that foster an individual relationship between MPs and their voters, party leaders are more likely to accept speeches that deviate from the party line. By contrast, in contexts where these relations are mediated by the party, and party unity matters, the party leadership is likely to prohibit expression of dissent on the parliamentary floor. Proksch and Slapin (Reference Proksch and Slapin2012) argue that due to these constraints, the scaling of speeches in these political contexts encounters problems that are similar to those found in the analysis of roll call votes.
The rules in the Swiss parliament are only minimally restrictive, reflecting the strong component of “individual accountability” (Carey Reference Carey2009) in the Swiss political system (Traber, Hug and Sciarini Reference Traber, Hug and Sciarini2014). Compared with other parliamentary systems with a proportional representation electoral system, party leaders in the Swiss parliament have little formal means to control their backbenchers. If an MP is unhappy with her party’s majority position and would like to make her disagreement public, she can file a personal petition to change the unwanted part of the proposed bill, and she will be granted five minutes to defend her view on the floor. We thus argue that contrary to other parliaments, not only is the selection of speakers in the Swiss parliament less biased, but also that the speakers are less constrained in their statements if they diverge from the party line.
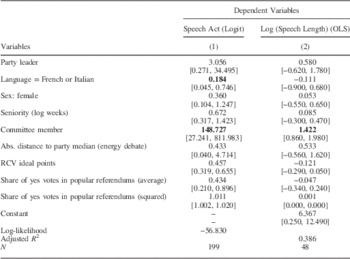
We estimated two types of models to detect possible selection bias in legislative speeches. The results are shown in Table 2. The first model is a logistic regression model that tests whether certain MPs have higher probability to speak based on a number of individual characteristics, such as language, role within the party and policy position (ideal points). Besides the general policy position, measured on the basis of all votes in one legislative period,Footnote 15 we included the distance between the MPs’ ideal points in the energy debate and the party’s policy median in this debate. The model also takes account of constituency preferences on the energy debate, represented by the average share of yes votes in the popular vote on the nuclear moratorium referendum from May 2003. We model a quadratic relationship, because MPs from cantons where the share of yes votes was especially high or especially low might be more likely to speak than MPs from cantons where the population was more polarized.Footnote 16
Models to Predict Speech Act and Speech Length

Note: the models were estimated using the Zelig package (Imai, King and Lau 2007). Model 1 includes all MPs and predict who speaks, using odds ratios and corresponding 95 percent confidence intervals, with any rejecting the null hypothesis with p≤0.05 highlighted in bold type. Model 2 predicts MP’s speech length as the log of number of words spoken during one debate and include only MPs who spoke during the respective debate, showing ordinary least squares (OLS) coefficients and corresponding 95 percent confidence intervals, with any p≤0.05 in bold.
The second, linear, model includes the same variables to test whether the length of an MP’s speech is determined by these characteristics. The most important result in Table 2 is that committee members appear to speak more often and much longer than their fellow MPs. Apart from committee membership, however, none of the other MP attributes consistently determines legislative speech. Apparently, leftist MPs are more likely to speak than MPs on the right side of the policy spectrum in this debate, but we find no evidence that party leaders and party group leaders speak systematically more often than backbenchers.Footnote 17 What is more, there seems to be no restrictions for MPs with positions that are distant from the party’s policy median.
In sum, Swiss MPs participate in debates according to their interests and without significant institutional constraints, and not in a way relating to a specific role within the party. We therefore do not expect our measures to be affected by selection bias from the censorship of speakers by party leaders based on the positions they might have expressed, as measured by whether or how long they speak.
Text Scaling Estimates
To scale MP positions using their speeches, we fit the Poisson scaling model of Slapin and Proksch (Reference Slapin and Proksch2008), which estimates the position θ i of each text i on a single latent dimension. This model has been applied to parliamentary speeches to estimate MP positions in other parliaments, such as pro- and anti-EU positioning in the European Parliament (Proksch and Slapin Reference Proksch and Slapin2010) and to preferences for austerity in Irish budget speeches (Benoit and Lowe Reference Benoit and Lowe2013). The advantage of the Poisson scaling method is that, as an unsupervised method, it requires no “training” step or identification of known positions. Furthermore, its method closely matches that of the one-dimensional IRT model, and can be viewed itself as a one-dimensional IRT model for count data (Lowe Reference Lowe2008).Footnote 18
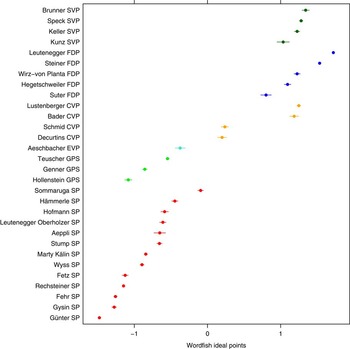
The Poisson scaling results for the energy debate are shown in Figure 3. The plot shows party groupings that are quite similar to those in the previous roll call analysis in the Measuring Legislator Positions from Roll Call Votes section. There are also significant intra-party differences, but in contrast to previous roll call analysis they do not only occur within the center and center-right parties, but also within the parties on the left. This hints at intra-party differences in preferences which are not revealed in roll call votes.
Text scaling results (Wordfish) for energy debates, grouped by party Note: EVP=Protestant People’s Party; SVP=Swiss People’s Party; FDP=Liberal Free Democrats; CVP=Christian-democrats; GPS=Greens; SP=Social-democrats.

Comparing Vote Scaling to Text Scaling
Our expectation is that the political censorship affecting roll call votes—a well-known result attributed to both party discipline in parliamentary voting and RCV selection bias (Carrubba et al. Reference Carrubba, Gabel, Murrah, Clough, Montgomery and Schambach2006)—will make the scaled positions from roll call votes significantly less heterogenous than corresponding estimates from text scaling. What ultimately matters is how legislators vote, rather than what they say, and party leaders may consider it within each legislator’s prerogative to speak against a party’s official position, as long as they support it with their votes.
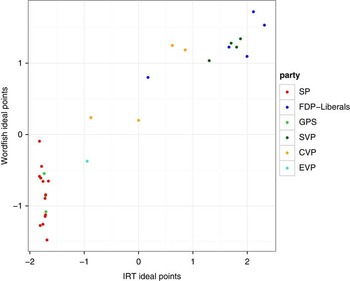
To compare positions from the two measures, we plot the text scaling results against the roll call vote positional estimates. Figure 4 compares IRT-based RCV scalings with the text scaling results from the Poisson IRT-type model.Footnote 19 The results show an interesting contrast that is not entirely in accord with our expectations, probably due to a relative lack of party discipline in voting in the Swiss system. We see different patterns for the center-right and rightist parties (CVP, FDP-Liberals and SVP) on the one hand and the left parties (SP and GPS) on the other hand. While the compared estimates for the bourgeois parties are located around an imaginary diagonal line, the comparison shows for the left camp positional homogeneity along the x-axis (as is to be expected according to the results in Measuring Legislator Positions from Roll Call Votes section) but heterogeneity along the y-axis. This suggests that where party discipline is relatively low and thus MPs relatively unconstrained in their voting behavior roll call analysis and text analysis produce quite similar results. Where party unity is strong and voting behavior constrained, as within the SP and GPS,Footnote 20 text analysis picks up differences which are not detected through votes.
RCV scaling (IRT) versus text scaling (Wordfish) Note: Pearson’s r=0.94. IRT=item response theory; SP=Social-democrats; FDP=Liberal Free Democrats; GPS=Greens; SVP=Swiss People’s Party; CVP=Christian-democrats; EVP=Protestant People’s Party.

However, the intra-party differences revealed through text analysis do not constitute a major shake-up of left positions. Most notably, and very important for the substantive plausibility of the results, despite higher variation within the left parties, the text scaling results clearly separate the anti-nuclear and pro-nuclear MPs. Thus, the text analysis results do not claim that the intra-party difference found within left parties would reveal hidden sympathies for nuclear energy which would have been highly implausible given the credible engagement of virtually all MPs to the left in favor of the two initiatives during the later referendum campaign. The text scalings point to more subtle differences among left MPs, probably rooted in the type of arguments brought forward and the way the arguments are presented: left MPs in opposition to nuclear energy, but who pick up the technical and economic vocabulary of the advocates of nuclear energy may receive text scaling positions slightly closer to the pro-nuclear camp.
Thus far, our results match our expectations well, clearly showing less party discipline in speechmaking than observed through voting. A further test of how speech differs from the party line will be to see if we can explain the gap between spoken positions and positions from voting as the result of political variables specific to each speaker, rather than methodological artifacts stemming from different data structures and estimation methods.
Explaining Text Scaling Positions
The energy debate linked together a new federal act and two anti-nuclear popular initiatives. The results of these referendums provide valuable information about voter preferences, both in general and on the level of MPs’ electoral districts (cantons).
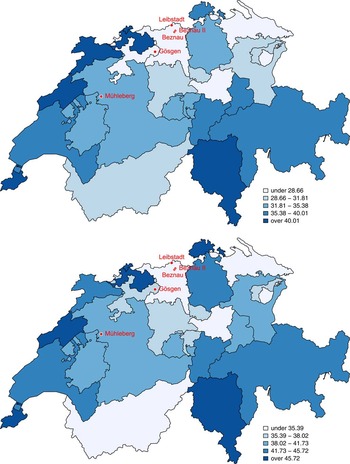
Both popular initiatives against nuclear energy—the initiative for nuclear phase out and the initiative for a ten-year ban on new nuclear plants—were rejected by the Swiss voters on May 18, 2003. However, from a regional perspective the rejection was not unequivocal: the city canton of Basel-Stadt embraced both initiatives by a substantial margin, and in surrounding Basel-Landschaft the moratorium initiative also received a majority. Moreover, there was substantial variation in the results between cantons. Figure 5 plots the variation by canton in support for both referendum measures. In the case of the phase out initiative, for example, the share of support varied from 23 percent in the distinctive pro-nuclear canton of AargauFootnote 21 and 52 percent in the most skeptical canton of Basel-Stadt.
Regional variation in support for (a) nuclear phase out and (b) the moratorium initiatives of May 18, 2003, and the locations of Switzerland’s five active nuclear reactors

The regional variation followed two main patterns. First, previous referendum results have shown that people living in rural areas as well as those in the French-speaking (western) part of Switzerland are less likely to share “green” positions. However, the maps in Figure 5 do not reveal a clear-cut picture which would satisfyingly explain the referendum results of 2003 (regarding contrasts between urban and rural areas, the depicted regional entities are also too wide-meshed to draw valid conclusions). Furthermore, as our analysis only includes speeches in German language, we are not in a position to test the effect of language-related cultural variables.
A second pattern combines personal concerns and financial federalism. People living in the wider area around the five nuclear plants share more or less the same risks, but for those living in the cantons where the nuclear plants are located, the risks are somewhat outweighed by corporate tax revenues of the power plant operators and the income tax revenues of the highly qualified staff working in these sites.Footnote 22 Furthermore, the personal concern aspect extends to two French nuclear sites close to the Swiss border. The Fessenheim plant is most proximate to the cantons of Basel-Stadt, Basel-Landschaft and Jura (but also to nuclear-friendly canton of Aargau), and until the mid-1990s there were seven French nuclear reactors near Geneva.Footnote 23
Thus, our theoretical expectation is that the signals MPs send in their speeches to their constituents follow the variation in regional concern (both in terms of health risks and unequal share of economic benefits): MPs from nuclear-friendly cantons and those from nuclear-skeptical cantons adapt their speeches accordingly (even if sometimes in a very subtle way).
Moreover, the post-referendum survey among voters (the so-called VOX analysis, see Blaser et al. Reference Blaser, van der Heiden, Mahnig and Milic2003) with regard to the two energy-related popular initiatives found significant effects of a voter’s age (younger voters) and sex (females) on approval of the two initiatives (apart from obvious variables like political affiliations, e.g., left-wing voters who sympathized with GPS or SP were heavily in favor of the initiatives).
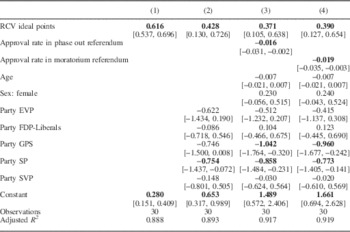
Consequently, we tested the explanatory power of the constituency preference measure (share of approval in the anti-nuclear referenda) for the text analysis results with a couple of linear regression models. Additional independent variables were: roll call vote estimates for the energy debate, party fixed effects (reference category is centrist CVP), MPs’ age and sex.
Table 3 contains two reduced models (without constituency measures) and two full models including the district-level measures (approval rates in phase out and moratorium referenda). The results confirm the theoretical expectations: in every model the effect of district preference on the text scalings is significant at 0.05 level or better.Footnote 24 The higher the support for the initiatives, the more to the left is the MP position in the text scaling. This is strong evidence that individual MPs were speaking to their constituencies, yet voting with their party. Even when controlling for party effects, legislators from constituencies more (or less) supportive of the phase out and the moratorium adapted their speeches accordingly, regardless of their party’s majority position that guided the legislator’s vote.Footnote 25
Ordinary Least Squares (OLS) Regression Models to Predict Text Scalings (Wordfish)

Note: the models were estimated using the lm function in R. The models predict MP text scaling positions (Wordfish), showing OLS coefficients and corresponding 95 percent confidence intervals, with any p<0.05 in bold.
EVP=Protestant People’s Party; FDP=Liberal Free Democrats; GPS=Greens; SP=Social-democrats; SVP=Swiss People’s Party.
Discussion
The direct comparison of roll call votes and speeches requires an institutional setting where MPs can express their preferences on a specific topic relatively unconstrained both in multiple votes and in speeches. Switzerland’s legislature comes quite close to this ideal: the debate explored in our analysis involved 66 roll call votes, and we could show that there was relatively unbiased MP access to the microphone.
Our analysis of legislative speeches made during the crucial Swiss energy debate in 2002–2003 has shown that significant differences exist between estimates from roll call votes and estimates from texts. The estimates from roll call votes display some heterogeneity within party, but their most distinctive feature is a relative similarity between legislators of the same party, particularly among the highly united left. Far more heterogeneity, by contrast, appears in positions taken in legislative speeches during the debates. The results strongly support the hypothesis that MPs are less constrained in speeches than in votes.
Not only are preferences measured from legislative speech more heterogeneous than preferences measured from votes, but also this variation is neither random nor based on methodological artifacts (binary roll calls on the one hand and large word frequency tables on the other). Our analysis found that the vote shares at the district level in an energy policy referendum closely linked with the investigated energy debate are significantly related to how legislators spoke about the proposed bill during the parliamentary debates. The higher the anti-nuclear vote in the electoral constituency, the more anti-nuclear are the positions as measured by text scalings. This result reinforces our explanation of the observed differences found between roll call and text analysis, demonstrating that these differences may be explained by different levels of incentives on individual legislators who must balance party versus constituency concerns. MPs tended to adapt their speeches to constituencies, even when voting with their party’s official position on the bill.
We have established that speech is more varied and less amenable to disciplinary actions by party leaders than votes, which tend largely on party lines even in less strongly whipped systems such as Switzerland. We have also shown that speeches made in parliament tend to be aimed at constituents based on political preferences specific to an MP’s electoral district. The question remains whether these findings are generalizable to other countries. In this regard, two restrictions apply. First, our results are based on an in-depth study of a single debate. The selected energy policy debate still constitutes an important and very contentious piece of legislation in Switzerland. Results are expected to be different if less prominent or non-controversial examples are investigated. Second, whether the results are generalizable to other countries depend on the specific institutional setting, particularly regarding the degree of party discipline in votes and party control over speeches. We expect similar results in countries with weak party control over speeches and (relatively) high party discipline in roll calls.
Future research should focus on the difference between legislative voting and expressed positions through speech in systems with greater party discipline, or where speakers themselves may be censored as an extension of party discipline. Our analysis here, however, is a promising indication that the political speeches of MPs target a different audience than their votes, and that richer information about intra-party policy preferences can be found in the words that legislators use than in the votes they cast.
Appendix: Data Details
Regarding the institutional roles of some speakers, we first excluded all speeches from parliamentary presidents because their speeches are always purely procedural. For instance, the president of a parliamentary chamber plays a non-partisan role in Switzerland, and does not speak in debates or vote, except to break ties. This restriction included cutting 11 speeches from the parliamentary vice-president. We also eliminated all 42 speeches of the members of government. Government members (Federal Councilors) are not MPs; they neither vote nor do their speeches purely represent the interest of their respective parties as the government is organized as a collegial body. Finally, we also excluded 66 speeches from committee rapporteurs, because these speakers are charged with expressing the committee majority position, which is not necessarily their own, but rather aimed at presenting a balanced assessment of the committee debates and the reasoning that stands behind some of the most important decisions.
Apart from the exclusion of parliamentary presidents, committee rapporteurs and government members, we further eliminated 20 purely procedural speeches, such as when an MP asks for the adjournment of the debate, or when a speaker issues short instructions, as well as 36 spontaneous interactions among MPs.Footnote 26
The Swiss parliament is a multilingual body. Most MPs speak German or French, some Italian (and in specific situations like inaugural addresses of newly elected government members or in debates on cultural subjects, some speeches may in parts be even in Rhaeto-Romanic language). Unlike the European Parliament (Proksch and Slapin Reference Proksch and Slapin2010), there is no official translation of the speeches. Thus, there remain two research options: to translate the speeches (preferably automatically using systems like Google Translate, see Benoit, Schwarz and Traber Reference Benoit, Schwarz and Traber2012) or to start with language-specific scalings. We employed the second option, restricting our analysis to the texts in German language. In doing so, we excluded five French-speaking MPs from our analysis.
Finally, we removed all MPs from the analysis whose concatenated texts were shorter than 500 words (which is about one letter-size page of German text). The 500-word threshold is purely empirically defined, based on the fact that text scalings with all three methods we employed (Wordscores, Wordfish and correspondence analysis) tended to produce implausible results for less talkative MPs.