Introduction
Governments since 2010 have made substantial reforms to the tax and social security system in the United Kingdom. This article uses microsimulation modelling to highlight the distributional impacts of the reforms announced from the June 2010 Budget through to the end of 2017. The results are examined by household income decile and according to Equality Act protected characteristics (such as gender, ethnicity and disability). The modelling which produced these results was undertaken by Portes and Reed (Reference Portes and Reed2018) for the Equality and Human Rights Commission [EHRC], to highlight where improvements are required to policy, systems and practices, to understand and alleviate disproportionate impacts on protected groups, and to consider how these reforms impacted inequality.
This article takes a cumulative approach to looking at the impact of tax and social security reforms rather than focusing on individual reforms in isolation because the overall pattern of distributional impacts is the result of the interaction between a large number of specific reforms undertaken by the UK Government since 2010. Many existing studies of the impact of reforms look at just one reform, or one type of reform (e.g. taxes or social security changes in isolation). But for a comprehensive evaluation of the impacts of all policies taken together, a cumulative impact assessment is required.
Methodology
Microsimulation modelling
The analysis in this article uses the ‘tax-transfer model’ (TTM) which was originally developed in 2008-09 by Landman Economics for the Institute for Public Policy Research (IPPR). The TTM is a tax-benefit microsimulation model which uses survey data on UK household incomes and expenditure to model the distributional effects of reforms. Its functionality is similar to other tax-benefit microsimulation models such as Euromod, the Institute for Fiscal Studies’ TAXBEN model, and HM Treasuryʼs distributional model.Footnote 1 All have been used to model the distributional impacts of recent policy changes by household income (see for example De Agostini et al., Reference De Agostini, Hills and Sutherland2018; Hood and Waters, Reference Hood and Waters2017; HM Treasury, 2015a, 2015b, 2017). However, distributional assessments of recent UK policy changes by Equality Act protected characteristics are less common, although Reed and Portes (Reference Reed and Portes2014) used an earlier version of the TTM to look at the distributional impacts of tax and welfare reforms under the 2010-15 Coalition Government.
Broadly speaking, the following parts of the taxation and benefits system are modelled:
Income tax
National Insurance Contributions (NICs)
Council Tax
Indirect taxes (for example, VAT; excise duties; Insurance Premium Tax)
Means-tested and non-means-tested benefits
Tax credits
Universal Credit (UC), which is in the process of being rolled out to all families in the UK, replacing tax credits and most means-tested benefits.
The TTM also models specific reforms introduced by the devolved administrations in Scotland and Wales.
The analysis also includes the National Living Wage (NLW), introduced in 2015 and uprated every April after. The NLW consists of an above-inflation increase in the minimum wage for employees aged twenty-five and over. By April 2019 it stood at £8.21, and the UK Governmentʼs stated intention is that the NLW should rise to 60 per cent of median earnings by 2020 (Low Pay Commission, 2017).Footnote 2
Data sources
The model uses data from two sources. The main source is the Family Resources Survey (FRS), an annual cross-sectional survey of around 20,000 households per year in the UK, collected on a tax-year basis (UK Data Archive, 2017). The FRS is widely acknowledged as the best source on individual, family and household gross incomes and disposable incomes (incomes after payment of direct taxes and transfer payments) in the UK. Information on individual, family and household attributes makes it suitable for modelling changes in taxes and transfer payments in response to policy reforms.
The model also uses data from the Living Costs and Food Survey (LCF), an annual cross-sectional survey of households. Alongside individual, family and household income the survey includes expenditure on goods and services at the household level. The main drawback of the LCF compared with the FRS is that the sample size is smaller, at around 5,000 households per year (Bulman, Reference Bulman2017).
To increase the available sample sizes the analysis pools data from several consecutive years of FRS and LCF data. It uses four consecutive years of FRS data (2012–13, 2013–14, 2014–15 and 2015–16) and six consecutive years of LCF data (2010 through to 2015–16 inclusive). This provides a total of 71,536 households in the pooled FRS sample and 30,792 households in the pooled LCF sample.
Policies included in the distributional modelling
The analysis includes the impact of all tax, benefit, tax credit and UC policies that the TTM is able to simulate or approximate with a reasonable degree of accuracy. In practice, reforms fall into three broad categories:
(i) The majority of reforms are included with high accuracy, including:
○ the income tax and NIC systems
○ most parts of the benefit system
○ most parts of the tax credit system
○ most parts of UC.
(ii) Data availability issues mean that some aspects of the tax and social security reforms can be modelled, but with lower accuracy. The main examples are:
○ Council Tax and the Council Tax Benefit system (replaced by Council Tax Support when the system was localised in April 2013) where local authority location, and associated liabilities, are approximated.
○ Local Housing Allowance for Housing Benefit claimants in the private rented sector which are estimated based on regional information.
○ Assessments for disability-related benefits such as Employment and Support Allowance (ESA) and the Personal Independence Payment. Entitlements have been estimated as there is not enough information to enable a fully accurate simulation. The results will be at best an approximation.
(iii) Finally, some aspects of the changes to benefits, tax credits and UC systems cannot be included in the impact assessment because neither the FRS or LCF contain the required information. The main examples of this are:
○ Changes to rules regarding the income thresholds for repayment of tax credits.
○ Increases to the number of ‘waiting days’ before benefits and tax credits are paid.
○ Sanctions for claimants of Job Seekers Allowance (JSA), ESA and UC.
Overall, a comparison of the TTMʼs modelling capacity with the Office of Budget Responsibilities policy measure database (OBR, 2016, 2019) shows that the analysis captures over 90 per cent of reforms to the benefits, tax credits and UC systems since 2010 to a high or partial standard of accuracy.
Partial take-up of benefits and credits
Not everyone who is eligible for means-tested benefits (such as income-based JSA and HB) claims these transfer payments. For means-tested benefits and tax credits, take-up estimates from the Department of Work and Pensions (DWP, 2017) and HMRC (2017) are used to provide realistic take-up assumptions. For UC take-up figures have been modelled based on whether the benefit claimant was assumed to claim any of the benefits or tax credits which are being replaced by UC. In general the analysis assumes higher UC take-up because, if someone is claiming one component of the previous benefit and tax credit system but not another part (for example, HB but not tax credits) when UC is introduced, the claimant will automatically claim both components.
Universal Credit roll-out and transitional protection
UC is being rolled out to new claimants and existing claimants (via a process known as ‘managed migration’) over a number of years, with estimates suggesting that UC will not be fully phased in for all claimants until 2023 (Kennedy and Keen, Reference Kennedy and Keen2018). To simplify the modelling, the analysis assumes that UC is fully rolled out by 2021/22. We also ignore transitional protection for claimants who would otherwise lose out in cash terms when they are transferred from legacy benefits and tax credits to UC. This is difficult to model accurately given potential changes in circumstances for claimants between the point of migration to the benefit and their eventual UC payment in 2021/22.
Choice of baseline scenario and impact year
The reforms to taxes and transfer payments modelled using the TTM are assessed against a baseline ‘business-as-usual’ scenario. This assessment involves taking the final tax-transfer system before the May 2010 general election (that is, the system for the 2010/11 tax year) and uprating that system using the default rules in place for the previous Parliament. In practice, this means that:
For the 2010–15 Parliament, the baseline scenario involves uprating means-tested benefits by the Rossi index, which excludes housing costs and tax thresholds, non-means-tested benefits, and tax credits by the Retail Price Index.
For the 2015–17 and subsequent Parliament, the baseline scenario involves uprating the State Pension by the ‘triple lock’ (the maximum of average earnings, the Consumer Price Index (CPI), or 2.5 per cent) and almost all other benefits, tax credits, UC and tax thresholds by the CPI.
The results presented in this report use the 2021/22 tax year to assess the cumulative impact of changes to taxes and transfer payments. By then it is assumed that all changes to the system announced since 2010 should be fully implemented (with the exception of future increases to the state pension age planned for during the 2020s).
Results
Impact by position in the household income distribution
First, this article looks at the impact of reforms according to where each household sits in the income distribution. Households in datasets are ranked from poorest to richest in terms of disposable income (adjusting for family size). The (weighted)Footnote 3 data are then divided into ten equally sized groups or ‘deciles’, with the poorest 10 per cent of families in decile 1, the next 10 per cent in decile 2, and so on to the richest 10 per cent in decile 10.
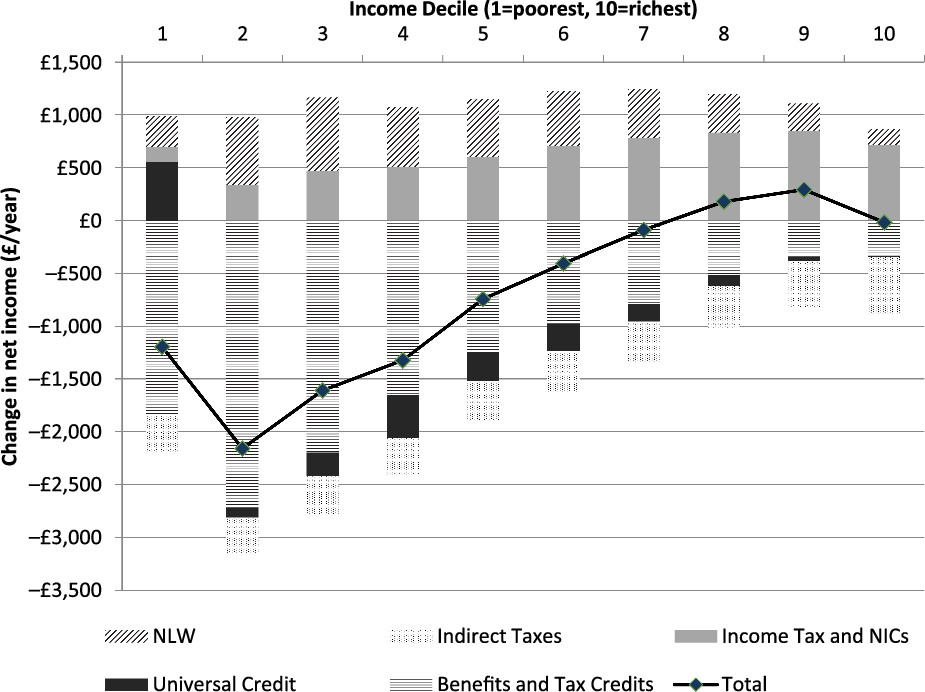
Figure 1 shows the cumulative distributional impact of all modelled reforms since 2010 to taxes, benefits, tax credits and UC by household net income decile, modelled for the 2021/22 tax year. The analysis uses LCF data to calculate the impact of changes in indirect taxes and FRS data to calculate the impact of all other changes. The figure is a stacked bar chart with different shades showing the impact of reforms to different aspect of taxes, transfer payments, and policies affecting gross incomes. The black line shows the total impact of these changes and is the sum of the stacked bars. The cash terms results in this article are annualised changes in non-equivalised household incomes estimated at 2021/22 price levels, except for Figure 6, which shows individual incomes.
Cash impact of reforms to taxes and transfer payments by household net income decile, 2021/22 tax year: Great Britain.
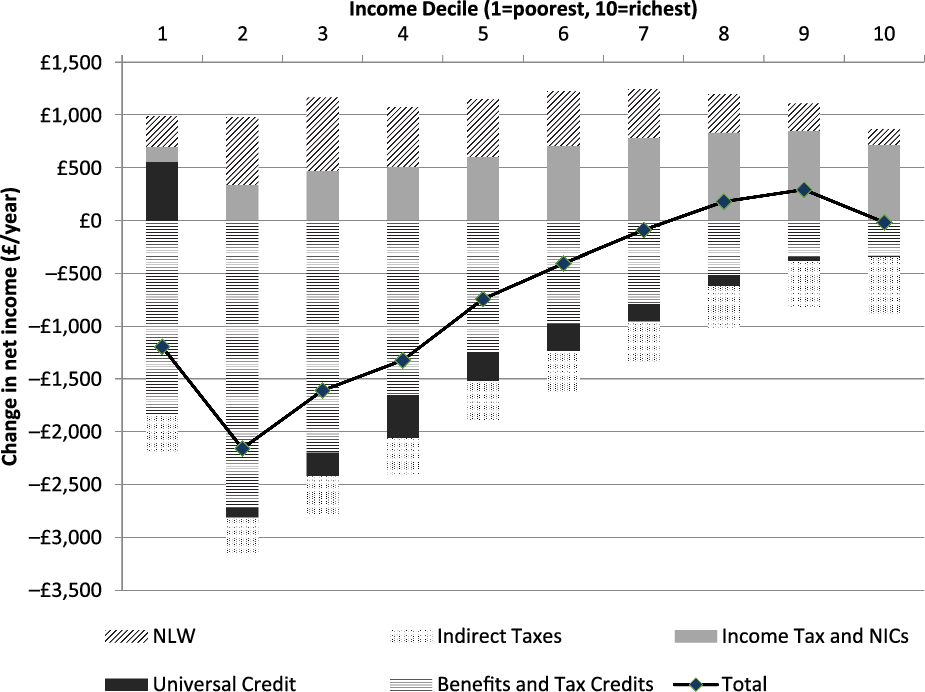
Figure 1 shows that the biggest average total losses from the reforms are in decile 2 (at around £2,150 per year). Losses for the poorest decile are smaller than this, around £1,200 per year. This is partly because average losses from benefit and tax credit reforms are smaller for the lowest decile than for decile 2; in addition, the introduction of UC leads to an increase in average net incomes for the lowest decile, but a reduction in net income for the other deciles. The positive impact of introducing UC for the lowest decile occurs because UC will have a higher overall take-up rate than the benefits and tax credits it replaces.
Moving up the distribution, the overall impact of the reforms is negative for deciles 2 to 7, with the average impacts getting smaller for households further up the distribution. For those in deciles 8 and 9, the total impact is positive (average gains of around £300 in decile 9), and, for the top decile, it is around zero. This distributional pattern is driven by one main factor: while the changes to benefits and tax credits (and UC above the first decile) have an overall negative impact, the impact is smaller for households further up the income distribution. This is mainly because households receive larger benefit and tax credit payments in the baseline scenario the further down the income distribution they are.
Reforms to benefits and tax credits since 2010 have resulted in expenditure being over £30 billion lower than if the benefit and tax credit rules (including the uprating rules) had been unchanged from those operating before the 2010 election. This makes it unsurprising that the distributional impact of these cuts is borne most heavily by households most reliant on benefits and tax credits. This pattern is repeated in distributional analysis by household characteristics (particularly by demographic characteristics and disability status).
The impact of changes to income tax and NICs is positive across all ten deciles but is larger in cash terms for the richer income deciles than for the poorer ones (with the largest cash gains occurring in decile 9). The main reason is that the policy reform resulting in the largest reduction in direct taxation since 2010 is the raising of the tax-free personal allowance for income tax, from £6,475 in the 2010/11 tax year to £12,500 by 2019/20. This is a substantial increase in real terms in the personal allowance and results in a cut in income tax for those whose gross income is above the original personal allowance threshold (uprated in line with inflation). However, the largest gains from the policy go to people who are earning £12,500 or more (in 2020–21 prices) because gross income needs to be this high to benefit from the whole of the allowance increase. Many adults in households lower down the income distribution do not earn enough to receive the full benefit. The changes to the Scottish income tax system from 2018/19 onwards, which introduced slightly more progression in the banding system (with the higher and additional rates rising by 1 percentage point) result in a bigger fall in incomes in the top decile but this is only apparent when the results are presented for Scotland alone (as in Chapter 6 of Portes and Reed, Reference Portes and Reed2018).
The impact of changes to gross incomes caused by the NLW is also positive across the whole income distribution but the highest impacts are in deciles 2 and 3. This is because the NLW is assumed to increase wages for all employees with an hourly wage below 60 per cent of median earnings (at 2020–21 prices) and these low-wage workers are more likely to be located in these. However, even the top decile shows some average gains from the NLW as some low-wage workers aged twenty-five or over (for example, men or women in couples whose partners are high earners but who earn less than 60 per cent of median earnings in their own jobs) are located in the richest deciles.
Changes to indirect taxes result in losses in every decile and these losses are slightly larger for richer households than for poorer ones. The main policy change which drives this result is the increase in the standard rate of VAT from 17.5 per cent to 20 per cent from January 2011, while excise duties on petrol and diesel have been cut substantially since 2010. The overall impact of the fuel duty cuts is not enough to offset that of the VAT increase.
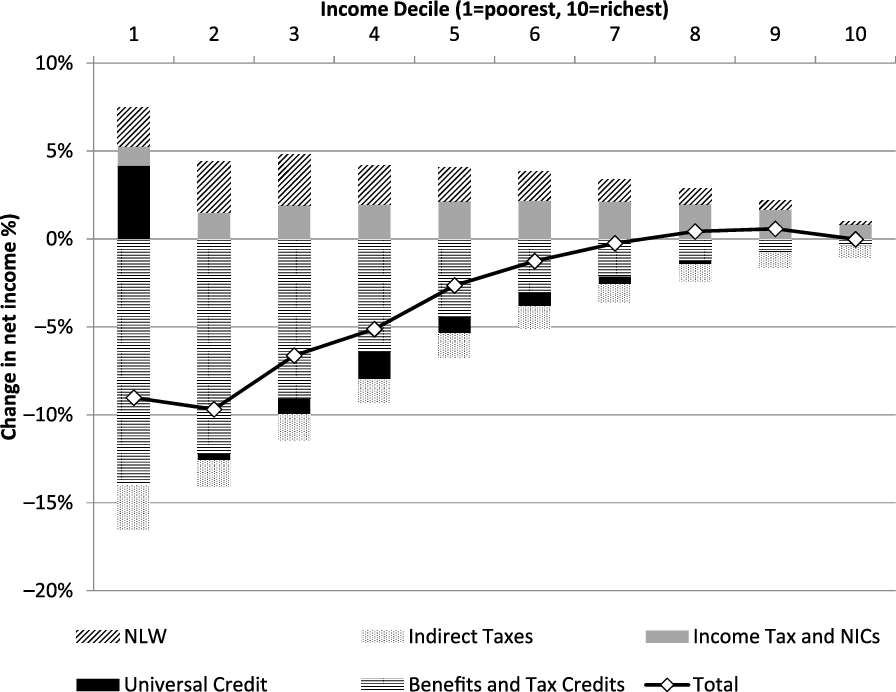
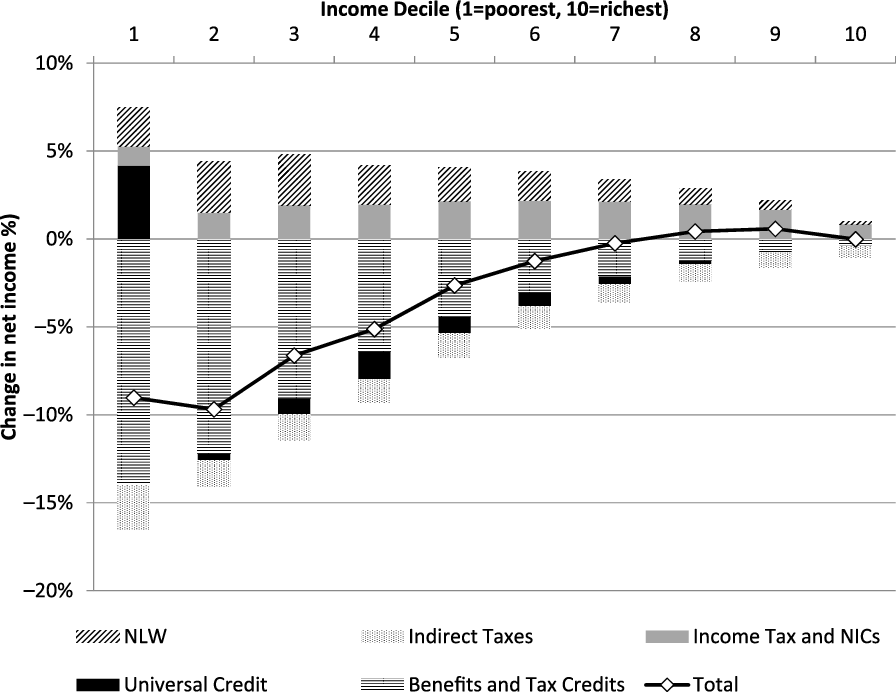
Figure 2 shows the results from Figure 1 as a percentage of net income in the baseline scenario. The results show a broadly regressive pattern of total impacts across most of the income distribution (between deciles 2 and 9). The largest negative net impact is for decile 2 at around 10 per cent of net income; average losses for richer households are smaller the higher up the decile, while deciles 8 and 9 experience small average gains (0.6 per cent for decile 9). For the poorest and richest deciles, the pattern is different; average losses for the lowest two deciles are 9–10 per cent, while the top decile experiences very small average losses (less than 0.1 per cent).
Percentage impact of reforms to taxes and transfer payments by household net income decile, 2021/22 tax year: Great Britain.
Impacts by household demographic type
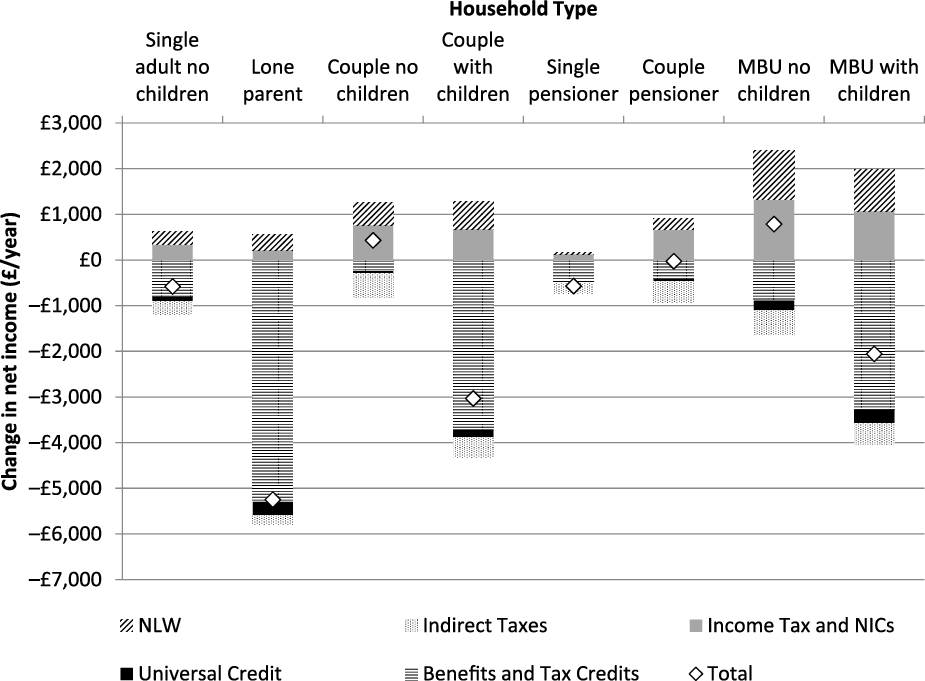
Figure 3 shows the distributional impact of reforms to taxes and transfer payments by household demographic type, combining three different household characteristics: presence or absence of children, number of adults, and whether the adult(s) in the household are of working age or pensioner(s). Based on various combinations of these factors, the households are divided into eight categories. Two are Multiple Benefit Units (MBUs) representing households where there is more than one DWP defined benefit-unit living at a single address.Footnote 4
Cash impact of reforms to taxes and transfer payments by household demographic type, 2021/22 tax year: Great Britain.
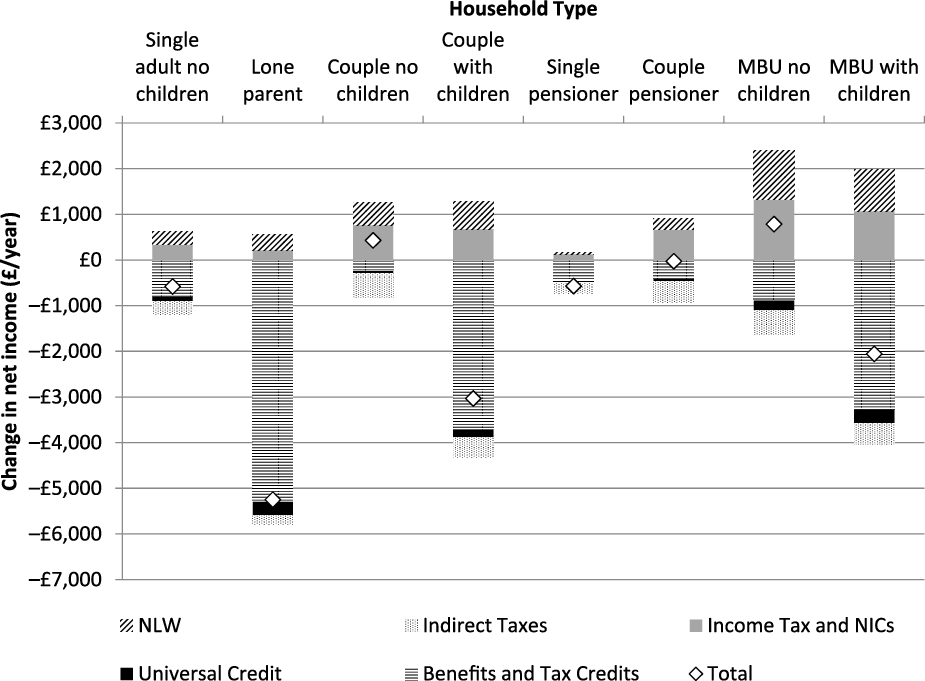
The most striking finding demonstrated by Figure 3 is that households with children experience much larger losses as a result of the reforms than those without children. Losses are especially dramatic for lone parents, who lose around £5,250 on average – equivalent to almost 19 per cent of their net income. Average losses for couples with children are smaller but still substantial, at around £3,000 per year, equivalent to around 6 per cent of net income. For MBU households with children, losses average around £2,050 per year. In general, these losses are driven by the substantial cuts to benefits and tax credits since 2010. Losses are slightly exacerbated by the introduction of UC, although the predicted increase in take-up of UC (compared with its predecessor benefits and tax credits) to some extent mitigates the additional losses.
Households without children experience average gains in some cases. Couples without children gain slightly under £450 per year and MBUs with no children gain slightly under £800 per year. The remaining groups experience average losses: slightly under £600 for single working-age adults without children, around £550 for single pensioners, and £25 for couple pensioners. To a large extent, the pattern of gains or losses for households without children is determined by the size of their gains from the income tax and NICs changes, and the introduction of the NLW. MBUs without children, couples without children and couple pensioners experience larger gains in gross income and reduced direct tax payments than single adults with no children and single pensioners. This reflects the fact that many households in the couple and MBU groups have at least two adults in work and therefore receive a potential double benefit from the tax changes and the NLW. Single pensioners, by contrast, benefit only to a very small extent from the tax changes. This is largely because the substantial increase in real terms in the personal allowance for working-age people did not affect pensioners in the baseline system until the increase in the personal allowance ‘caught up’ with the value of the personal allowance for pensioners aged sixty-five to seventy-four in the 2016–17 tax year. Single pensioners are also much less likely to be in work than working-age people and so, as a group, do not benefit considerably from the NLW. By contrast, many couple pensioner households contain a younger working-age partner, many of whom do benefit from these reforms.
Impacts by number of children in the household
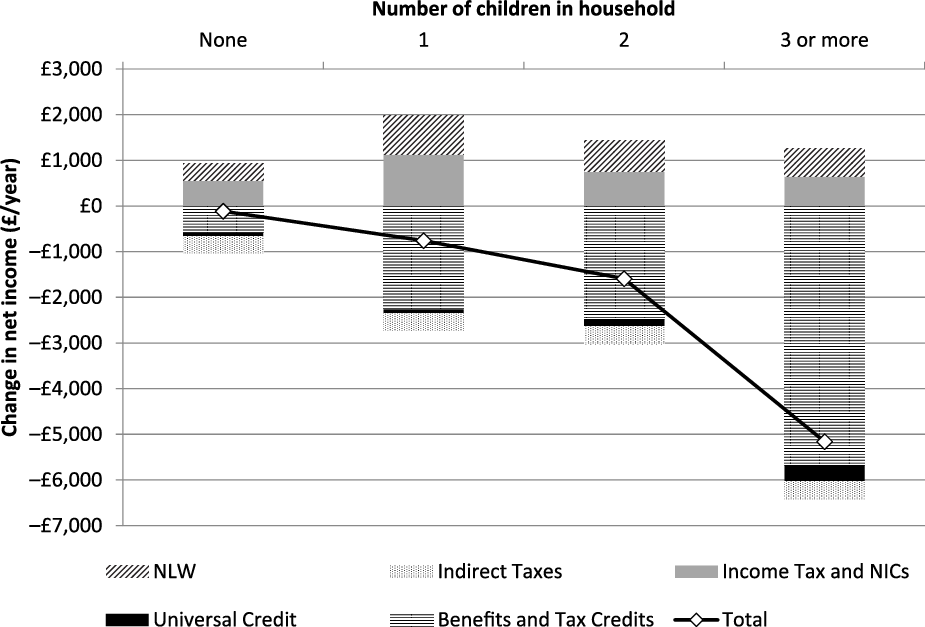
Figure 4 shows the average cash impact of reforms by number of children in the household. The figure shows that average cash losses (black line) are greater for households with more children. The average losses for those with three or more children (around £5,150) are over three times the average cash losses for ones with two children (around £1,600) and over six times the average cash losses for one child ones (around £800). In percentage terms, households with children lose almost 12 per cent of their net incomes on average. These results suggest a particular net income penalty to having three or more children in the household. This is mostly driven by cuts in benefits and tax credits, with cash losses averaging slightly under £2,300 for households with one child and slightly under £2,500 for those with two children, but almost £5,600 for those with three or more children. The introduction of UC also has a larger negative impact for households with three or more children than any other group.
Cash impact of reforms to taxes and transfer payments by number of children in household, 2021/22 tax year: Great Britain.
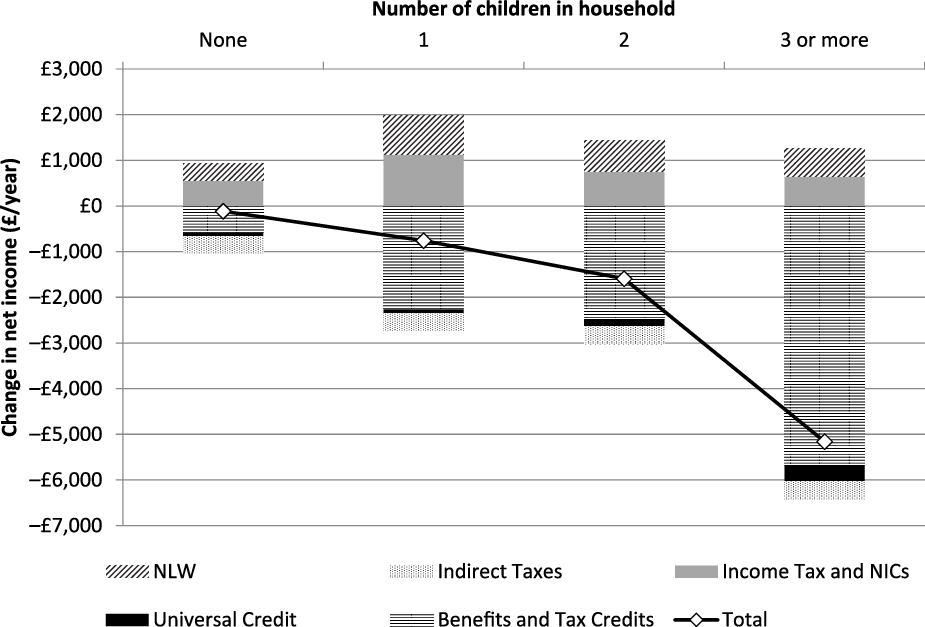
One of the main reforms driving the results in Figure 4 is the announcement in the July 2015 Budget that, from 2017 onwards, premiums for children in HB, tax credits and UC would be limited to a maximum of two children only for new claimants, and would not be available for existing claimants for most third and subsequent children born after April 2017 (Hudson-Sharp et al., Reference Hudson-Sharp, Munro-Lott, Rolfe and Runge2018: 115–16).Footnote 5
Impact of reforms by number of functional disabilities in the household
This distributional breakdown uses the ten binary indicators in the FRS for specific functional disabilities to develop a household disability ‘score’ variable.Footnote 6 The disability score is constructed for each FRS household using a two-stage process:
The number of functional disabilities (between zero and ten) is summed for each person.
These individual-level scores are then summed across the household.
Consequently, the score provides an indicative measure of the number of functional disabilities across all adults and children in the household.
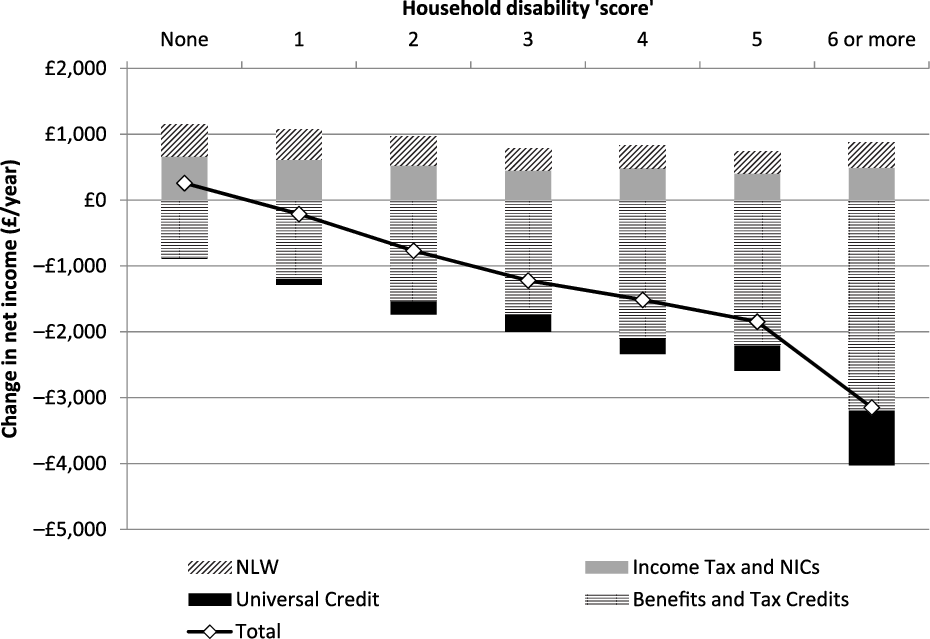
Figure 5 shows the cash impact of reforms to direct taxes and transfer payments by household disability score. Relatively few households have disability scores above six, so those with scores of six or more are combined into a single category. Households with higher disability scores experience greater average losses. Average changes in net income range from a gain of around £250 per year for households with a disability score of zero to losses of around £3,150 per year for those with a score of six or more. Changes in net income as a percentage of net income by disability score show a similar negative gradient, with households with no disabilities gaining 0.7 per cent on average, compared to losses of 0.6 per cent for ones with one disability, and increasing percentage losses for ones with higher numbers of disabilities, up to average losses of just over 8 per cent for those with six or more. This pattern of losses demonstrates that the cumulative effect of tax and benefit changes over this period had a greater impact on households containing people with more extensive disabilities than on those with relatively minor disabilities or no disabilities at all.
Cash impact of reforms to taxes and transfer payments by household disability score, 2021/22 tax year: Great Britain.
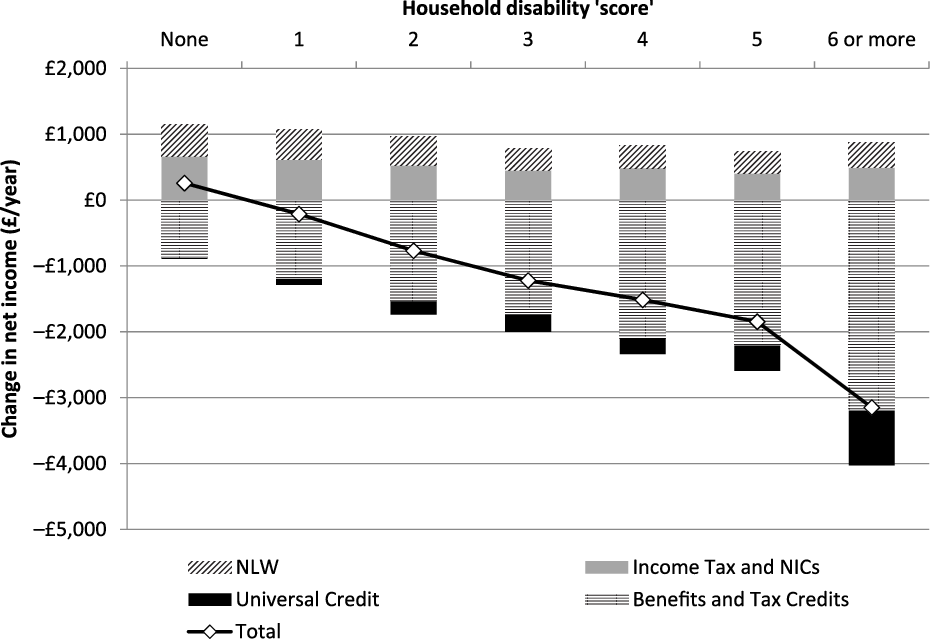
The pattern in Figure 5 is mainly driven by larger losses from benefit and tax credit cuts, and from the introduction of UC, for households with a higher disability score. These benefit slightly less on average from the income tax and NICs changes, and from increases in gross income as a result of the NLW. This is caused by the fact that they have fewer adults in work (on average) than ones with a lower disability score, partly because of lower employment rates for disabled working-age adults. In addition, households with disabled children have lower adult employment rates than those without disabled children, mainly because disabled children often require longer hours of care from adults, reducing opportunities for paid employment.
Impact of reforms by ethnicity of adults in household
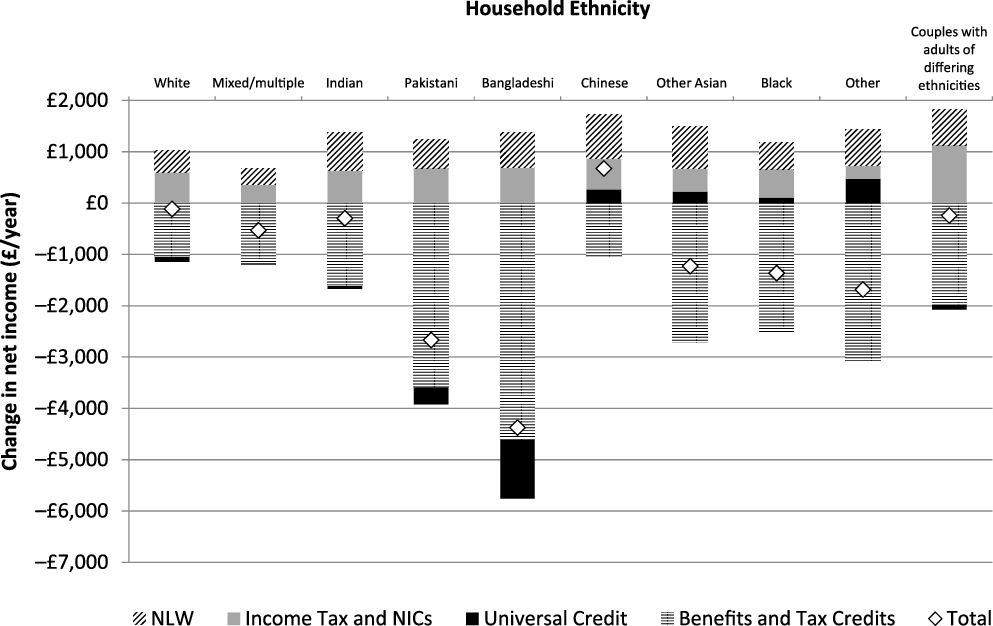
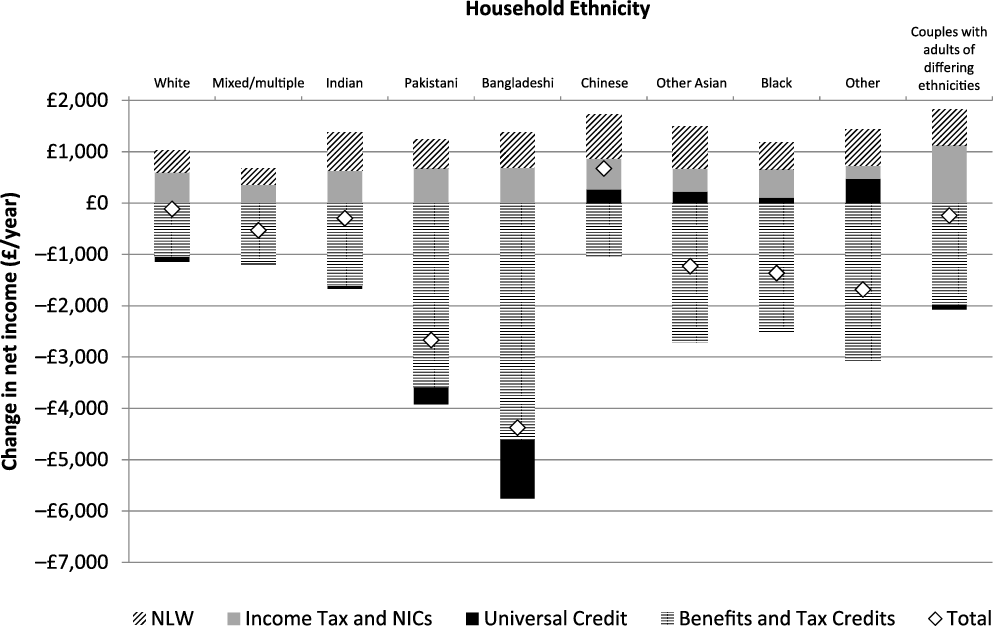
Figure 6 shows a distributional analysis of the impact of direct taxFootnote 7 and social security reforms using an ethnicity variable that divides households into nine groups based on the ethnicity of the adult(s) in the household:
White (including England/Welsh/Scottish/Northern Irish/British, Irish, Gypsy or Irish Traveller, and any other White background).
Mixed or Multiple ethnic groups (including White and Black Caribbean, White and Black African, White and Asian and any other Mixed/Multiple ethnic background).
Indian
Pakistani
Bangladeshi
Chinese
Other Asian
Black (including Black British, African, Caribbean and any other Black/African/Caribbean background).
Other (including Arab, and any other ethnic group not specified in the other categories).
Where households have adults who are not all in the same ethnicity category they are classified as ‘couples with adults of differing ethnicities’.
The results show substantial losses for Bangladeshi households (around £4,400 per year on average) and Pakistani ones (slightly under £2,700). Indian households see much smaller losses (only around £300), while Chinese households are the only ethnic group to gain from the reforms on average (gains of slightly under £700). ‘Other Asian’ households lose around £1,200 per year on average, similar to the outcome seen by Black households (slightly under £1,400 losses). In percentage terms, the largest total losses are for Bangladeshi (averaging just under 11 per cent of net income) and Pakistani households (just under 7 per cent).
The pattern of losses (and gains for Chinese households) by household ethnicity reflects two main variations across household ethnic groups. First, there is a substantial difference in the extent to which households of different ethnicities lose out from the benefit and tax credit changes. Bangladeshi and Pakistani households are hit particularly hard, on average losing over £4,600 and almost £3,600 respectively from the cuts to benefits and tax credits. Bangladeshi households also lose over £1,100 on average and Pakistani ones over £300 from the cuts to UC. ‘Other Asian’, Black and ‘Other’ households are also adversely affected by the cuts to benefits and tax credits, with average losses of around £2,700, £2,550 and £3,100 respectively. For these groups, however, the introduction of UC has positive effects on net income, which offset some of the losses. At the other end of the scale, White, Mixed/Multiple and Chinese households have relatively small average losses from the benefit and tax credit cuts, between £1,000 and £1,200 per year for each group.
Second, the increases in net income arising from the income tax and NICs reforms and the introduction of the NLW have different impacts across the various ethnic groups. The biggest gains from the NLW are for Indian, Chinese, ‘Other Asian’ and ‘Other’ groups, as well as couples containing adults of differing ethnicities. All these groups gain by at least around £700 because of a relatively high proportion of working adults on low hourly wages. By comparison, the ‘Mixed/Multiple’ ethnic group gains by only slightly over £300 on average from the NLW, and White households by less than £450. The biggest gainers from the income tax and NICs changes are couples containing adults of differing ethnicities (an average gain of over £1,100 per year), Chinese households (slightly under £600), Bangladeshi households (slightly under £700) and Pakistani households (slightly under £600). The smallest gainers are ‘Mixed’/’Multiple’ households (around £350 per year) and ‘Other’ households (around £250 per year). The fact that Chinese households are the only group to gain on average is explained by the fact that they are the only group simultaneously to experience relatively large gains from the NLW and income tax and NICs changes, in conjunction with relatively small losses to benefits and tax credits.
Cash impact of reforms to direct taxes and transfer payments by household ethnicity, 2021/22 tax year: Great Britain.
Impact of reforms by gender and income decile
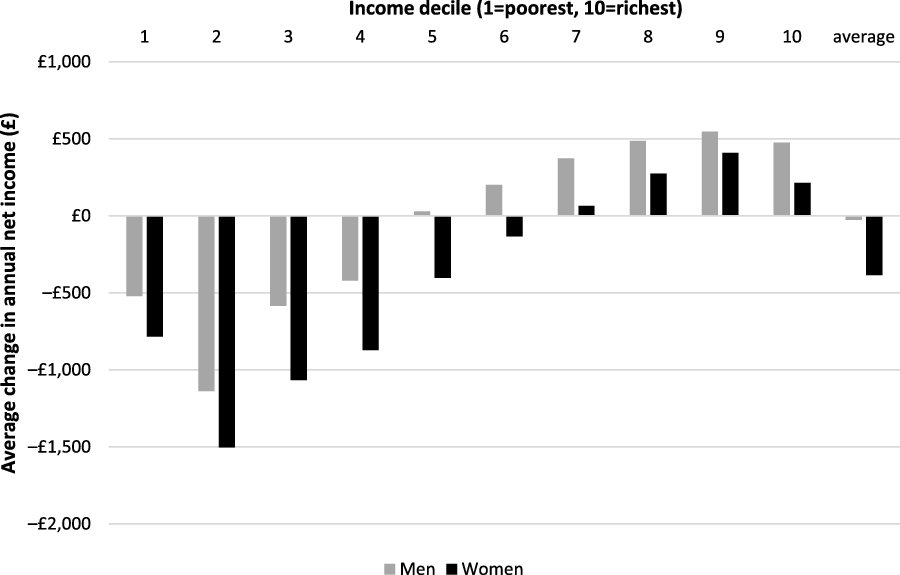
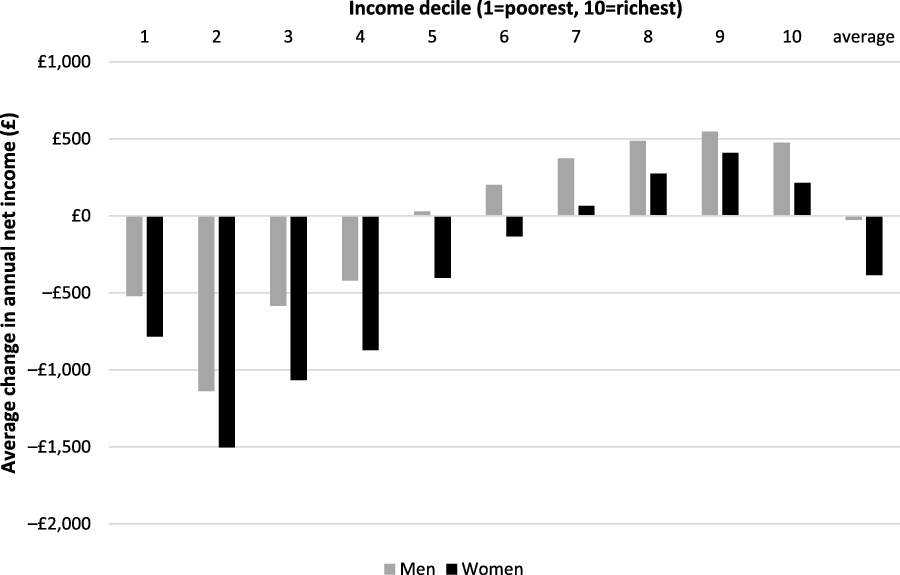
Figure 7 shows the cash impact of reforms to direct taxes and transfer payments by gender and household income decile. This figure is based on individual-level, rather than household-level, results from the tax-transfer model.Footnote 8 The results do not contain any losses from indirect tax reforms because expenditure in the LCF is recorded at the household level rather than the individual level. The ‘average’ column at the right-hand side shows that, on average, women lose around £400 per year from the reforms, whereas men lose only around £30. Women lose more (or gain less) from the reforms on average across every decile of the household income distribution. The largest losses for women relative to men are in deciles 3, 4 and 5, with the gender difference being nearly £500 in decile 3, although womenʼs absolute cash losses are largest in decile 2. In percentage terms, the largest average losses for women are in decile 2 (11.3 per cent) and decile 1 (8.6 per cent), while for men the largest average losses are also in decile 2 (7.4 per cent) and decile 1 (6.1 per cent).
Cash impact of reforms to direct tax and transfer payments by gender and income decile, 2021/22 tax year: Great Britain.
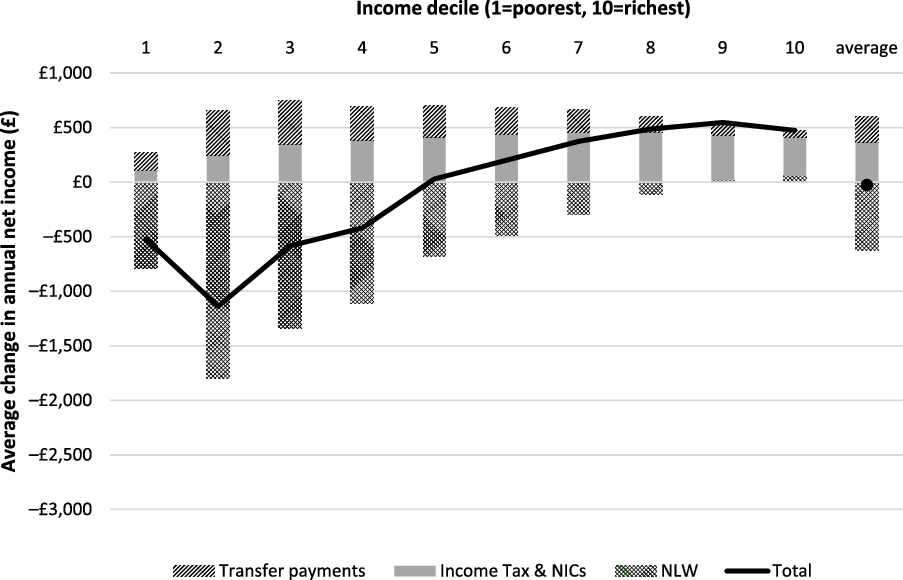
Figures 8 and 9 show the contribution of different reforms to the overall distributional patterns shown in Figure 7. There are three differences between Figures 8 and 9 which help explain the overall patterns seen in Figure 7. First, changes to transfer payments have a smaller negative effect for men than for women in every decile except for decile 2, because women tend to receive larger amounts of transfer payments in the baseline scenario than men. Women receive an average of around £7,900 per year in transfer payments compared with around £6,550 per year for men. This is partly because 90 per cent of lone parents with dependent children are women (ONS, 2017), and partly because women are more likely to receive benefits and tax credits in couples with children.
Contribution of different types of reform to overall cash impact, men by income decile, 2021/22 tax year: Great Britain.
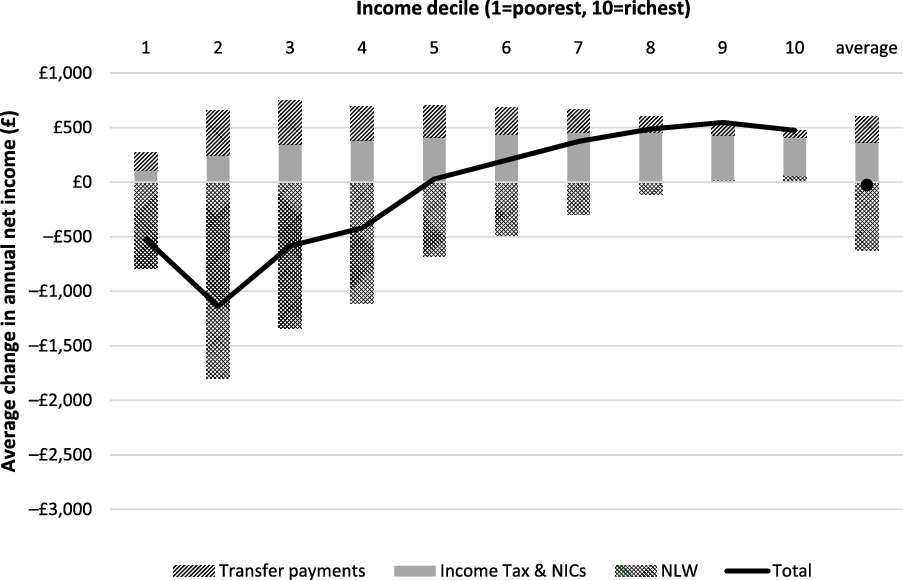
Contribution of different types of reform to overall cash impact, women by income decile, 2021/22 tax year: Great Britain.
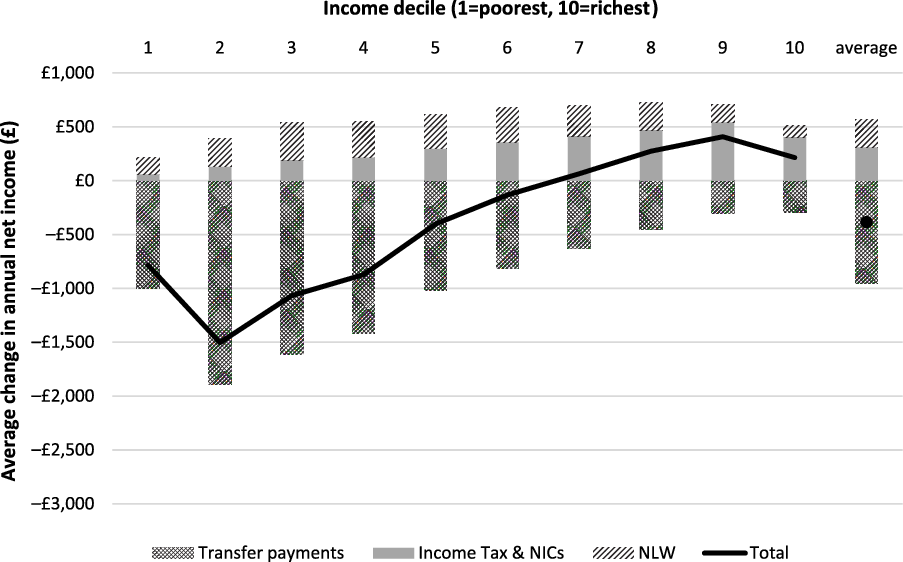
Second, men benefit slightly more on average than women from the changes to income tax and NICs. This is partly because working-age men have a higher employment rate than their female counterparts, but mainly because women are more likely to be full-time homeworkers looking after pre-school children. Women are also more likely than men to work part-time and on average to have lower hourly earnings. Women are therefore less likely to benefit from the full value of the increase in the income tax personal allowance, which is the main direct tax cut introduced since 2010.
Third, while womenʼs average gains in gross income from the NLW are slightly higher than menʼs (£259 for women compared with £234 for men), the distributional pattern of gains by household income decile show a different trend. The average gains are highest for men in gross income in deciles 2 and 3 and for women in deciles 3 and 4, and womenʼs gains are spread higher up the income distribution. This reflects the fact that women who have relatively low earnings are more likely than men to have a high-earning partner, and hence to be a member of a higher-earning household.
Conclusions
The distributional analysis shows that the changes to taxes and transfer payments (benefits, tax credits and the introduction of UC) announced since 2010 are, overall, regressive, regardless of the way in which the changes are measured. Consequently, the largest impacts are felt by those with lower incomes. This is true even when increases in gross earnings from the NLW are taken into consideration. Households in the bottom two deciles will lose, on average, approximately 10 per cent of net income, with much smaller losses for those higher up the income distribution.
These distributional impacts are driven by changes to the tax system and the social security system. In general, changes to benefits, tax credits and UC have had negative impacts, in particular the freeze in working-age benefit rates, changes to disability benefits and reductions in UC rates. Reforms to direct taxation have had a positive impact on net incomes, especially in the middle to upper reaches of the income distribution and for households with two or more adults in work; these impacts are largely driven by the increase in the tax-free personal allowance for income tax. Changes to indirect taxes, principally the increase in VAT in 2011, have led to regressive impacts as expenditure on goods and services subject to VAT is a higher share of net income for poorer households than for richer households.
The reforms have a disproportionately negative impact on several groups – in particular, households with more disabled members and individuals with more severe disabilities, and for lone parents on low incomes. Losses are extremely large as a percentage of income for some family types. For example, households with at least one disabled adult and one disabled child see average annual cash losses of slightly over £6,500, over 13 per cent of average net income. The impact of changes to direct taxes and benefits is to reduce the income of Bangladeshi households by around £4,400 per year on average. By contrast, some groups gain from the reforms on average – for example couples with no children see average annual cash gains of just under £500, while the average impact for couple pensioners is approximately zero.
Overall, the changes to taxes and benefits are also likely to lead to significant increases in the number of households below a minimum acceptable standard of living. Many households in vulnerable groups (such as lone parents and couples with children, and households with disabled adults and/or children) lose substantial proportions of their incomes (often over 20 per cent) from the package of reforms to direct taxes and transfer payments, even taking into account increases in gross incomes from the NLW which generally help those in the middle deciles as households in the lowest decile are less likely to have members in employment.
These reforms took place against a background of a clear and overarching UK Government commitment to deficit reduction; changes to taxes and benefits are obviously an inevitable consequence of this. However, it does not follow that the precise mix of reforms implemented was inevitable, nor was the impact on vulnerable protected groups that emerged.
The UK is a State Party to the International Covenant on Economic, Social and Cultural Rights (ICESCR), which includes the right to social security. The UN Committee on Economic, Social and Cultural Rights has observed that benefits must be ‘adequate in amount and duration’ to ensure an adequate standard of living. Moreover, any reductions (driven, for example, by wider economic policy considerations) should be temporary, necessary and proportionate (Office of the High Commissioner for Human Rights, 2013). The UK Governmentʼs published impact assessments do not indicate, by themselves, that these obligations have been taken into account; nor do they indicate that the Government paid due regard to the Public Sector Equality Duty and the impact of reforms on vulnerable groups.
Overall, the analysis in this article shows that reforms have impacts in different ways on different groups. It is important for policy makers to consider the cumulative impact of all measures over the relevant time period (2010 to 2017 in this case) simultaneously. Although the changes to taxes and benefits are implemented as individual reforms in the UK (in Budgets and other fiscal events) they are experienced cumulatively by households, and this is the most useful way to analyse them.