Introduction
Chickpea (Cicer arietinum L.) is the third most important pulse crop globally, with a production of 9.8 M t from an area of 11.1 M ha (FAOSTAT, 2009). It is even more important for India, as the country's production accounts for 67% of the global chickpea production and chickpea constitutes about 40% of India's total pulse production. In spite of India being the largest chickpea producing country, a deficit exists in domestic production and demand, which is met through imports.
Chickpea is a winter season crop and often experiences increasing high temperature stress with advancing stages of crop growth. During the past three decades, there has been a significant shift in the growing environment of chickpea in India from the cooler, long-season environments of northern India to the warmer, short-season environments of central and southern India (Gaur et al., Reference Gaur, Kumar, Gowda, Pande, Siddique, Khan, Warkentin, Chaturvedi, Than, Ketema and Kharkwal2008; Gowda et al., Reference Gowda, Parthasarathy Rao, Tripathy, Gaur, Deshmukh, Ali and Kumar2009). Terminal drought and heat stresses are major constraints to chickpea production in warmer short-season environments. Also, the chickpea area under late-sown conditions is increasing, particularly in northern and central India, due to inclusion of chickpea in new cropping systems and intense sequential cropping practices leading to a prolonged exposure of chickpea to high temperature. Heat stress during the reproductive period is a major limitation in this situation too. It is also estimated that about 11.7 M ha of rice area in India currently remains fallow after late harvest of rice during the winter season in the central and northeastern India (Subbarao et al., Reference Subbarao, Kumar Rao, Kumar, Johansen, Deb, Ahmed, Krishna Rao, Venkataratnam, Hebbar, Sai and Harris2001). These lands potentially offer expansion in chickpea cultivation, provided genotypes capable of standing heat stress are made available. Finally, heat stress is expected to be an increasingly important constraint in near future due to climate change and global warming. By 2050, a rise in temperature by at least 2°C, particularly the night temperatures, is being predicted with higher levels of warming in northern parts of India. It can be envisaged that the increases in temperature will have more adverse effects on cool-season crops (e.g. chickpea) than the rainy-season crops (Kumar, Reference Kumar2006). So, there is an urgent need to search the gene bank for diverse sources of heat tolerance. However, no such systematic search had been taken up in chickpea except for a limited effort with 25 diverse genotypes leading to the identification of two genotypes, ICCV 88 512 and ICCV 88 513, to have heat tolerance at reproductive stage (Dua, Reference Dua2001).
Flowering and podding in chickpea are known to be very sensitive to changes in external environment, and exposure to heat stress at this stage is known to lead to reduction in seed yield (Summerfield et al., Reference Summerfield, Hadley, Roberts, Minchin and Rawsthorne1984). Drastic reductions in chickpea seed yields were observed when plants at flowering and pod development stages were exposed to high (35oC) temperatures (Summerfield et al., Reference Summerfield, Hadley, Roberts, Minchin and Rawsthorne1984; Wang et al., Reference Wang, Gan, Clarke and McDonald2006). Heat stress is known to adversely affect pollen viability, fertilization and seed development leading to a reduced harvest index. Yet, it is still not clear how heat affects the growth and development of chickpea and whether that can explain part of the differences in seed yield under heat stress. So, a pre-requisite, before undertaking a more thorough physiological analysis of the traits involved in heat stress tolerance, is the identification of heat-tolerant genotypes. Also there is an urgent need to develop simple and effective screening techniques for screening germplasm and breeding materials for reproductive stage heat tolerance in chickpea.
Therefore, the objectives of this study were to develop a screening method and to screen the reference collection of chickpea germplasm in contrasting chickpea growing locations for high temperature tolerance. The reference collection is a representative subset assembled based on the molecular diversity of the global composite germplasm collection of chickpea (Upadhyaya et al., Reference Upadhyaya, Dwivedi, Baum, Varshney, Udupa, Gowda, Hoisington and Singh2008). Screening of such a diverse germplasm collection has provided contrasting diverse sources of chickpea genotypes for breeding to develop high temperature-tolerant, climate change-resilient chickpea varieties. In addition, it was also aimed to identify traits that were most closely related to seed yield under heat stress.
Materials and methods
Crop management
Field evaluation of the reference collection of chickpea germplasm devoid of the wild accessions and very long duration accessions (n = 280) was conducted during the post-rainy and summer season of 2009–10 in two sowing dates (normal and late sowing) on a Vertisol (fine montmorillonitic isohyperthermic typic pallustert) at ICRISAT, Patancheru (17° 30′N; 78° 16′E; altitude 549 m) in peninsular India and in an Inceptisol (sandy loam) at the New Research Farm, Indian Institute of Pulses Research, Kanpur in northern India. The soil depth of the field used at ICRISAT was ≥ 1.2 m and known to retain about 230 mm of plant available water. The soil depth and maximum retainable water were 1.5 m and 180 mm at Kanpur. At ICRISAT, the field used was solarized using polythene mulch during the preceding summer to sanitize the field, particularly to eradicate wilt-causing fungus Fusarium oxysporum f. sp. ciceri. After the soil solarization in summer, the field was kept fallow. At Kanpur, the soil was deep ploughed twice and kept fallow after harvest of green gram (mung bean) in the end of September, for another one and half months, before sowing chickpea.
At ICRISAT, the field was prepared into a broad bed and furrows with 1.2 m wide beds flanked by 0.3 m furrows for the normal time sowing, while it was 60 cm ridges and furrows for the late sowing. Surface application and incorporation of 18 kg N/ha and 20 kg P/ha as diammonium phosphate were carried out before sowing. The plot size was 4 × 0.75 m with a 30 × 10 cm spacing for the normal sowing and 2 × 0.6 m (one row) with a 60 × 10 cm spacing for the late sowing. The design was a 14 × 20 alpha design (280 accessions) with three replications in normal and two in late sowings. The normal time sown crop was grown under receding soil moisture condition without any irrigation (apart from a post-sowing irrigation), while it was optimally irrigated in late sown condition receiving irrigations on 0, 18, 30, 35, 45, 55, 65 and 75 d after sowing. Seeds were treated with 0.5% Benlate® (E.I. DuPont India Ltd., Gurgaon, India)+Thiram® (Sudhama Chemicals Pvt. Ltd., Gujarat, India) mixture in both the sowings. The normal sown experiment was planted on 31st October 2009 in 30 × 10 cm spacing, and the late sown one was planted on 2nd February 2010 in 60 × 10 cm spacing with two seeds per hill that was later thinned to one. During both the plantings, the fields were inoculated with Rhizobium strain IC 59 using liquid inoculation method (Brockwell, Reference Brockwell and Vincent1982). A 50 mm irrigation through perforated pipes was applied the next day to ensure complete emergence. Need-based insecticide sprays against pod borer (Helicoverpa armigera) were provided, and the plots were kept weed free by manual weeding.
At Kanpur, both the normal and late sowings were sown on a flat bed with a plant spacing of 60 × 10 cm and a plot size of 3 × 0.6 m on 13th November 2009 and 13th January 2010, respectively. The experiments were planted in an 8 × 35 alpha design (280 accessions) with three replications. The seeds were treated with Bavistin (BASF India Ltd, Panoli, Bharuch, Gujarat, India) containing carbendazim 50% WP at 1 g/100 g seeds and was hand planted with more than 50 seeds on a row and later thinned to maintain approximately 10 cm distanced plants. After pre-sowing irrigation, a 50 mm irrigation through surface irrigation was applied on 2nd February 2010 (80 d after sowing) for the normal sowing, but three such irrigations on 2nd February, 12th March and 26th March 2010 (19, 37 and 50 d after sowing) were applied for the late-planted crop. Although pod borer (H. armigera) is not a major pest in Kanpur, Endosulfan, EC 35% (Excel Crop Care, Limited, Mumbai, India) (at 2 ml/l of water) was sprayed when 1–2 larvae/plot were noticed, more as a prophylactic pest control measure. Pre-emergence weedicide pendimethalin at 3 ml/l was applied immediately after sowing the crop. Manual weeding was followed thereafter at regular intervals.
Phenology
By regular observation, the date when 50% or more of the plants in a plot flowered was recorded as 50% flowering time of the plot, and the date when 80% of the pods in a plot were mature was recorded as the time of maturity for each plot.
Final harvest
At physiological maturity, plant aerial parts were harvested from an area of 4 × 0.75 m (3.0 m2) under normal sowing and 4 × 0.6 m (2.4 m2) under late sown condition in Patancheru and 3 × 0.6 m (1.8 m2) under both normal and late-sown conditions in Kanpur in each plot, dried to constant weight in hot air dryers at 80°C, and total shoot dry weights were recorded. Grain weights were recorded after threshing. Harvest index (%) was calculated as 100 × (seed yield/total shoot biomass at maturity).
Heat tolerance index (HTI) estimation
Differences in crop duration and yield potential (Saxena, Reference Saxena, Saxena and Johansen1987) are known to contribute to the seed yield under both drought and salinity stress, and the removal of these effects from seed yield under stress provides a reliable measure of stress tolerance per se (Vadez et al., Reference Vadez, Krishnamurthy, Serraj, Gaur, Upadhyaya, Hoisington, Varshney, Turner and Siddique2007). Similar escape mechanism is also expected with heat, since the temperature increased linearly during the late planting period and all the short-duration genotypes could start flowering and filling seeds even before the temperatures increased to critical levels (Saxena, Reference Saxena, Saxena and Johansen1987). Previous work related to drought has shown that the residual yield remaining unexplained after removal of effects due to drought escape (early flowering) and yield potential (optimally irrigated yield) of a genotype gave a good indication of the true drought tolerance of that genotype (Bidinger et al., Reference Bidinger, Mahalakshmi and Rao1987; Saxena, Reference Saxena, Saxena and Johansen1987; Saxena, Reference Saxena and Saxena2003; Vadez et al., Reference Vadez, Krishnamurthy, Serraj, Gaur, Upadhyaya, Hoisington, Varshney, Turner and Siddique2007; Krishnamurthy et al., Reference Krishnamurthy, Kashiwagi, Gaur, Upadhyaya and Vadez2010). These residuals were calculated using the multiple regression approach of Bidinger et al. (Reference Bidinger, Mahalakshmi and Rao1987). This approach considers grain yield under drought stress condition (Y s) as a function of yield potential (Y p), time to 50% flowering (F) and a drought tolerance index (DTI), such that the yield of a genotype can be expressed as follows:

where E is random error with zero mean and variance σ. The DTI was calculated as the difference between the actual and estimated yields under stress upon the standard error of the estimated yield (σ). For this multiple regression, 50% flowering (F i) under stress for every individual plot and yield potential (Y p) arithmetic mean across the three replications were considered. Similar approach was adopted for estimating HTI, as flowering time and yield potential are expected to determine the yields of genotypes that are limited by heat stress.
Statistical analysis
The replication-wise values of HTI along with other traits were used for statistical analysis of each environment using ReML (Harville, Reference Harville1977) considering genotypes as random. Variance components due to genotypes ( ) and error (
 ) and their standard errors were determined. Environment-wise best linear unbiased predictors (BLUPs) for the germplasm accessions of the reference collection were calculated for the different environments. The significance of genetic variability among accessions was assessed from the standard error of the estimate of genetic variance
 , assuming the ratio
 /SE (
 ) to follow normal distribution asymptotically.
While pooling the data over two sites, Bartlett (Snedecor and Cochran, Reference Snedecor and Cochran1989) test indicated heterogeneity in error variances. Appropriate transformation was applied, and data were tested for the presence of G × E interaction. Upon detection of significant G × E interaction, data from each site were analyzed individually, and significance of genotypes and their relative ranks were obtained. Spearman's rank correlation coefficient was calculated to have an idea of difference in genotype ranking over sites. Cluster analysis using Ward's incremental sum of squares method was employed to group the genotypes over sites for HTI. All statistical analyses were carried out using Genstat, Release 10.1 (Payne, Reference Payne2002).
Results
Variation in weather
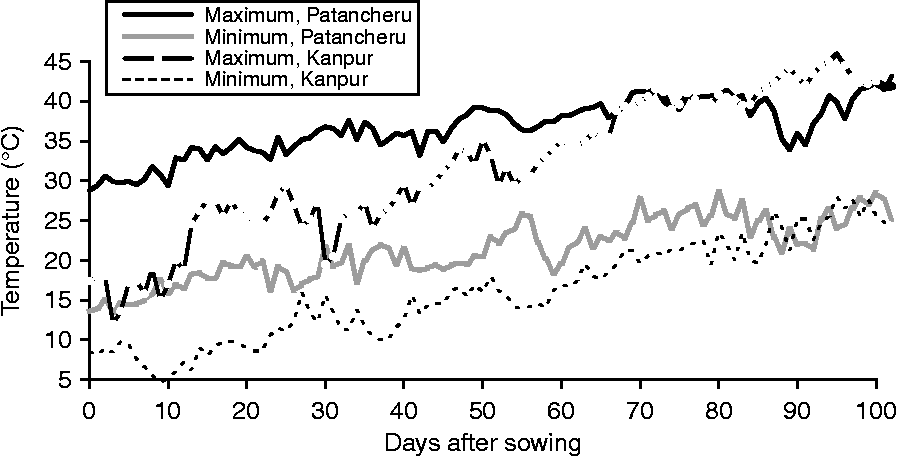
The late sown crop, subjected to heat stress, was sown on 2nd February 2010 at Patancheru and on 13th January 2010 at Kanpur. A 20-d early sowing date for Kanpur was chosen, as the crop duration in general is longer (by 20–30 d) at Kanpur compared to Patancheru; and thus the heat stress imposition is applied at the same phenological stage across locations. The maximum temperature reached the threshold level of 35°C at 27 days after sowing (DAS) in Patancheru while at 60 DAS in Kanpur (Fig. 1). Also the minimum temperatures were higher than 17°C after this stage at both locations. At the mean flowering time (52 DAS) in Patancheru, the maximum air temperature had reached to 39°C, while it was much less (31°C) at mean flowering time (56 DAS) in Kanpur.
Daily maximum and minimum temperatures (°C) during the late sown crop growing period both at Patancheru and at Kanpur in 2010. The 0 d or the sowing date was 2nd February 2010 at Patancheru and 13th January 2010 at Kanpur.

Variation in phenology in the reference collection accessions
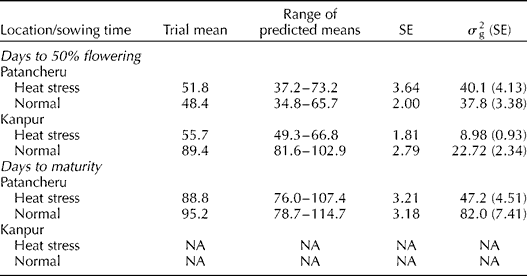
There were large and highly significant differences in flowering time of the accessions in both the sowing times and locations. All the genotypes tend to mature more or less close to each other, irrespective of their differences in flowering time at Kanpur. The overall means for each sowing time had shown that late sowing delayed the days to 50% flowering, while the days to maturity was hastened at Patancheru. However, both these stages were reached earlier with late sowing in Kanpur (Table 1). In terms of thermal time (growing degree days, °Cd) taken to reach mean flowering, it was 1094°Cd under normal sowing, while it was 1377°Cd under late sown condition at Patancheru. Such an increase in requirement of thermal time to attain any developmental stage by the higher soil moisture grown crop is well documented (Desclaux and Roumet, Reference Desclaux and Roumet1996; Krishnamurthy et al., Reference Krishnamurthy, Johansen and Sethi1999). However, this requirement was mainly to negate the irrigation-led cooling of the microclimate around the plants, which is shown to be about 10°C cooler soil temperature (Reddy et al., Reference Reddy, Reddy and Rao1989). At Kanpur, the late sown crop took 1032°Cd, and the normal sown crop took 1486°Cd. Providing optimum irrigation is known to extend the growth duration substantially in chickpea. The late sown crop at Patancheru received irrigations at 8–12 d intervals during the whole growing period, while the normal sowing crop was grown under residual moisture stress. Similarly, the crop at Kanpur received only three irrigations during the vegetative growth period. There was a large range of variation for flowering time under late sown conditions in Patancheru (37–73 d) as well as in Kanpur (49–67 d), leading to an increased level temperature exposure with the delay in flowering time leading to partial disadvantages of the later genotypes.
Trial means, range of BLUPs and analysis of variance of the 280 accessions of the reference collection of chickpea germplasm for days to 50% flowering and days to maturity in the field experiments during 2009–10 both at Patancheru and at Kanpur postrainy (normal) and summer (heat stress) seasons

BLUPs, best linear unbiased predicted means; NA, not available.
Influence of flowering time and normal sown yield on late sown yield
At Patancheru, seed yield under heat stress was negatively associated with the time to flowering (r 2 = 0.51***; significant above 0.001 level), while it was positively associated with the normal sown seed yields, considered here as potential normal yield (r 2 = 0.50***). Similar significant negative association with 50% flowering time (r 2 = 0.18***) and yield under normal sowing (r 2 = 0.09**) was also seen at Kanpur. Therefore, categorization of the accessions in terms of seed yield under heat stress for heat response would partly lead to a categorization for escape from heat and yield potential. Therefore, heat tolerance indices were computed to characterize the heat tolerance per se in this study, i.e. the proportion of the genetic variation for seed yield under heat that was not accounted for differences in time to flowering and yield potential.
Variation in yield and yield components
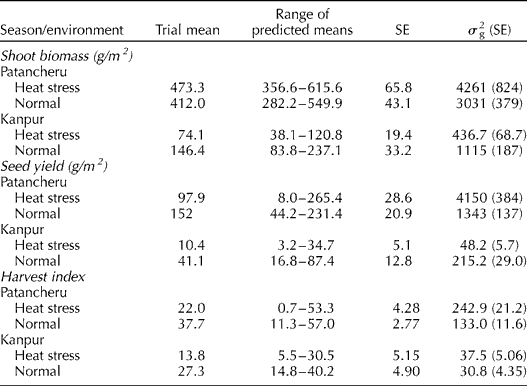
Between the two locations, the shoot biomass and yield produced in Kanpur were manifolds less than that at Patancheru. This was due to a combination of effects that did not promote a normal crop growth such as broader spacing practice, sandy and poor water holding nature of the soil, recently developed marginal land and receding soil moisture conditions during major reproductive growth with only three supplementary irrigations after sowing (Table 2). Under heat stress conditions in Patancheru, the shoot biomass produced was higher than the normal sown crop, as the heat-stressed crop was optimally irrigated, while the normal sown one was on receding soil moisture condition. However, mean seed yield of all the accessions was reduced to two-thirds. In Kanpur, the shoot biomass was reduced by half under heat stress, and the seed yield was reduced by one-fourth (Table 2). The overall harvest indices were lower under heat stress compared to the normal sown conditions, and it was higher in Patancheru in any of the sowing conditions.
Trial means, range of BLUPs and analysis of variance of the 280 accessions of the reference collection of chickpea germplasm for shoot biomass at maturity, seed yield and harvest index in the field experiments during 2009–10 both at Patancheru and at Kanpur post-rainy (normal) and summer (heat stress) seasons

BLUPs, best linear unbiased predicted means.
There were highly significant variations for the shoot biomass as well as seed yield across the accessions, and these variations were about two-fold for the shoot biomass at maturity at both heat-stressed and normal sown crops and many-fold for seed yield among the accessions again at both the sowing times tested (Table 2). There was a highly significant, large range of variation in harvest index in both the sowing times and locations. At Patancheru, the variance component for the HTI of accessions (0.585, SE 0.070) was highly significant, and the means ranged from − 2.5 to 2.7. Similarly at Kanpur, the variance component (0.298, SE 0.041) was highly significant for HTI, and the means ranged from − 0.7 to 1.9. The pooled analysis of data from both the locations had revealed that there were highly significant genotype effects and also equally significant genotype × location (G × E) interactions for all the characteristics that were studied except for one yield component, seeds per pod. In spite of this interaction, the rank correlation of the accession means between the location had indicated that 50% flowering (r = 0.51***), seed yield g/m2 (r = 0.60***), harvest index (r = 0.57***) and HTI (r = 0.27***) were closely related except for the shoot biomass production (r = 0.06NS).
Contribution of yield components
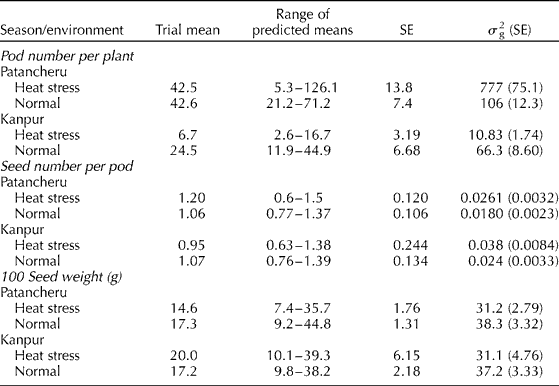
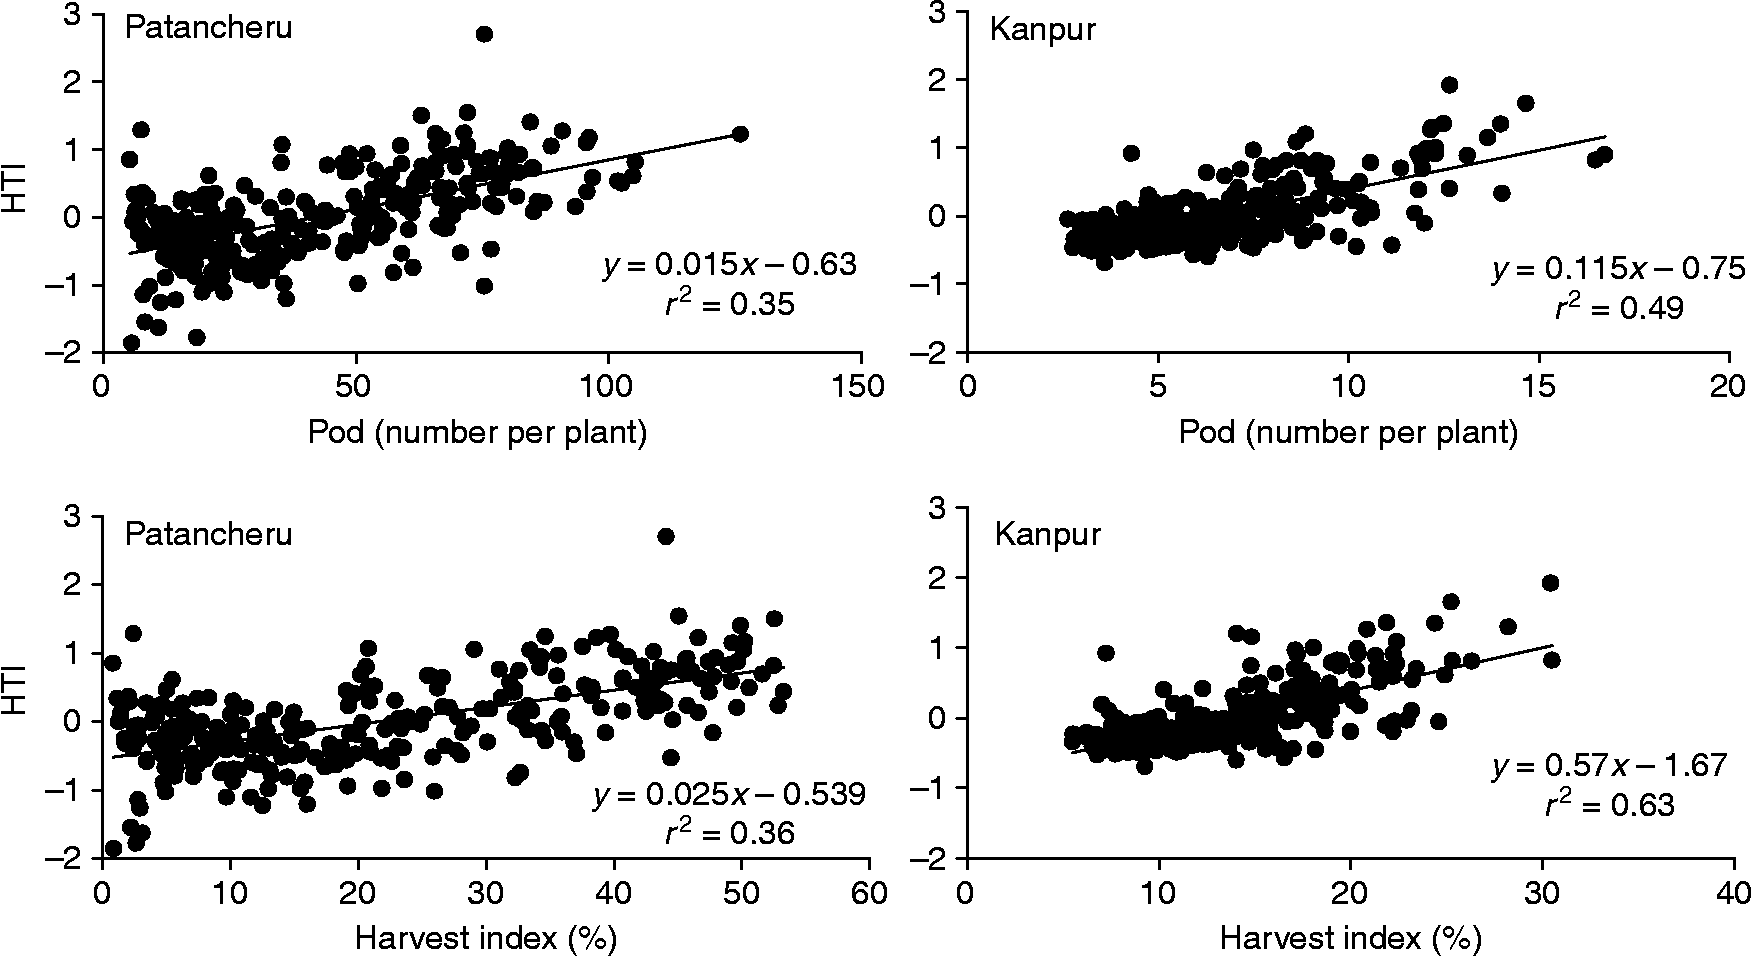
Among the yield components, pods per plant was the most affected by late sowing at Kanpur. Interestingly, late sowing did not impact pods per plant at Patancheru, potentially as a consequence of irrigation that was specific to the late sown plots (Table 3). The range in pod number per plant was large. Time to 50% flowering (representing earliness), shoot biomass at maturity, harvest index, pods borne on a plant and seed size were related either negatively or positively to the seed yield or the HTI to various degree, depending on the sowing time and the location (data not shown). However, the pod numbers per plant (r 2 = 0.81 at Patancheru and 0.64 at Kanpur) and harvest index (r 2 = 0.92 at Patancheru and 0.63 at Kanpur) were the two parameters that were very closely associated with the seed yield (figures not shown) and as a consequence with the HTI (Fig. 2) and other related characteristics. These relationships were very close in Patancheru than at Kanpur.
Trial means, range of BLUPs and analysis of variance of the 280 accessions of the reference collection of chickpea germplasm for pod number per plant, seed number per pod and 100 seed weight (g) in the field experiments during 2009–10 both at Patancheru and at Kanpur post-rainy (normal) and summer (heat stress) seasons

BLUPs, best linear unbiased predicted means.
Relationship of pod number per plant with the HTI and the harvest index (%) with the HTI both at Patancheru and at Kanpur.

Heat response categorization
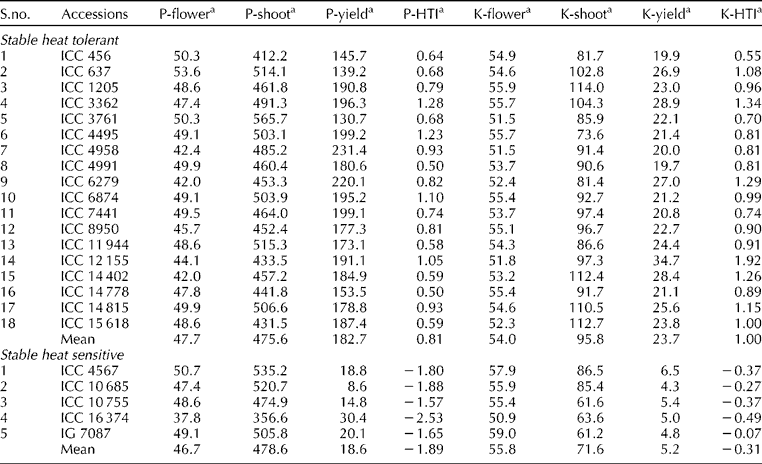
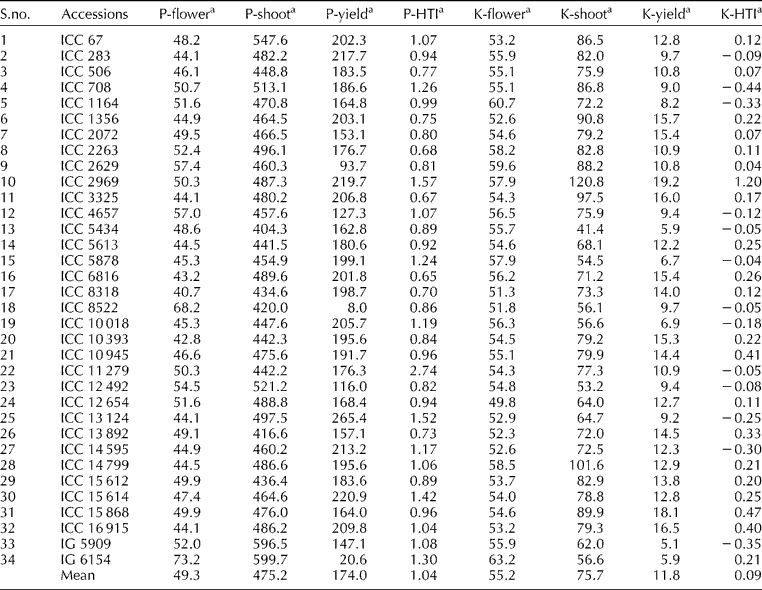
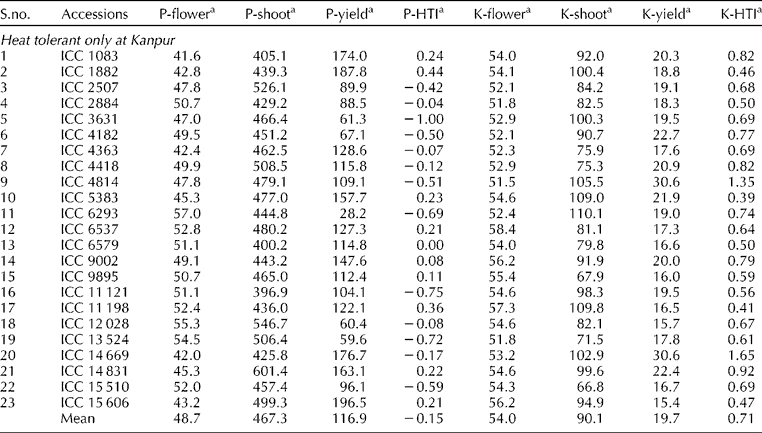
As there was a significant interaction between accessions and years, the HTI of the accessions was grouped into representative groups using the BLUPs for HTI by a hierarchical cluster analysis (using Ward's incremental sum of squares method), and this analysis yielded five clusters that differed significantly. Three accessions (ICC 2482, ICC 2593 and ICC 11 903) were tested in Patancheru but not in Kanpur, as three previously tested checks (ICC 5912, ICC 07 110 and ICCV 92 944) were included in their place. Thus, the common entries across locations, those were included in this clustering exercise, were 277. Based on the extent of cluster group means of the HTI, these were identified as (1) stable tolerant (with HTI means 0.81 in Patancheru and 1.01 in Kanpur), (2) tolerant only at Patancheru (1.04 and 0.09), (3) tolerant only at Kanpur ( − 0.15 and 0.71), (4) moderately tolerant (0.10 and − 0.18) and (5) stable sensitive ( − 0.71 and − 0.15). The stable tolerant group comprised of 18 accessions (Table 4), while the stable sensitive group comprised of 82 accessions out of the 277 used for clustering. For the sake of brevity, the data of five genotypes that were the most sensitive and made a sub-cluster with in the sensitive cluster are being presented (Table 4). The tolerant only at Patancheru group was comprised of 34 accessions (Table 5), while the tolerant only at Kanpur group was comprised of 23 accessions (Table 6) and the moderately tolerant group comprised 120 entries, respectively. ICC 14 778, a stable drought-tolerant entry, and ICC 4958, a well-known drought-tolerant genotype with high root mass (Krishnamurthy et al., Reference Krishnamurthy, Kashiwagi, Gaur, Upadhyaya and Vadez2010), have also ranked as stable heat-tolerant entries in this study (Table 4). Ten other entries that ranked as the next order drought-tolerant accessions in the previous work also appeared as stable heat-tolerant ones. Similarly, 13 stable sensitive entries also appeared in a previous drought tolerance assessment, and 11 of them were ranked to be moderately tolerant (data not shown).
Time to flowering, shoot and seed yield at maturity and heat tolerance indices of the consistently heat tolerant (stable in both locations) and five out of 82 consistently most heat-sensitive cluster group members of chickpea reference collection at Patancheru and Kanpur under heat stress during 2010 summer

a Flower, shoot, yield and HTI denote to days to 50% flowering, shoot biomass g/m2, seed yield g/m2 and heat tolerance index, respectively and the characters P and K stand for Patancheru and Kanpur, respectively.
Time to flowering, shoot and seed yield at maturity and heat tolerance indices of the heat tolerant only at Patancheru cluster group members of chickpea reference collection at Patancheru and Kanpur under heat stress during 2010 summer

a Flower, shoot, yield and HTI denote to days to 50% flowering, shoot biomass g/m2, seed yield g/m2 and heat tolerance index, respectively and the characters P and K stand for Patancheru and Kanpur, respectively.
Time to flowering, shoot and seed yield at maturity and heat tolerance indices of the heat tolerant only at Kanpur cluster group members of chickpea reference collection at Patancheru and Kanpur under heat stress during 2010 summer

a Flower, shoot, yield and HTI denote to days to 50% flowering, shoot biomass g/m2, seed yield g/m2 and heat tolerance index, respectively and the characters P and K stand for Patancheru and Kanpur, respectively.
Discussion
This work has established the existence of a large genotypic variation for heat response in the reference collection of chickpea germplasm that represents molecular diversity of global composite collection (Upadhyaya et al., Reference Upadhyaya, Dwivedi, Baum, Varshney, Udupa, Gowda, Hoisington and Singh2008). Delayed sowing for heat tolerance screening in chickpea proposed earlier (Gaur et al., Reference Gaur, Srinivasan, Gowda and Rao2007) was found to be effective in this study. Also, there are reports of successfully using a 2-month delayed planting than normal in a Mediterranean climate to increase the crop exposure to higher temperature with drier conditions and successfully screening 377 germplasm accessions to identify sources of tolerance (Canci and Toker, Reference Canci and Toker2009). With the current understanding of available variation, ICCV 92 944 is recognized to be one of the best available heat-tolerant sources based on the earlier empirical selections, but as this genotype is early, it is also thought to escape the heat stress. However, the yield levels of at least ten entries listed as stable ones in Table 4 did possess arithmetically more yields than those of ICCV 92 944 (183 ± 28.6 g/m2) at Patancheru, while 11 did possess significantly more yields (17.0 ± 5.1 g/m2) at Kanpur. Moreover, a major proportion of stable heat-tolerant accessions or accessions that performed well under Patancheru were also drought-tolerant genotypes listed in a recently published study (Krishnamurthy et al., Reference Krishnamurthy, Kashiwagi, Gaur, Upadhyaya and Vadez2010). Also, the initial screenings carried out by Dua (Reference Dua2001) indicate that not only drought-tolerant sources (ICCV 92 501–2) perform promisingly under high temperature but also some cold-tolerant sources (ICCV 88 512 and ICCV 88 513) also do perform good under heat, indicating that the tolerance mechanism can be common for both cold and hot temperatures.
Also these sources are expected to have much wider adaptability, as these were selected not simply on the basis of seed yield but by HTI that is to a large extent free from the advantages of yield potential and flowering time. These genotypes represent ideal materials for further characterization of underlying mechanisms of tolerance involved. For example, ICC 14 778 (Table 1), listed in this work as the stable heat-tolerant one, was also a top drought-tolerant accession (Krishnamurthy et al., Reference Krishnamurthy, Kashiwagi, Gaur, Upadhyaya and Vadez2010) that is known not only to yield high temperature under drought but also to maintain a cooler canopy temperature at peak pod-filling phase when many other selected drought-tolerant genotypes were relatively warmer (Kashiwagi et al., Reference Kashiwagi, Krishnamurthy, Upadhyaya and Gaur2008). There are possibilities of finding large number of common sources of tolerance for both heat and drought. Therefore, some of the selections made for heat-tolerant genotypes can also turn out to be good drought-tolerant genotypes, as demonstrated by ICC 4958 and ICC 14 778.
It was very clear that the pods produced per plant as indicated in previous works (Wang et al., Reference Wang, Gan, Clarke and McDonald2006), and as a consequence the harvest index, are the primary yield components that are affected by increased levels of heat stress. The reductions in shoot biomass and seed size also tend to be the consequences of drought stress, as it has happened in Kanpur in this study. Though it is necessary to understand the underlying mechanisms of tolerance, for simple and large-scale screenings, it may be adequate to select either for harvest index or for pod number when precise shoot biomass estimation becomes difficult.
Chickpea has been reported to be relatively sensitive in terms of membrane stability and photo system II function at high temperatures than other legumes such as groundnut, pigeon pea and soybean (Srinivasan et al., Reference Srinivasan, Takeda and Senboku1996). But within the cool season, legumes such as chickpea were found to have a higher critical temperature for heat tolerance than lentil, pea and faba bean (Malhotra and Saxena, Reference Malhotra, Saxena, Singh and Saxena1993) indicating this crop to be more amenable for adaptation to warmer environments.
Conclusions
Large genotypic variation was available among the reference collection of chickpea germplasm for heat tolerance that underlines the utility of the reference collection for applied breeding programme. These new sources of heat tolerance can be used for physiological and genetic studies and in heat tolerance breeding. Harvest index and pod number per plant are the two key traits that can be used in selections. The heritability of yield under heat stress environment was even better than the normal growing condition offering opportunity for direct selection of yield under optimally irrigated vertisols. The HTI represented a selection index devoid of the yield potential and phenology effects, and this index potentially offers a selection criterion for adaptation to higher temperatures valid across wider agro-ecological zones.
Acknowledgements
This work was funded by the Department of Agriculture and Cooperation, Ministry of Agriculture, Government of India through the Integrated Scheme of Oilseeds, Pulses, Oil palm and Maize. The technical help of Mr J. Shankaraiah, Research Technician, ICRISAT and Mr Raghubanshi Singh, Miss Rinki and Mr Pankaj Kumar Singh, IIPR, Kanpur in conducting the field experiments is sincerely acknowledged.