Introduction
Jumping plant-lice (Hemiptera: Psylloidea) comprise some economically important pests in agriculture, forestry and horticulture. The damage to the crop is inflicted directly by removal of plant sap or indirectly by acting as a vector of plant diseases (Burckhardt and Ouvrard, Reference Burckhardt and Ouvrard2012). Psyllids are pests on pistachio (Pistacia vera L.), e.g. Agonoscena pistaciae Burckhardt and Lauterer, Reference Burckhardt and Lauterer1989, native to the Middle East. In Iran, this is the most serious pistachio pest today (Mehrnejad, Reference Mehrnejad2000, Reference Mehrnejad2003). It is also a major pest in neighboring countries of Iran, such as Armenia, Iraq, Turkey, and Turkmenistan, and in the Mediterranean as e.g. in Greece and Syria (Burckhardt and Lauterer, Reference Burckhardt and Lauterer1989, Reference Burckhardt and Lauterer1993; Mart et al., Reference Mart, Erkılıç, Bolu, Uygun and Altin1995; Bolu, Reference Bolu2002; Souliotis et al., Reference Souliotis, Markoyiannaki-Printziou and Lefkaditis2002).
Agonoscena Enderlein, 1914 comprises 14 extant and one fossil described species in the Palaearctic, Oriental, and Afrotropical regions (Burckhardt and Lauterer, Reference Burckhardt and Lauterer1989; Malenovský et al., Reference Malenovský, Lauterer, Labina and Burckhardt2012). One species, Agonoscena succincta (Heeger, 1856), has been introduced into the New World on Ruta graveolens L. (Rutaceae). The following three species are known from Iran: Agonoscena bimaculata Mathur, 1973 developing on Pistacia atlantica Desf. and P. khinjuk Stocks (Anacardiaceae), A. pegani Loginova, 1960 on Peganum harmala L. (Nitrariaceae), and A. pistaciae on Pistacia atlantica, P. palaestina Boiss., P. terebinthus L. and P. vera (Burckhardt and Lauterer, Reference Burckhardt and Lauterer1989, Reference Burckhardt and Lauterer1993). Within the subfamily Rhinocolinae, Agonoscena is diagnosed by the presence of a subapical rhinarium on each of antennal segments 4‒9, the presence of a dark forewing pattern consisting of spots or transverse bands often forming a zig–zag pattern along the apical wing margin, parameres bearing a posterior lobe and the ventral valvulae of the female ovipositor being ventrally serrate (Burckhardt and Lauterer, Reference Burckhardt and Lauterer1989; Burckhardt and Basset, Reference Burckhardt and Basset2000). The species can be recognized by the forewing pattern and size, the structure of the male and female terminalia and the morphology of the last instar (Burckhardt and Lauterer, Reference Burckhardt and Lauterer1989). The morphological differences between species are often small and subtle making species identification difficult for non-specialists. It is not surprising that in the past, before the revisions of Hodkinson and Hollis (Reference Hodkinson and Hollis1981) and Burckhardt and Lauterer (Reference Burckhardt and Lauterer1989), species have often been confused: e.g. old records of A. succincta from Armenia, Tadzhikistan, and Turkey, and those of A. targionii from Iran concern, in fact, A. pistaciae (Burckhardt and Lauterer, Reference Burckhardt and Lauterer1989).
Deoxyribonucleic acid (DNA) barcoding is often an effective method for species identification (Hebert et al., Reference Hebert, Cywinska, Ball and deWaard2003a). Usually, the 5′-end of the mitochondrial cytochrome c oxidase subunit I gene, mtCO1, is used as a standard in DNA barcoding (Hebert et al., Reference Hebert, Ratnasingham and deWaard2003b), though it does not work properly in some taxa (Park et al., Reference Park, Foottit, Maw and Hebert2011). The mtDNA has been widely used for barcoding psyllids (Percy et al., Reference Percy, Butterill and Malenovský2016; Taylor et al., Reference Taylor, Fagan-Jeffries and Austin2016; Percy, Reference Percy2017; Martoni et al., Reference Martoni, Bulman, Pitman, Taylor and Armstrong2018). As the barcoding areas of mtDNA, mtCO1, and cytochrome b (cytb) are short (typically 472 bp for mtCO1 and 385 bp for cytb), they are easy to amplify and sequence successfully even when the DNA is fairly degraded.
Morphometrics is another useful technique for separating morphologically similar taxa (Burckhardt and Basset, Reference Burckhardt and Basset2000; Serbina et al., Reference Serbina, Burckhardt, Birkhofer, Syfert and Halbert2015). In geometric morphometrics, prior to the analysis of shape, the non-shape variation must be removed from the analysis and then graphical illustrations of the shape can be generated. Although most studies have focused on separating populations within a species, some have analyzed morphological similarities and differences between species (Gómez et al., Reference Gómez, Márquez, Gutiérrez, Conn and Correa2014; Mitrovski-Bogdanović et al., Reference Mitrovski-Bogdanović, Tomanović, Mitrović, Petrović, Ivanović, Žikić, Stary and Vorburger2014; Shamsi Gushki et al., Reference Shamsi Gushki, Lashkari and Mirzaei2018).
Modeling of the potential geographical distribution of species based on environmental factors of sites using predictive models is an important tool in conservation biology (Corsi et al., Reference Corsi, Duprè and Boitani1999), biogeography (Peterson and Holt, Reference Peterson and Holt2003; Solhjouy-Fard et al., Reference Solhjouy-Fard, Sarafrazi, Minbashi Moeini and Ahadiyat2013; Erfanfar et al., Reference Erfanfar, Sarafrazi, Ghanbalani, Ostovan and Shojaei2014), epidemiology (Peterson and Shaw, Reference Peterson and Shaw2003) as well as management of pests and diseases (Roura-Pascual et al., Reference Roura-Pascual, Brotons, Peterson and Thuiller2009; Lashkari et al., Reference Lashkari, Sahragard, Manzari, Hosseini and Erfanfar2013; Queiroz et al., Reference Queiroz, Majer, Burckhardt, Zanetti, Fernandez, de Queiroz, Garrastazu, Fernandes and dos Anjos2013; Shabani et al., Reference Shabani, Bertheau, Zeinalabedini, Sarafrazi, Mardi, Naraghi, Rahimian and Shojaee2013; Kumar et al., Reference Kumar, Neven and Yee2014; Bosso et al., Reference Bosso, Febbraro, Cristinzio, Zoina and Russo2016). Phillips et al. (Reference Phillips, Anderson and Schapire2006) introduced the maximum entropy method (Maxent) as a predictive model for predicting the geographic distribution of species, suitable for presence-only data sets.
As A. pistaciae is the economically most important pistachio pest in Iran, in addition to rapid and easy identification of specimens to control the species, biogeographical considerations are required for designing management strategies.
The aim of our study is (1) to use mtCO1 and cytb as DNA barcodes to provide an estimation of mitochondrial genetic distances between the Iranian Agonoscena species; (2) to use geometric morphometrics to find geometric characters diagnostic for each species and to detect sexual dimorphism in the three studied species; (3) to estimate the present and future potential geographical distributions of A. pistaciae in Iran; and (4) to determine the environmental factors affecting the potential distribution of this pest in Iran.
Materials and methods
Collection of specimens
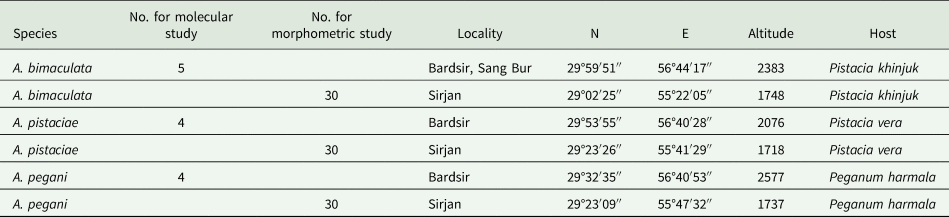
For the molecular study, psyllids were collected in two regions of the Kerman province, the major pistachio producing area in Iran and the world, during 2016 (table 1). Adults were collected with net and aspirator, transferred to 95% ethanol and stored at ‒20°C. GPS coordinates were recorded (table 1), and collection sites were mapped (fig. 1) using http://www.simplemappr.net. Four or five specimens were randomly chosen for each species for the molecular study (table 1).
Collection sites of three Agonoscena species: A. pistaciae, A. pegani, and A. bimaculata. See table 1 for details.

Number of specimens used for molecular and morphometric analyses (No.), geographic information of samples (locality name, geographical coordinates and altitude in m above sea level) and host name for three Agonoscena species, A. pistaciae, A. pegani, and A. bimaculata

For the morphometric study, adults of three Agonoscena species were collected in Sirjan (Kerman province, Iran) in 2015 (table 1). Thirty males and 30 females from each species were randomly selected, which is more than the number of variables in W matrix (Zelditch et al., Reference Zelditch, Lundrigan and Garland2004).
Species identification using characters of the male and female terminalia was confirmed by the second author.
DNA extraction and amplification
Genomic DNA was extracted from the material preserved in ethanol (from single specimens) using a DNA Extraction Kit DNP™ (SinaClon, Iran) according to the manufacturer's protocol.
Two mitochondrial gene regions, mtCO1 and cytb, were amplified as DNA barcodes (Percy et al., Reference Percy, Butterill and Malenovský2016). The polymerase chain reaction for mtCO1 and cytb genes follows those described in Percy et al. (Reference Percy, Butterill and Malenovský2016) under the following conditions: denaturation step of 3 min at 94°C, followed by 40 cycles of denaturation for 30 s at 92°C, annealing for 40 s at 50°C (mtCO1 gene) or 56°C (for cytb gene), and extension for 1 min at 72°C, followed by a final extension step of 10 min at 72°C. The primers were obtained to amplify mtCO1 and cytb genes in Simon et al. (Reference Simon, Frati, Beckenbach, Crespi, Liu and Floors1994) and Percy et al. (Reference Percy, Butterill and Malenovský2016), respectively (table 2). The primers used in polymerase chain reaction (PCR) amplifications were synthesized by Macrogen Inc. (Seoul, South Korea). Positive and negative controls were included in each run. All PCR amplifications for all genes were carried out using a TAdvanced 96 SG thermocycler (Biometra GmbH, Germany).
The primers used in PCR amplifications of mtCO1 and cytb genes

Purification and sequencing
All amplified fragments were electrophoresed through a 1.2% agarose gel in TAE buffer (pH 8.0) at 80 V for 1 h. The DNA was then stained with ethidium bromide and visualized under UV light. The PCR products were purified and sequenced by Macrogen Inc. (Seoul, South Korea). Sequences of mtCO1 and cytb are deposited in the GenBank database under accession numbers MG008889–MG008901 and MG008902‒MG008907, respectively.
Analysis of molecular data
The sequences of mtCO1 and cytb genes of the studied species were edited manually to remove primers using software BioEdit v.7.2.6. All nucleotide sequences were aligned using ClustalW in software MEGA X (Kumar et al., Reference Kumar, Stecher, Li, Knyaz and Tamura2018). All sequences were compared with sequences on GenBank using BLASTn (http://www.ncbi.nlm.nih.gov/blast/). Genetic distances were calculated using the maximum likelihood algorithm in software MEGA X (Kumar et al., Reference Kumar, Stecher, Li, Knyaz and Tamura2018). Using both genes, the species tree was calculated with software package MrBayes v3.2.2. Jmodeltest version 2.1.4 (Darriba et al., Reference Darriba, Taboada, Doallo and Posada2012) was used to determine the best fitting substitution model of evolution for each data set; Bayesian information criterion was used to select models (Schwarz, Reference Schwarz1978). Data were analyzed using Bayesian inference based on a Markov chain Monte Carlo approach in the software package MrBayes v3.2.2 (Ronquist et al., Reference Ronquist, Teslenko, Van Der Mark, Ayres, Darling, Höhna, Larget, Liu, Suchard and Huelsenbeck2012). Analyses was run for 10 million generations with sampling every 1000 generations and the first 25% of each analysis were discarded as burn-in. The run convergence was monitored by finding the plateau in the likelihood scores (standard deviation of split frequencies <0.0015) and the potential scale reduction factor approaching one.
Sequences of Psyllopsis fraxini (Linnaeus, 1758) (Hemiptera: Liviidae) (accession number: KU517187.1) and Pariaconus ohiacola (Crawford, 1918) (Hemiptera: Triozidae) (accession number: KY294469.1) were chosen as the out-groups for the analysis of mtCO1 and cytb genes, respectively.
Analysis of morphometric data
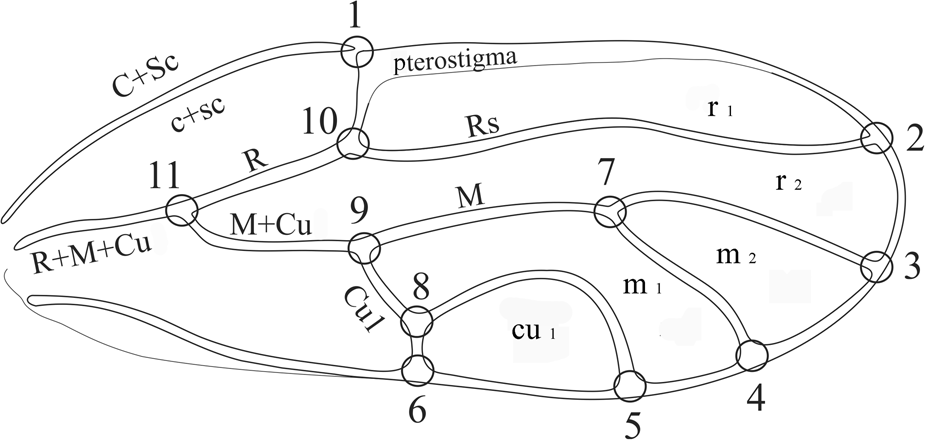
The right forewing was used for the geometric morphometric analysis. Microscopic slides were prepared and the photos were captured at 40 times magnification with a digital camera mounted on a microscope. In the analysis, a total of 11 homologous landmarks (Type 1) were digitized on the forewing photos by the tpsDig2 programme (fig. 2) (Rohlf, Reference Rohlf2016a). Then, the landmarks were aligned and analyzed using the tpsRelw programme (Rohlf, Reference Rohlf2010). After this, the shape variables, partial warp scores or PWs, were extracted and used to compare shapes among the forewings of the three species. Centroid sizes, as a size measure of forewings, were calculated by the tpsRelw programme (Rohlf, Reference Rohlf2010) and used to compare the wing size between the three species. One-way MANOVAs and ANOVA (with Tukey pairwise comparisons) procedures were designed in the SAS statistical programme to detect any significant differences in the wing shape and wing size among the three species. A regression of shape on size variables was designed to detect any allometric growth using the tpsReg ver.1.45 programme (Rohlf, Reference Rohlf2016b). Relationships among the three studied species were shown by the UPGMA (unweighted pair group method with arithmetic mean) clustering method using the NTSYSpc ver.2.10e programme (Rohlf, Reference Rohlf2000).
Position of landmarks (circles) on the right forewing of A. pistaciae. Positions of landmarks follow Lashkari et al. (Reference Lashkari, Sahragard, Manzari, Hosseini and Erfanfar2013).

Ecological niche modeling
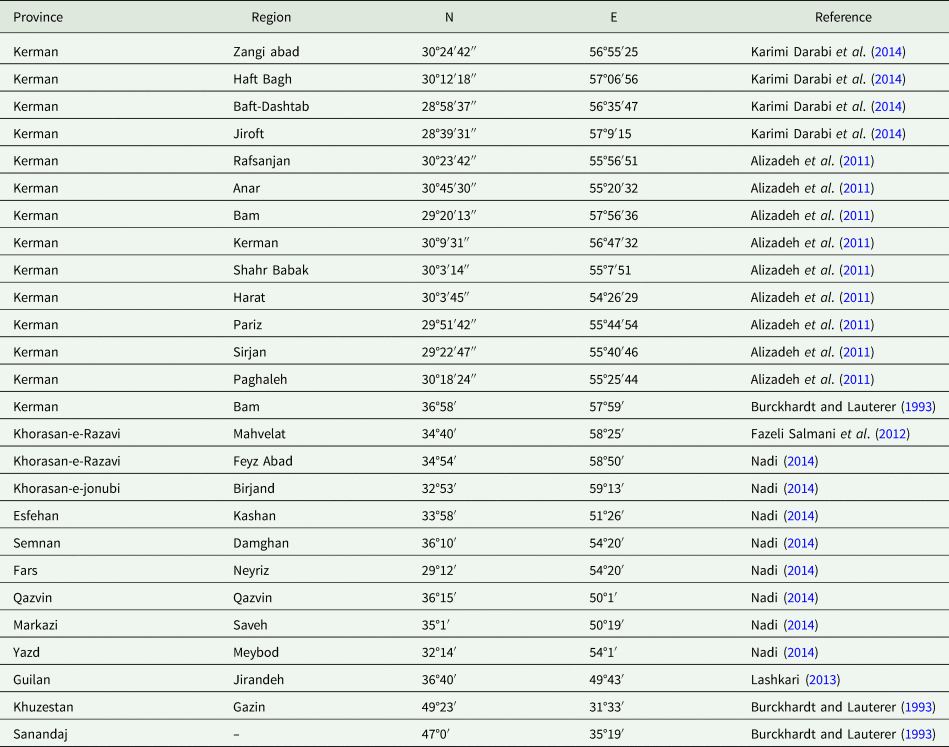
Distribution data of A. pistaciae in Iran were taken from the literature and from material collected by the authors. The 26 localities represent different climatic regions (table 3).
Collection sites of A. pistaciae in Iran with geographic coordinates and data source (reference) used in ecological niche modeling.

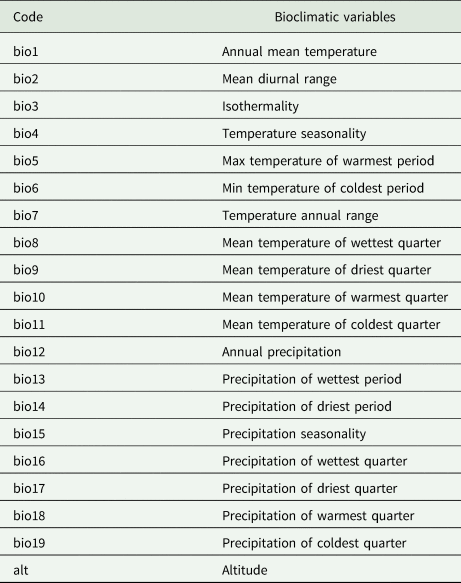
Ecological niche modeling using the software MaxEnt ver. 3.4.1 (Phillips et al., Reference Phillips, Dudík and Schapire2018) was applied to estimate the potential distribution of A. pistaciae in Iran for both current and future climatic scenarios. WorldClim with 19 variables of temperature and precipitation as well as altitude at 30′ (1 km2) resolution was used (table 4) (Hijmans et al., Reference Hijmans, Cameron, Parra, Jones and Jarvis2005). The same variables were also used to determine the effect of global climate change on the potential distribution of A. pistaciae in 2050, based on Global Climate Models, CSIRO-Mk3.0 with the A1B scenarios (Gordon et al., Reference Gordon, Rotstayn, McGregor, Dix, Kowalczyk, O'Farrell, Waterman, Hirst, Wilson, Collier, Watterson and Elliott2002). Finally, the model was evaluated with the area under the receiver operating characteristic curve (Graham and Hijmans, Reference Graham and Hijmans2006; Phillips et al., Reference Phillips, Anderson and Schapire2006). The area under the curve statistic (AUC) with a range from 0.5 to 1.0 was used to indicate model prediction occurrences and perfect predictions, respectively (Phillips et al., Reference Phillips, Anderson and Schapire2006). The contribution of each variable on the performance of the model was estimated (in percent) by Jackknife analysis (Peterson and Cohoon, Reference Peterson and Cohoon1999). The map with the potential distribution was prepared with ArcGIS 9.3.
Environmental variables used in ecological niche modeling of A. pistaciae in Iran

Results
Molecular study
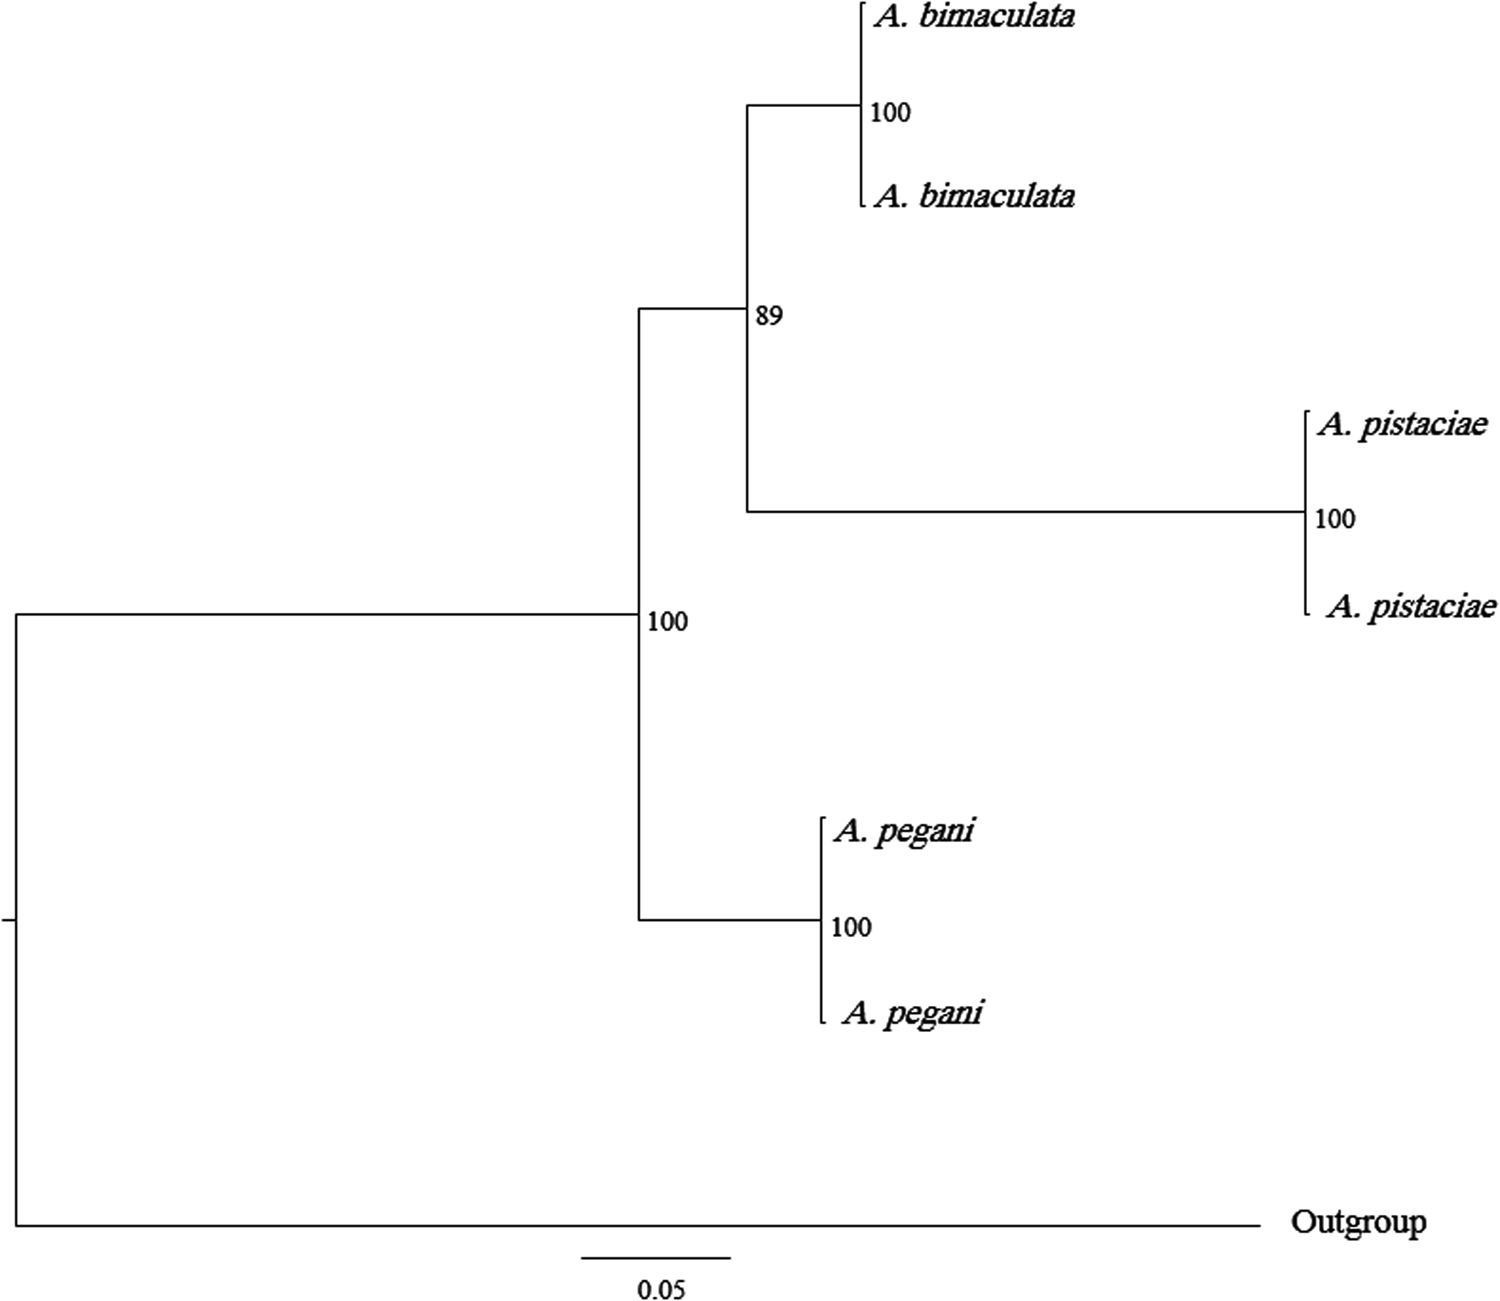
Both the genes studied were successfully amplified. Comparison of the sequences with those in GenBank revealed close sequence matches for all studied genes. The pairwise genetic distance based on the maximum composite likelihood showed that the mean intra-specific distance was 0.0000 within each species for all genes, while the mean inter-specific distance was greater between species, which is in agreement with the requirement for ideal DNA barcodes. In the mtCO1 gene, the maximum inter-specific distance was 0.0077 between A. pistaciae and A. pegani, while the minimum distance was 0.0025 between A. pistaciae and A. bimaculata. In the cytb gene, the maximum inter-specific distance (0.7091) was between A. pistaciae and A. pegani, and the minimum distance (0.3073) was between A. pistaciae and A. bimaculata. The tree of the clustering analyses obtained from MrBayes v3.2.2 is shown in fig. 3.
Bayesian gene tree of Agonoscena species based on mtCO1 and cytb genes sequences. Bayesian posterior probabilities (in %) are shown next to the node points. The scale bar represents the number of substitution per sites.

Morphometric study
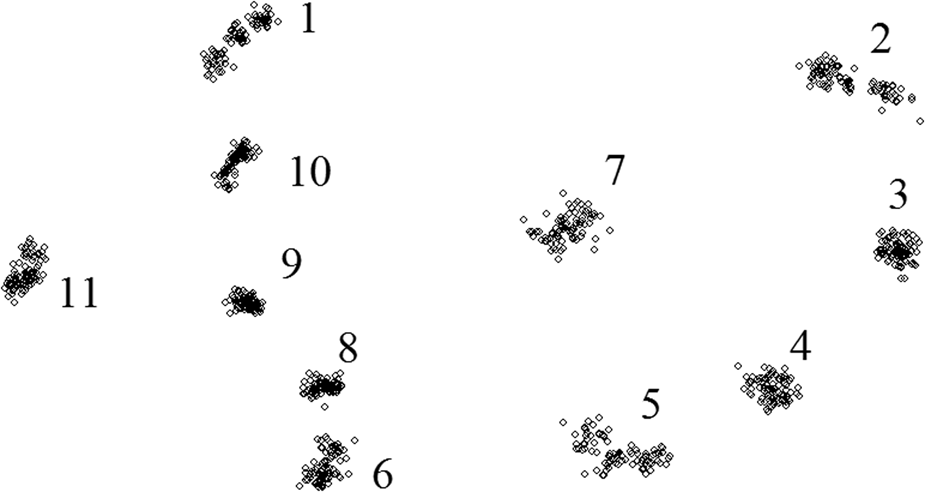
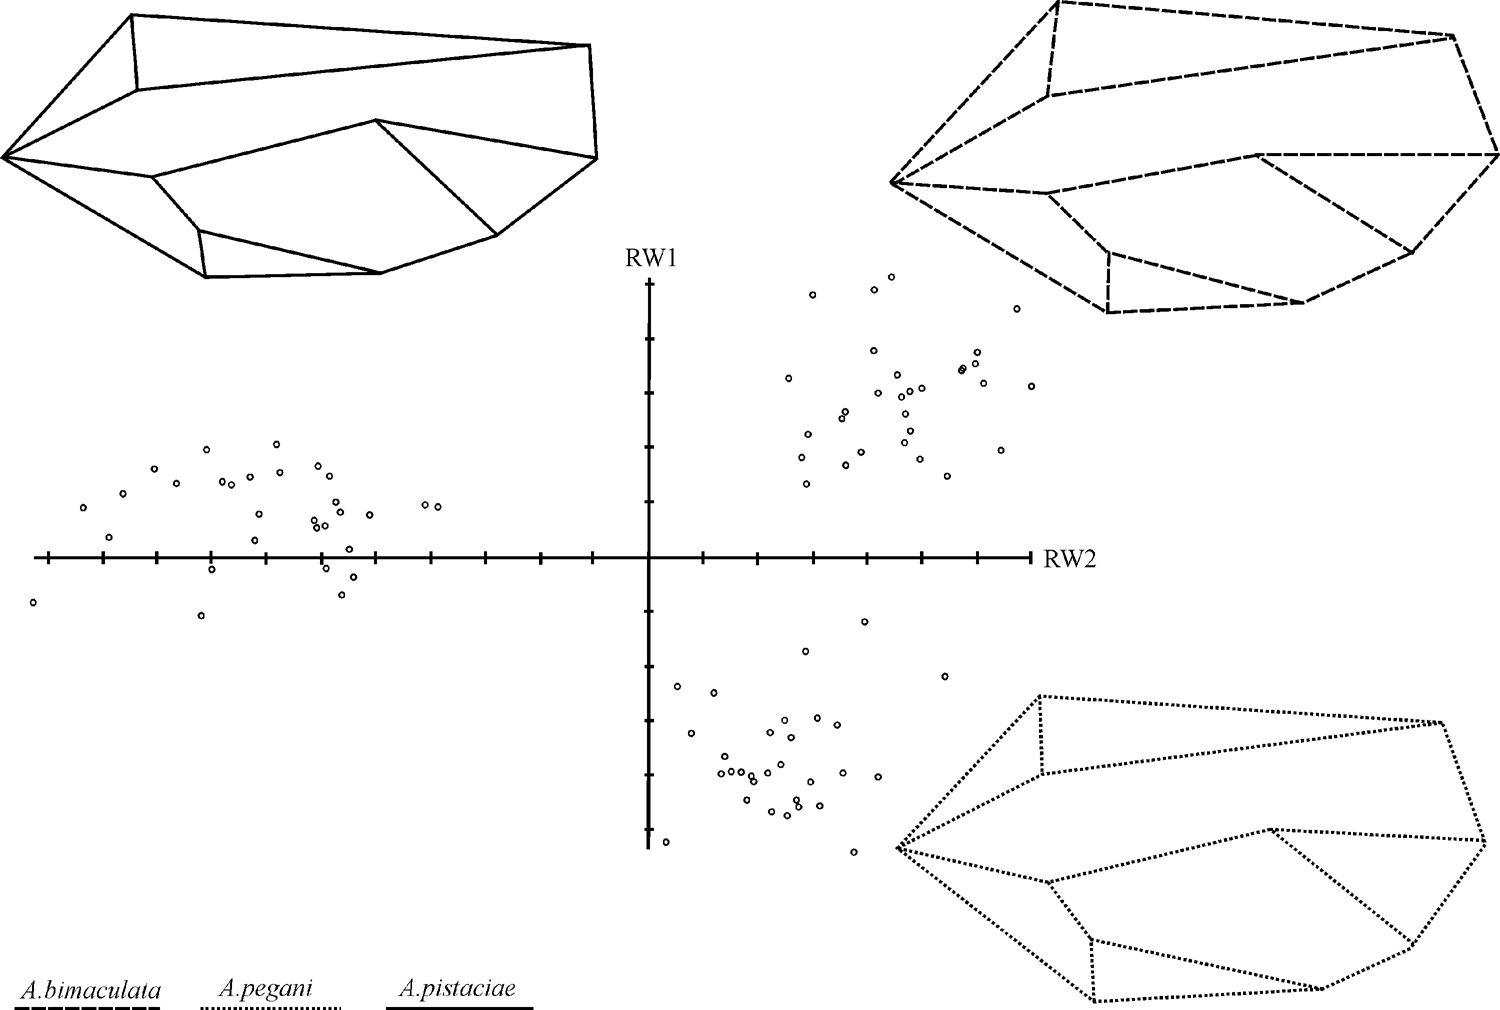
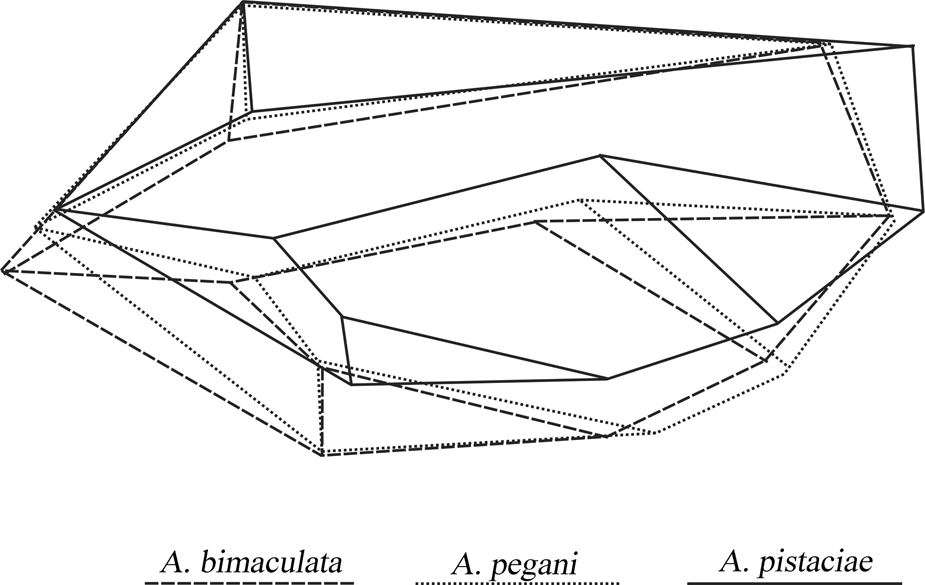
The superimposed landmarks on the forewing of the three Agonoscena species of the analyzed specimens showed considerable variation especially in landmarks 1, 2, 5, 6, and 7 (fig. 4). The plots of the partial warp score matrix are shown in fig. 5. The position of each specimen is shown along the relative warps axis. The superimposed forewings of the three Agonoscena species (fig. 6) showed that the forewings of A. pistaciae are narrower and longer than those of the other species, as well as vein Rs which is longer (landmark 1). A. pegani and A. bimaculata share a similar forewing width, but the forewing of A. bimaculata is longer.
Superimposed landmarks on forewing of the three Agonoscena species: A. bimaculata, A. pegani, and A. pistaciae.

Plots of the partial warp score matrix for the three Agonoscena species: A. bimaculata, A. pegani, and A. pistaciae.

Superimposed forewings of the three Agonoscena species: A. pegani, A. bimaculata, and A. pistaciae.

In the relative warp visualization plot (fig. 6), in A. pistaciae, landmark 7 (junction of veins M1+2 and M3+4) is closer to the fore than to the hind margin of the wing; and the distance between landmark 7 to the fore margin of the wing is about half the distance between landmark 7 and the hind margin of the wing. In the other two species, A. pegani and A. bimaculata, landmark 7 is located more to the middle of the wing, i.e. the distance between landmark number 7 and the fore margin of the wing is only slightly less than of distance between landmark number 7 and the hind margin. Comparing A. pegani and A. bimaculata, in the former, the distance between landmark 11 and 6 is longer than the distance between landmark number 11 and 1, whereas this distance is similar in the latter.
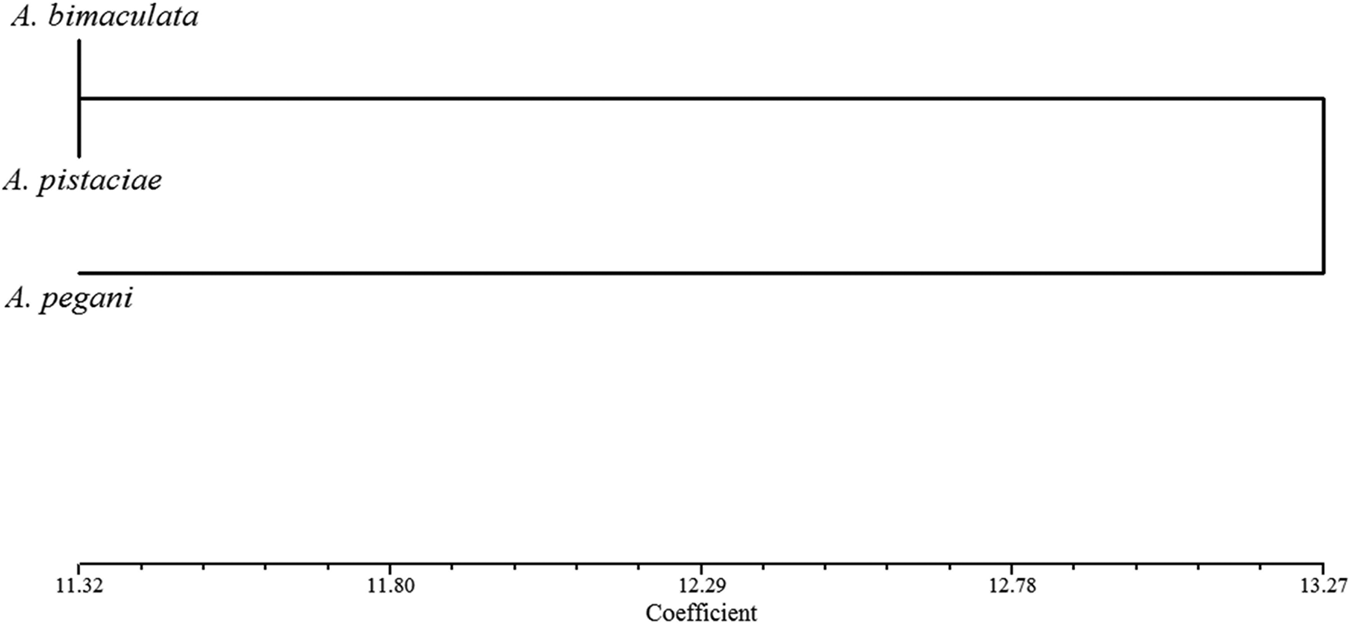
MANOVA showed a significant difference in the mean wing shape of the three species (table 5). In the UPGMA analysis, A. pistaciae and A. bimaculata clustered together and were placed distinctly from P. pegani (fig. 7).
Phenogram plotted by the UPGMA method based on the generalized distance matrix in the three Agonoscena species: A. pegani, A. bimaculata, and A. pistaciae.

The forewing shape and size with allometric growth test between sexes and species

**Significant at α = 0.01, *Significant at α = 0.05.
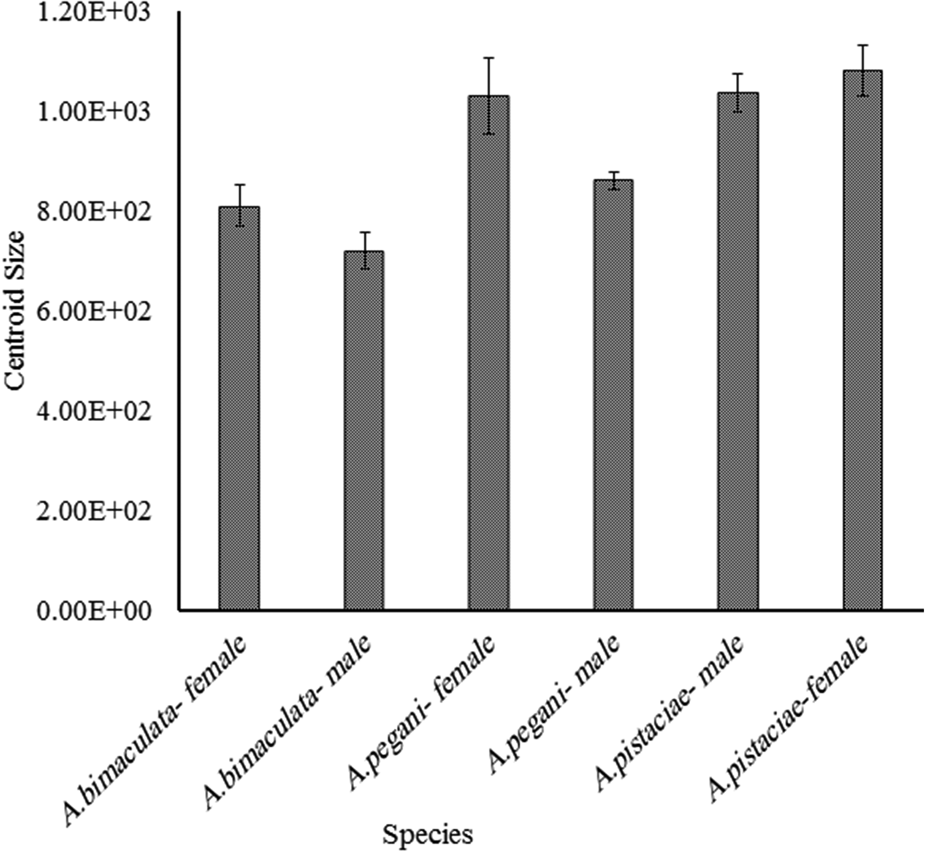
Wing size comparisons between the three studied species showed significant differences (table 5). Pairwise comparisons between the three species (using HSD post-hoc test, α = 0.01) showed that A. pistaciae had the largest and A. bimaculata had the smallest wings, whereas A. pegani was intermediate (fig. 8). In all species, females have larger wings than males (fig. 8).
Centroid size comparison of three Agonoscena species: A. pegani, A. bimaculata, and A. pistaciae.

The results showed isometric growth among the studied species (table 5). Therefore, the variation in the wing shape among the three species is not related to the size.
Key to species
1. Distance between landmark 7 (bifurcation of vein M) to fore margin about half as long as distance between landmark 7 to hind margin of forewing (fig. 6) A. pistaciae
– Distance between landmark number 7 (bifurcation of vein M) to fore margin slightly shorter than distance between landmark 7 to hind margin of forewing (fig. 6) 2
2. Distance between landmarks 11 (wing base) and 6 (apex of vein Cu1b) longer than distance between landmarks 11 and 1 (apex of vein R1) of forewing (fig. 6) A. pegani
– Distance between landmarks 11 (wing base) and 6 (apex of vein Cu1b) similar to distance between landmarks 11 and 1 (apex of vein R1) of forewing (fig. 6) A. bimaculata
Sexual dimorphism
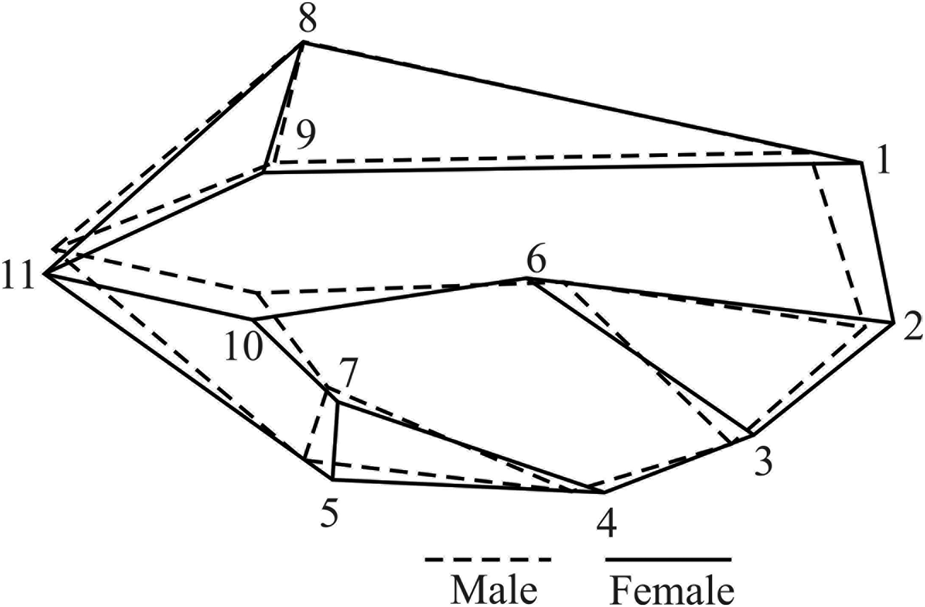
The forewing shapes in male and in female are similar in A. pistaciae and A. bimaculata but differ significantly in A. pegani (table 5). The forewings in females of A. pegani are longer than those in the males. The most significant variations in the wing shape are related to the veins R1 (landmark 1), Rs (landmark 2) and, to a lesser extent, M1+2 (landmark 3), which are longer in females (fig. 9). The forewing size differs significantly between sexes in all studied species (table 5). A regression showed no allometric growth between females and males of A. pegani (table 5, fig. 9). Therefore, the shape differences observed between the male and the female of A. pegani cannot be attributed to the size.
Superimposed forewings of male and female of A. pegani.

Ecological niche modeling
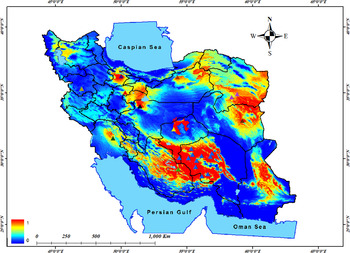
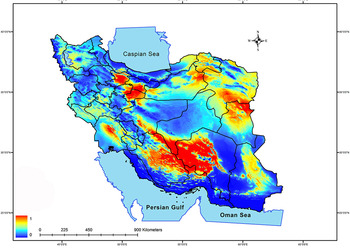
The potential distribution of A. pistaciae in Iran in the present predicted by MaxEnt is shown in fig. 10. According to this model, Eastern, Southern, and some parts of Central Iran provide the most suitable habitats for A. pistaciae, whereas Dasht-e-Kavir, Dasht-e-Lut, the coastal areas of the Caspian Sea, Oman Sea and Persian Gulf, the Alborz and Zagros Mountains and neighbouring regions are considered unsuitable. In other areas the potential occurrence is moderately likely (fig. 10).
Predicted potential distribution of A. pistaciae for the present. Probabilities 1 = high, 0 = low.

Based on the global climate change models (including CSIRO-Mk3.0 emission scenarios) for the potential distribution of A. pistaciae in 2050, the greatest difference appears in the central region, with the disappearance of a red area (high potential). The model also predicts a shift of the most suitable habitats from the Southeast and Centre westwards to the slopes of the Zagros Mountains (fig. 11).
Predicted potential distribution of A. pistaciae for the future. Probabilities 1 = high, 0 = low.

The most important variables influencing the species distribution are ‘min temperature of coldest period (Bio6)’, ‘mean temperature of coldest quarter (Bio 11)’ and ‘mean temperature of wettest quarter (Bio 8)’, contributing 21.97, 21.15, and 9.76%, respectively, to the model output.
The response curves for ‘min temperature of coldest period’ showed that areas with min temperature of about ‒2°C during the coldest period, mean temperature of about 8‒9°C during the coldest period, and mean temperature of about 6.5°C during the wettest quarter, had the highest predicted suitability. The AUC value was 0.898 that indicated a high level of accuracy for the model predictions.
Discussion
In both the molecular and morphometric studies, A. pistaciae and A. bimaculata cluster together supporting the morphology based phylogeny by Burckhardt and Lauterer (Reference Burckhardt and Lauterer1989).
The 5′ region of the mtCO1 gene serves as a good standard for barcodes in many taxa such as some insects (Hebert et al., Reference Hebert, Penton, Burns, Janzen and Hallwachs2004b; Hajibabaei et al., Reference Hajibabaei, Janzen, Burns, Hallwachs and Hebert2006), birds (Hebert et al., Reference Hebert, Stoeckle, Zemlak and Francis2004a), and fishes and amphibians (Ivanova et al., Reference Ivanova, Zemlak, Hanner and Hebert2007). In mammals, however, the cytb gene provides better results for separating species (Tobe et al., Reference Tobe, Kitchener and Linacre2010). A suitable genetic marker for species identification must be (1) a conserved region, (2) short enough to be sequenced in a single reaction, and (3) contain enough variability to be informative for identification (Nicolas et al., Reference Nicolas, Schaeffer, Missoup, Kennis, Colyn, Denys, Tatard, Cruaud and Laredo2012). The primers used in this study, which are effective for the studied species, were also used to sequence other psyllid taxa (Percy et al., Reference Percy, Butterill and Malenovský2016). Both studied genes, cytb and mtCO1, could be easily identified due to the presence of the above mentioned characters. Regarding the length of the sequences in this study (472 bp for mtCO1 and 385 bp for cytb), both genes could be sequenced in a single reaction. In our analyses, the cytb gene had a higher inter-specific variability. In the mtCO1 gene tree, A. pistaciae is paraphyletic with respect to A. bimaculata but in the cytb gene tree all three species are monophyletic. This means that cytb is suitable for diagnosing A. pistaciae. Although the mtCO1 appears to be less divergent, it still shows a very high support at the nodes and a different tree topology; so it can also separate the three psyllid species. Most studies on barcoding insect use mtCO1 as the DNA barcode (Hebert et al., Reference Hebert, Penton, Burns, Janzen and Hallwachs2004b; Hajibabaei et al., Reference Hajibabaei, Janzen, Burns, Hallwachs and Hebert2006; Ashfaq et al., Reference Ashfaq, Hebert, Mirza, Khan, Zafar and Mirza2014a, Reference Ashfaq, Hebert, Mirza, Khan, Mansoor, Shah and Zafar2014b, Reference Ashfaq, Prosser, Nasir, Masood, Ratnasingham and Hebert2015). Other genes such as cytb have not been considered in these studies.
The forewing shape in males and females is similar in A. pistaciae and A. bimaculata, but differs in A. pegani, where the wings are longer in females. Allometric tests showed that this difference is not related to size. Sexual dimorphism in the wing shape is also known from other psyllids, such as two species associated with ash, viz. Psyllopsis machinosus Loginova and P. repens Loginova (Shamsi Gushki et al., Reference Shamsi Gushki, Lashkari and Mirzaei2018). The more elongate forewings in the females of A. pegani may have better flight properties helping an efficient dispersal in search of new food sources. While A. pistaciae and A. bimaculata live on the perennial P. vera and P. khinjuk, Peganum harmala, the host of A. pegani, grows in Kerman only from early May to late July. The females of A. pegani have to migrate to other regions where the host is available. Bai et al. (Reference Bai, Dong, Guan, Xie and Xu2016) showed that populations of grasshoppers with longer wings display a better flight performance. Similarly, the more elongated wings in butterflies have a positive impact on longer spatial movements (Betts and Wootton, Reference Betts and Wootton1988). More biological studies on A. pegani are needed to test this hypothesis.
In their study of three Psyllopsis species using geometric morphometrics, Shamsi Gushki et al. (Reference Shamsi Gushki, Lashkari and Mirzaei2018) showed that the best characters to separate the three species are found in the apical half of the forewing, related to the veins Rs, M, M1+2 and M3+4. Similar results were obtained in the present study, where the differences concern mainly vein Rs as well as the distances between landmark 7 to fore and hind margin, and between landmarks 11 to 6 and 1. Geometric morphometrics has also been used to discriminate species in other insect orders, including Hemiptera (Aghagoli et al., Reference Aghagoli, Mozaffarian and Vafaei2013), Hymenoptera (Mitrovski-Bogdanović et al., Reference Mitrovski-Bogdanović, Tomanović, Mitrović, Petrović, Ivanović, Žikić, Stary and Vorburger2014), and Coleoptera (Zúñiga-Reinoso and Benítez, Reference Zúñiga-Reinoso and Benítez2015; Eldred et al., Reference Eldred, Meloro, Scholtz, Murphy, Fincken and Hayward2016).
Characterizing environmental conditions is the most common strategy for determining the potential geographic distribution of a species. According to our model, within Iran, some area in the East and South provide the most suitable climate for A. pistaciae (fig. 10). These areas are associated with arid climate, cold winters and warm summers. The results show that the temperature, especially cold periods of the year, is the most important factors for the occurrence of the pest. The potential presence in the coastal area of the Caspian Sea is low, due to high humidity and low winter temperatures, going down to ‒7 to 13°C in some years. Our results are consistent with Mehrnejad's study (Reference Mehrnejad2003) listing temperature and moisture as two important factors in the biology of pistachio psyllids. He showed that they start to develop at 10°C and that they tolerate high temperatures (35°C) reflected in a sharp increase of the population. High-relative humidity has a negative influence on the development of pistachio psyllids. Relative humidity above 65% can reduce the growth rate of this pest (Mehrnejad, Reference Mehrnejad2000). A similar potential distribution in the south of Iran has the Asian citrus psyllid, Diaphorina citri Kuwayama, in the Maxent model (Lashkari et al., Reference Lashkari, Sahragard, Manzari, Hosseini and Erfanfar2013).
Other limiting factors may affect the distribution of this pest in the newly predicted areas. The species probably does not colonize areas where (1) the host plants are in low density or (2) the preferred host plants are absent. Three Pistacia species, P. vera, P. mutica, and P. khinjuk, are present in Iran (Khatamsaz, Reference Khatamsaz1989) and long and warm summers are suitable for them (Esmail-pour, Reference Esmail-pour, Padulosi and Hadj-Hassan1998). The main growing areas of P. vera are located in the east and south-east. Interconnected growing areas have suffered a large increase in the pest populations, furthering dispersal of the pest. In the newly predicted areas, especially in the west, P. mutica and P. khinjuk are widely distributed. Although, the pest sometimes occurs on P. mutica in the Kerman province (e.g. Meymand), it does not seem to build up large populations, due to the predominance of the less-preferred host. The monitoring of the population density of A. pistaciae is, therefore, necessary in the newly predicted areas.
Acknowledgements
We thank Dr Azadeh Habibi (Graduate University of Advanced Technology, Kerman, Iran) and Dr Diana M. Percy (Department of Botany, University of British Columbia, Vancouver, Canada) for technical advice, as well as Dr Dalva L. de Queiroz (Embraba Florestas, Colombo, PR, Brazil) and an anonymous reviewer for constructive comments of previous manuscript versions. Financial support (No. 95.1827) from the Institute of Science and High Technology and Environmental Sciences, Graduate University of Advanced Technology, Kerman, Iran, is gratefully acknowledged.