Implications
Automatic carcass grading using video image analysis (VIA) has several advantages over subjective grading, providing objective and consistent classification, and reducing labour at the slaughter line. In this study, the VIA technique was used to classify lamb carcasses according to the EUROP classification system and estimating the lean meat yield of Icelandic lambs. The results show that the use of VIA provides an opportunity for the sheep industry to use lean meat yield as an indicator of lamb carcass quality, and EUROP classification scores can be predicted with sufficient accuracy using this method.
Introduction
Objective carcass grading has been the subject of many studies in recent years (Berg et al., Reference Berg, Forrest, Thomas, Nusbaum and Kauffman1994; Hopkins, Reference Hopkins1996; Allen and McGeehin, Reference Allen and McGeehin2001). In the lamb meat industry, the focus has been on the video image analysis (VIA) technology as a fully automatic carcass grading system. VIA systems for lamb carcass grading have been developed in a few countries such as Canada (Brady et al., Reference Brady, Belk, LeValley, Dalsted, Scanga, Tatum and Smith2003), Germany (Rius-Vilarrasa et al., Reference Rius-Vilarrasa, Bünger, Maltin, Matthews and Roehe2009) and Australia (Hopkins, Reference Hopkins1996). Carcass grading in Iceland is based on the EUROP system where carcasses are classified according to a visual conformation score and a fat score, based on the GR measure (total tissue depth over the 12th rib, 11 cm from midline). The grading system forms a basis for lamb meat prices. Interest in the objective grading of carcasses led to the installation of the Australian VIA technology, VIAscan®, at the KS abattoir in North Iceland in the autumn 2006. Trials were undertaken with the objective of calibrating the VIAscan® system to predict lean meat yield in the whole carcass (LMY%) and EUROP score of Icelandic lamb carcasses. Classification of lamb carcasses according to the EUROP system had not been previously tested by VIAscan®. Fully automatic classification of lamb carcasses using the VIA technology has been studied in Australia (Hopkins et al., Reference Hopkins, Safari, Thompson and Smith2004) and the United Kingdom (Rius-Vilarrasa et al., Reference Rius-Vilarrasa, Bünger, Maltin, Matthews and Roehe2009), and is used commercially by the industry in New Zealand and Australia. However, this has not been attempted before in Icelandic abattoirs, and therefore this project was undertaken to evaluate an objective method of carcass classification compared with the visual EUROP scores currently used.
The aims of the study were:
-
1. To compare the accuracy of the VIAscan® with that of expert classifiers and plant assessors in classifying lamb carcasses according to the EUROP system.
-
2. To compare the ability of the EUROP classification scores obtained by the VIAscan® and the current grading system to explain the variation in lean meat yield (LMY%) and amount of trimmed fat in the carcass (FAT%).
-
3. To develop and evaluate regression equations for predicting lean meat yield in lamb carcasses using the VIAscan® and the EUROP scores.
Material and methods
Animals
All lambs were purebred ram and ewe lambs of the Icelandic breed. Most lambs were born in April or May and were thus 5 to 6 months old at slaughter. The lambs were slaughtered under commercial conditions at the KS abattoir in Sauðárkrókur. Carcass selection for the study was made at the end of the slaughter line, with the objective of representing both the variation in EUROP classes and weight. The trials were carried out during the normal slaughter season in September and October of both 2006 and 2007.
The VIAscan® equipment
The VIAscan® unit was installed before the classifiers’ station at the end of the slaughter line that operated at the average speed of 5.2 carcasses/min. The unit consists of a large cabin that the carcasses pass at line speed. A digital camera takes a picture of the dorsal view of the carcass and the digital image is analysed further by special computer software. The software takes about 110 measurements of the carcass, including length, width, curves and angles of different carcass parts, as well as ratios between some measures. The fat depth and distribution is estimated from colour measurements of six rectangles, two over each of the lumbar, thoracic and shoulder region. Further description of the VIAscan® system is given by Hopkins et al. (Reference Hopkins, Safari, Thompson and Smith2004).
The EUROP system
The current Icelandic grading system is based on the EUROP classification system (European Community, 1992) and carcass weight, where carcasses may be classified into 15 classes for both conformation and fatness (Johansen et al., Reference Johansen, Aastveit, Egelandsdal, Kvaal and Røe2006). The system in Iceland makes use of five conformation classes (E, U, R, O and P), where E denotes excellent and P stands for poor conformation, and six fat classes (1, 2, 3, 3+, 4 and 5), where 1 denotes very lean and 5 excessively fat carcasses (The Ministry of Fisheries and Agriculture Reykjavík 2010). The EUROP scores were transformed into numerical scores based on the original 15-point scale as follows: conformation classes: E=14, U=11, R=8, O=5, P=2; fat classes: 1=2, 2=5, 3=8, 3+=9, 4=11, 5=14. The fat score is based on the GR measurement (tissue depth over the 12th rib, 11 cm from the midline) with a defined tissue depth range (mm) for each fat class. The GR is measured manually by a digital fat thickness probe designed specifically for sheep carcasses called the ICEMEAT GR Probe (Einarsdóttir, Reference Einarsdóttir1998). The EUROP scores predicted by the VIAscan® were obtained from a separate multiple regression analysis derived from a data set of 1828 carcasses collected during 2006, which also included a subset (284) of the deboned carcasses used in the current study. All carcasses were classified by the same expert classifier across both years of the project.
Data
Classification trial
A total of 720 undamaged carcasses were selected at random at the end of the slaughter line, after they had been assessed by the VIAscan® and plant classifiers. The carcasses were subsequently reclassified independently by three expert classifiers. Each expert classifier measured the tissue depth at the GR site on the hot carcasses with a grading probe (ICEMEAT GR Probe) and classified according to the EUROP system. Subsequently, the carcasses were mixed up, renumbered and classified again. The GR was only measured on the hot carcasses, and therefore the initial GR measured by each classifier was tagged to the carcass throughout the trial. At the conclusion of a trial session, the three expert classifiers jointly made a final EUROP score for all the carcasses. The distribution of the carcasses across the EUROP classes is shown in Supplementary Table S1. The trial was repeated six times during 2007, on 4 days in September and 2 days in October, with 120 carcasses assessed each time. The VIAscan® was not able to assess all the carcasses because of the poor carcass presentation (e.g. rotated and twisted carcasses), resulting in a final data set of 696 carcasses. A subset of the carcasses used in the classification trial was also part of the deboning data set (258 carcasses).
Deboning data
The boning trial was carried out over 2 years and included 862 carcasses (284 in 2006 and 578 in 2007) that were deboned by the two boning teams in both years. Each team included four boners/trimmers that dissected and trimmed the whole carcass. Between the years, the boning teams were different; however, oversight of the trial was consistent throughout the project to ensure that carcass preparation and cutting lines were consistent. Each carcass was broken down into three primal regions: hind legs, saddle and forequarters. The hind legs were separated from the saddle at the mid-length of the sixth lumbar vertebrae, and the saddle and forequarter were separated between the fourth and fifth ribs. Each primal cut was subsequently separated into lean meat (including lean trim), bone and trimmed fat from the legs, loins (saddle) and shoulders (forequarters), respectively. The carcass breakdown and trimming was carried out as described by Hopkins et al. (Reference Hopkins, Safari, Thompson and Smith2004), except for the treatment of flanks, as the boneless flanks (untrimmed) were included with the lean of the loin. Correlation analysis of the data showed that the weight of the loin (including flanks) had a stronger correlation to fat content than lean in the carcass (Einarsson E., unpublished information), and it was therefore decided to exclude the flanks from the loin in the data analysis. The cold carcass weight was thus divided into lean (boneless cuts trimmed to 6 mm of subcutaneous fat), trimmed fat, bone and boneless flanks. Boning consistency and repeatability between and within the boning teams was monitored by splitting a subsample of carcasses and dividing the sides between boning teams to test for systematic differences. The lean yield of each primal region (Shldr%, Loin% and Leg%) was defined as the weight of lean meat obtained from each cut after deboning and trimming, presented as a proportion of cold carcass weight. LMY% was defined as the total weight of lean meat, obtained from all three primal regions presented as a proportion of cold carcass weight. FAT% was defined as the total weight of trimmed fat from all three primal regions, presented as a proportion of cold carcass weight.
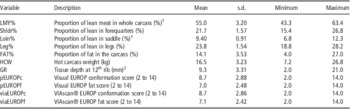
Table 1 presents the descriptive statistics of the deboning data set. The EUROP score and GR measure of all carcasses in the deboning data set were derived by one expert classifier. The distribution of the deboned carcasses across the EUROP classes is shown in Supplementary Table S2.
Description, mean, standard deviation (s.d.) and range of the variables in deboning data set (n=862)

1 Flanks excluded.
2 n=854.
Statistical analysis
Classification trial
The EUROP score of the VIAscan® was compared with the 5/6-point EUROP score of the three expert classifiers and the plant assessors. The proportional agreement between VIAscan® and each classifier was calculated as the percentage of carcasses that received the same scores for fat and conformation, respectively. The final scores given jointly by all three classifiers and the plant assessors were compared with the VIAscan® scores in the same manner.
Prediction of LMY% and FAT% from EUROP scores
The deboning data set was used to evaluate the variation in LMY% and FAT% using the EUROP scores as explanatory variables, obtained from both the VIAscan® and the current system, respectively. The EUROP scores were used as class variables in this analysis. The data were analysed by the GLM procedure (PROC GLM) in SAS, using the model:
 $$\eqalignno{Y_{{ijk}} =\ \mu {\plus}F\_class_{i} {\plus}C\_class_{j} {\plus}e_{{ijk}}$$
where Y ijk represents LMY% or FAT% according to boning results, µ the overall mean, F_class i (i=2, 5, 8, 9, 11, 14) and C_class j (j=2, 5, 8, 11, 14) represent fat and conformation classes, respectively, from both classification methods. A second model including the GR and hot carcass weight (HCW) was used for comparison:
 $$\eqalignno{Y_{{ijk}} =\ \mu {\plus}F\_class_{i} {\plus}C\_class_{j} {\plus}b_{{\rm 1}} \left( {{\rm GR}_{{ijk}} } \right) \cr {\plus}b_{{\rm 2}} \left( {{\rm HCW}_{{ijk}} } \right){\plus}e_{{ijk}}$$
where F_class and C_class represent classification results from the current system, and b 1 and b 2 are the linear regression coefficients on GR and HCW, respectively. Least square means of LMY% were compared between conformation classes within fat classes after being adjusted according to the Tukey–Kramer method to ensure the overall significance level of P<0.05.
Regression analysis of deboning data for prediction of lean yield
The lean meat proportions of each primal region were adjusted for significant differences between boning teams by comparing results from the left and right sides of carcasses that were deboned by two teams. Significant differences were observed for Shldr% and Leg% but not for Loin%. The deboning data (n=862) were divided into two data sets by a stratified random selection, within the years for a given boning team: a calibration data set, with 70% of the data (n=603); and a validation data set, with 30% of the data (n=259). The percentage of lean meat in each of three primal regions was estimated based on regression analyses of the calibration data set. The performance of each model was assessed according to the root mean square error (RMSE), indicating the model precision and coefficient of determination (R 2) indicating the accuracy. For each primal region, four models were assessed for their ability to predict the percentage of lean within the leg, loin and shoulder. Two VIAscan® regression models were developed based on the raw variables (model 1) and another based on their principal components (PC) along with individual ratiometric and colour profile measurements (model 2). The PCs summarised separate groups of common VIAscan® variables, namely, colour, areas and widths. The models selected by the stepwise procedure were checked for interdependence of predicting variables and rerun after removing those that were highly dependent on other variables in the model, until an apparently stable model was obtained. The models were subsequently recalculated on the validation data set to assess the stability of the variables and accuracy transportability. In case of models with more than one variable being insignificant in the validation data set, the model was revised and a new model was developed with a better fit. Bootstrapping methods were used to confirm significant contribution of all parameters to the final regression models, running 1000 replicates of each regression model. A similar methodology was also used by Hopkins et al. (Reference Hopkins, Safari, Thompson and Smith2004). A further two prediction equations were derived from the calibration data set based on the standard carcass measurements recorded within Icelandic abattoirs. The EUROP model was based on the current EUROP system using the model (b) described above. The ‘HCW+GR’ model was derived solely from the HCW and GR tissue depth. The transportability of the equations derived from the calibration data were assessed by predicting the lean yield of the primal regions in the validation data set as well as the LMY% of the whole carcass, using the sum of the predicted primal yields. The transportability of the model’s prediction ability was evaluated by the RMSE, R 2 and the level of prediction bias. The analysis focused on the prediction of lean meat yield, as this is the main determinate of the carcass value and potentially would be a key component of a value-based marketing system for the Icelandic lamb industry. All statistical analyses were performed using the SAS program package (SAS Institute, Inc., 2004).
Results
Classification trial
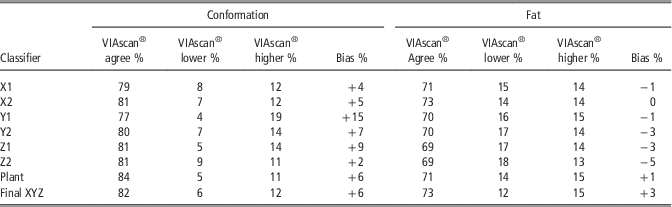
The comparisons of EUROP scores between the VIAscan®, the three expert classifiers (working individually), the plant classifiers and the final assessment of the three expert classifiers are shown in Table 2. The agreement level between VIAscan® and the individual classifiers was in all cases higher for conformation than for fat classes and ranged from 77% to 84%, and the agreement to the final assessment was 82%. There was an overall tendency of the VIAscan® to overpredict conformation class with a bias from +2% to +15% (average +6.75%). The level of agreement in fat classification ranged from 69% to 73%, and the agreement to the final assessment was 73%. The bias here was small, ranging from −5% to +3%. The observed difference between VIAscan® and the final assessment was in all cases within one class, with an exception of one carcass.
Agreement and biasFootnote 1 of VIAscan® compared with three expert classifiers (X, Y and Z), first (1) and second (2) assessment, plant assessors (plant) and final assessment of the expert classifiers (Final XYZ) for EUROP conformation and fat score of 696 carcasses
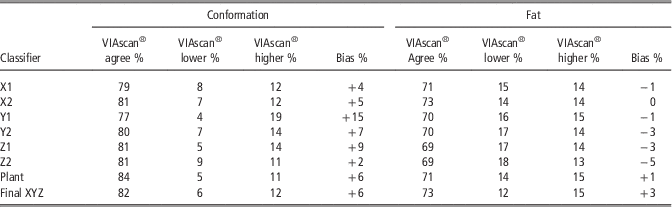
Percentages are rounded to the nearest whole number.
1 Bias=proportion of carcasses underestimated or overestimated by VIAscan®.
The average conformation score from VIAscan® was not significantly different from the average score of the final assessment. The only significant difference found was between VIAscan® and classifier Y1, but this average score was also significantly lower than the final assessment. There were no differences found at the 5% significance level between fat scores.
Prediction of LMY% and FAT% from EUROP scores
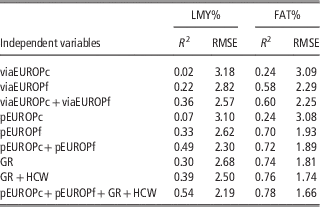
The current EUROP classification explained more of the variation in LMY% than the EUROP classification obtained by the VIAscan® (Table 3). Conformation classes from both the systems had very low predictability of the LMY% and explained only 2% (viaEUROPc) and 7% (pEUROPc) of the variation. When the fat class (viaEUROPf and pEUROPf) was added to the model, the R 2 increased markedly to 36% and 49%, respectively. The addition of HCW to the EUROP models in Table 3 had almost no effect, neither as a predictor of LMY% nor FAT% (not shown). Conformation classes (viaEUROPc and pEUROPc) were still significant (P<0.001) in both the models that included fat class and HCW.
Coefficients of determination (R 2) and root mean square error (RMSE) values for the prediction of lean meat yield (LMY%) and fat (FAT%) in the carcass using different models based on the deboning data set (n=862)
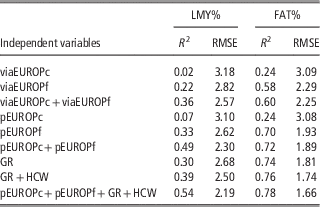
viaEUROPc=EUROP conformation class of VIAscan®; viaEUROPf=EUROP fat class of VIAscan®; pEUROPc=conformation class of the current grading system; pEUROPf=fat class of current grading system; GR=tissue depth over 12th rib; HCW=hot carcass weight.
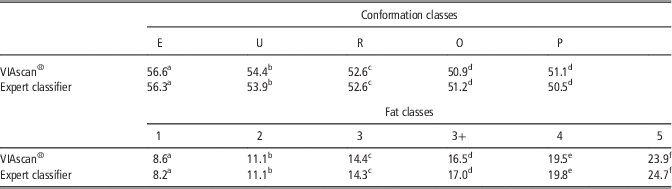
The best single predictor of FAT% was the GR measure. The model including EUROP classes, GR and HCW was slightly more accurate than the model containing only GR and HCW. The EUROP fat score given by the expert classifier explained more of the FAT% than the fat score of the VIAscan®. The conformation scores of both the VIAscan® and the expert grader were useful variables in predicting FAT% and were equally accurate. Significant differences (P<0.01) in LMY% were found between all conformation classes, except between classes O and P for both the VIAscan® and the expert grader (Table 4), and similarly the FAT% was significantly different between all fat classes.
Least square means for lean meat yield (LMY%) in each conformation class (E, U, R, O, P) within fat classes and fat proportion (FAT%) in each fat class (1, 2, 3, 3+, 4, 5) within conformation classes, classified by VIAscan® and one expert classifier
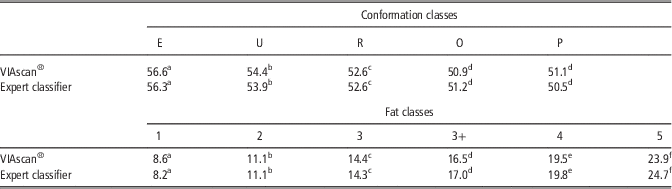
Mean values with different superscripts in each line are significantly different (P<0.01).
Prediction of lean yield from VIAscan®
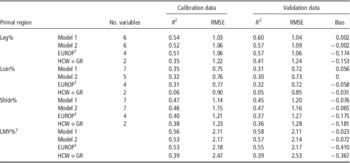
The two regression models based on the VIAscan® variables gave quite similar results when predicting the percentage of lean in each primal region in terms of the R 2 and RMSE (Table 5). The variation explained by the VIAscan® models ranged from 32% for Loin% using five variables (model 2) to 54% for Leg% using six variables (model 1), whereas 46% to 47% of the variation in Shldr% was explained using seven variables. The EUROP models were comparable to the VIAscan® models for the Leg% and Loin%, but not for the Shldr% as the R 2 was 0.06 to 0.07 units lower. The models using HCW and GR were poor compared with the other models for Leg% and Loin% but was equal to the EUROP model for Shldr%.
Accuracy (R 2) and precision (RMSE) of multiple regression models and GLM analysis derived from the calibration data (n=603) to predict lean yield of the legs (Leg%), loin (Loin%) and shoulder (Shldr%)

RMSE=root mean square error; HCW=hot carcass weight; GR=tissue depth over the 12th rib, 11cm from midline.
Model 1 includes raw VIAscan® variables, Model 2 includes a composite of principal components of VIAscan® variables and raw VIAscan® variables. Results from applying the prediction models to the validation data (n=259) show transportability of the models.
1 GLM analysis using EUROP scores as class variables together with GR and HCW.
2 LMY% estimated as the sum of Leg%, Loin% and Shldr%.
Results from the crossvalidation of the four prediction models by applying the prediction equations obtained from the calibration data to the validation data are shown in Table 5, together with the bias of each prediction model. All models showed similar precision (R 2) and accuracy (RMSE) as for the calibration data. The VIAscan® models showed much less bias (<0.1 for all models) than the EUROP (−0.06 to −0.41) and HCW+GR models (−0.03 to −0.37), which consistently underpredicted the lean percentage for each primal region and total LMY%.
Discussion
Classification trial
The agreement between VIAscan® and the final assessment of the expert classifiers was higher for conformation than for the fat classification. This is probably caused by the fact that the VIAscan® estimates for the fat class rely only on the dorsal view of the carcass, whereas the fat classification made by plant classifiers is based on tissue depth at the GR site. Compared with the panel of expert classifiers, the VIAscan® does reach the minimum limits of 80% agreement in conformation and 70% in fat classification that is stipulated by the Icelandic Food and Veterinary Authority as official limits for the VIA technique (Vilhjálmsson S., personal communication). As noted by Johansen et al. (Reference Johansen, Aastveit, Egelandsdal, Kvaal and Røe2006) the limits for fat classification are less restrictive than conformation classes according to the EU rules, recognising that fat classification tends to be less accurate.
Prediction of LMY% and FAT% from EUROP scores
The EUROP classification by the expert classifiers explained the variation in LMY% and FAT% with a higher accuracy than the EUROP scores of the VIAscan®. As far as we know this is the first time that the precision of EUROP scores obtained by a VIA system in predicting lamb carcass composition has been evaluated. The EUROP classification scores, based on one expert classifier, along with the GR measure and HCW explained 54% of the variation in LMY%, which is higher than Einarsdóttir (Reference Einarsdóttir1998) reported for the Icelandic EUROP system (38%) and Johansen et al. (Reference Johansen, Aastveit, Egelandsdal, Kvaal and Røe2006) found for the EUROP system in Norway (41%).
Conformation score describes the shape of the carcass cuts and is affected both by fatness and muscularity. Several authors have pointed out that conformation score is not a strong predictor of LMY% (Kempster et al., Reference Kempster, Cuthbertson and Harrington1982; Horgan et al., Reference Horgan, Murphy and Simm1995; Nsoso et al., Reference Nsoso, Young and Beatson2000), which is in agreement with this study. However, the significant differences in LMY% between most conformation classes do indicate that better conformed carcasses can be expected to give better yield within the same fat class and at similar weights. Similarly, Purchas and Wilkin (Reference Purchas and Wilkin1995) showed that carcasses with high conformation score had greater muscle depth relative to bone length and higher yield of leg and saddle cuts than carcasses with a lower score, compared at equal weight and fatness level. Thorgeirsson and Thorsteinsson (Reference Thorgeirsson and Thorsteinsson1986) argued that conformation was of more importance for the Icelandic breed than other European sheep breeds because of the large variation in body shape.
Other studies that have investigated the ability of the EUROP system to explain the variation in FAT% fully agree with the results for the current grading system shown in this study. Johansen et al. (Reference Johansen, Aastveit, Egelandsdal, Kvaal and Røe2006) showed that the EUROP classes and HCW explained 74% of the fat proportion in the carcass, and Einarsdóttir (Reference Einarsdóttir1998) found that EUROP fat class and GR measurement explained 71% of the variation in fat percentage. The results show that the GR measurement was the best single parameter to predict FAT% in the current data. Einarsdóttir (Reference Einarsdóttir1998) obtained slightly higher R 2 values for FAT%, ranging from 0.76 to 0.86 for GR measured by different probes. Similarly, it has been argued that the cross-sectional measure of fat thickness above the 12th rib (J-measurement), closely related to the GR measurement, would be one of the best single predictors of FAT% (Pálsson, Reference Pálsson1939; Thorgeirsson and Thorsteinsson, Reference Thorgeirsson and Thorsteinsson1986).
The EUROP fat score of VIAscan® is not as good an indicator of FAT% as the fat score of the current system (Table 3), which relies heavily on the GR measure, whereas the VIAscan® estimates fat cover from colour measurements. Thus, further development of the VIAscan® estimation of the fat classes would be beneficial for commercial use of the technique in official carcass classification.
Prediction of lean yield from VIAscan®
The VIAscan® provided a slightly more accurate prediction of lean meat yield than the current grading system in Iceland. The differences between VIAscan® and the EUROP model ranged from 1% to 3% (Loin%, Leg%) to 8% to 10% (Shldr%). However, the EUROP model consistently underpredicted the lean meat yield for each primal region, leading to an overall underprediction of the LMY% by 0.41%. The EUROP model has set a benchmark of what can be achieved by a single expert classifier, grading carcasses on a dead rail. It would be reasonable to assume that plant classifiers, grading at line speed, across multiple abattoirs, would result in the degradation of the EUROP prediction ability, and also lead to a greater variance in the prediction bias.
The results also showed that the LMY% can be more accurately predicted by using EUROP classes along with GR and HCW, compared with GR and HCW alone. According to Stanford et al. (Reference Stanford, Richmond, Jones, Robertson, Price and Gordon1998) and Hopkins et al. (Reference Hopkins, Safari, Thompson and Smith2004), the VIAscan® also performed better than the systems used as benchmarks for prediction of lean yield. Studies on other VIA systems for lamb carcasses have shown similar results (Horgan et al., Reference Horgan, Murphy and Simm1995; Brady et al., Reference Brady, Belk, LeValley, Dalsted, Scanga, Tatum and Smith2003; Cunha et al., Reference Cunha, Belk, Scanga, LeValley, Tatum and Smith2004). The accuracy of the prediction equations based on VIAscan® parameters was within the range of previous findings. Hopkins et al. (Reference Hopkins, Safari, Thompson and Smith2004) presented an R 2 value of 0.52 when predicting lean meat yield based on a model including VIAscan® parameters, and Stanford et al. (Reference Stanford, Richmond, Jones, Robertson, Price and Gordon1998) reported an R 2 of 0.71 using seven VIA parameters and carcass weight. Brady et al. (Reference Brady, Belk, LeValley, Dalsted, Scanga, Tatum and Smith2003) studied the ability of the lamb vision system (LVS) where six parameters along with HCW explained 60% of the variation in saleable meat yield (%), and Cunha et al. (Reference Cunha, Belk, Scanga, LeValley, Tatum and Smith2004) reported an R 2 value of 0.68 also based on the LVS technology. A much higher proportion of the variation is explained when predicting lean weight rather than percentage as the carcass weight is highly correlated with the weight of lean meat. Rius-Vilarrasa et al. (Reference Rius-Vilarrasa, Bünger, Maltin, Matthews and Roehe2009) showed that the VIA technology along with carcass weight explained 99% of the variation in lean meat weight.
Detailed descriptions of the VIAscan® variables are not available for publishing and therefore cannot be discussed in detail. The prediction of the lean percentage is highly dependent on the colour measurements from the loin and shoulder, as they reflect fat distribution and thickness. Areas and widths were also used in the regression models, providing measures of carcass conformation and muscularity. The two models developed from VIAscan® variables in the present study performed quite similarly. However, the model based on PC variables would be expected to be more stable as the correlations between the PC variables were generally lower than between the raw variables.
In this study and the studies by Stanford et al. (Reference Stanford, Richmond, Jones, Robertson, Price and Gordon1998), Brady et al. (Reference Brady, Belk, LeValley, Dalsted, Scanga, Tatum and Smith2003) and Rius-Vilarrasa et al. (Reference Rius-Vilarrasa, Bünger, Maltin, Matthews and Roehe2009), the VIA technology predicted lean meat yield in the leg with the highest accuracy and lean in the loin, with the poorest accuracy of the three primal regions. Stanford et al. (Reference Stanford, Richmond, Jones, Robertson, Price and Gordon1998) did not find any significant VIAscan® variables to use for predicting lean in the loin and concluded that this was because of the little variation found in this trait. The poor performance in predicting lean in the loin in this study could be influenced by the decision to exclude the flanks from the loin, as this reduced the Loin% variability. The variation in the prediction accuracy reported between studies can be partly attributed to the differences in the deboning process, and also the degree of variation in the carcass composition. The deboning description can vary between trials according to different boning specifications (commercial cuts v. denuded lean cuts) and overlaid this are the inherit inaccuracies of a manual dissection. Kongsro et al. (Reference Kongsro, Røe, Aastveit, Kvaal and Egelandsdal2008) have pointed out that it is more accurate to use CT scanning to calibrate methods of evaluating carcass composition than manual dissection.
Conclusion
The EUROP scores of the VIAscan® are not as accurate as the EUROP scores of the current system in explaining the variation in LMY% and FAT%, although both methods are capable of estimating these traits. The fully automatic technology provided by the VIAscan® did reach sufficient accuracy in classifying into EUROP classes and is thus a realistic option for the sheep industry. The VIAscan® system predicts lean meat yield with slightly more accuracy than the current grading system, and it provides an excellent opportunity for the Icelandic sheep industry to focus more on direct measurements of lean yield. There is, however, room for improvement in the prediction of lean in the loin and the agreement to the industry’s EUROP fat classification.
Acknowledgements
Thanks go to the KS abattoir for their co-operation in carrying out the VIAscan® project and Stefán Vilhjálmsson at the Icelandic Food and Veterinary Authority for his co-operation with the project. Financial support was supplied by the Memorial Fund of Dr Halldór Pálsson, The Agricultural Productivity Fund, The Sheep Farmers’ Association of Iceland and Hagsmunasamtök héraðsráðunauta (Association of Advisers in Agriculture). The two anonymous reviewers are gratefully acknowledged for constructive comments to the manuscript.