Introduction
Composite materials, which offer a variety of advantages that cannot be gained solely with only one of their constituents, are actively used in advanced engineering applications such as lightweight structures for aerospace and automotive industries. Natural creatures also exploit composites to protect themselves from threats in a variety of environments and to sustain living conditions with the limited resources and building blocks available in nature.[Reference Ortiz and Boyce1–Reference Wei, Naraghi and Espinosa5] Design and fabrication methods of most man-made synthetic composites have been well established owing to their relatively simple arrangements. In comparison, although extensive studies have been performed to understand and mimic natural composites, it remains a daunting task to fabricate bio-inspired structures via conventional manufacturing processes because of their complex hierarchical structure ranging from the nano- to macro-scale. Recently, the advancement of additive manufacturing has facilitated the fabrication of complex structures, and as a result, a variety of composite structures inspired by natural materials such as nacre, bone, conch-shell, and spider silk have been fabricated and tested via 3D-printing methods.[Reference Gu, Libonati, Wettermark and Buehler6–Reference Gu, Takaffoli and Buehler11]
Because many natural composites, synthesized via a self-assembly process, have relatively periodic and regular arrangements, their mechanical properties can be reasonably understood by analyzing the load transfer mechanism of a representative unit cell.[Reference Wei, Naraghi and Espinosa5,Reference Kim, Kim, Lee, Kim and Ryu8,Reference Zhang, Heyne and To10,Reference Ji and Gao12] However, the applicability of analytical approaches is limited in accurately predicting inelastic responses such as fracture and plastic deformation, and providing statistically meaningful results accounting for the inherent randomness in structural arrangements. Numerical modeling based on finite element methods (FEM) can complement analytical approaches for predicting properties beyond the elastic response regime such as toughness and strength e.g., phase field simulation for the initiation and propagation of curvilinear cracks. Given the combinatorially large composite design space of even simple binary systems, it is crucial to develop a high throughput computing procedure for the rapid in-silico testing and characterization of novel composite designs.[Reference Jeong, Signetti, Han and Ryu13–Reference Bourdin, Francfort and Marigo18] However, such numerical schemes e.g., the phase field formulation, are computationally expensive and time consuming because they require the usage of a very fine mesh to accommodate the smooth variation of the highly concentrated stress field near the crack tip and/or damage parameter within the regularized diffusive width of the crack surface. The high computational cost of numerical modeling as well as the prohibitively large design parameter space of a composite makes conventional gradient-based optimization methods that are based on multiple/iterative evaluations of target properties infeasible.
In 2012, deep learning (DL) burst onto the field of computer vision, achieving record-breaking performance on the ImageNet dataset, a diverse labeled image corpus with 1000 different image classes.[Reference Krizhevsky, Sutskever and Hinton19] Since then, DL has been used to great effect in natural language processing, reinforcement learning, and image classification.[Reference Lecun, Bengio and Hinton20] DL, which utilizes successive layers of weighted units with non-linear activations, is capable of approximating complex functions, learning to represent abstract features, and using raw data as input. In addition to demonstrating excellent performance on traditional artificial intelligence (AI) benchmarks, DL has also accelerated scientific understanding. Neural networks have been used to predict protein folding,[Reference Jo, Hou, Eickholt and Cheng21] automatically focus a microscope for long-time periods under dynamic biologic situations,[Reference Wei and Roberts22] speed up particle physics simulations,[Reference Paganini, De Oliveira and Nachman23] and optimize kirigami cuts in graphene.[Reference Hanakata, Cubuk, Campbell and Park24] One common theme is that neural networks are capable of significantly speeding up, and oftentimes improving upon, common analytical formulas that were painstakingly crafted by experts in the field, simply by training on large amounts of data.
In our previous work, we demonstrated the ability of convolutional neural networks (CNNs), a type of neural network architecture designed for computer vision tasks, to rapidly and accurately predict material properties of composite designs as calculated by FEM, enabling high-throughput material design optimization.[Reference Gu, Chen and Buehler25,Reference Gu, Chen, Richmond and Buehler26] Previously, FEM data were calculated up to the initiation of crack propagation in order to generate large amounts of data quickly. In this paper, our analysis will consider the entire crack propagation process, rather than just crack initiation. As a result, this problem is much more computationally expensive because the number of iterations in the simulation has increased dramatically. In this work, we explore the feasibility of using DL algorithms to predict the properties of composites when considering the entire failure path. The data preparation and finite element procedure used to obtain training data for our models are discussed in the “Materials and methods” section. In the “Results and discussion” section, we demonstrate how CNNs outperform traditional machine learning (ML) algorithms such as random forest (RF) ensembles and linear regression. The scaling of CNN performance with respect to the dataset size compared with traditional ML methods is investigated and the flexibility of CNN architecture is utilized to improve its performance on smaller dataset sizes. The CNNs learned convolution filters are visualized to better understand the features the CNN is learning and to demonstrate its ability to hierarchically craft representative features. Finally, we conclude and discuss future opportunities in this research area.
Materials and methods
This section discusses the implementation of the FEM used to obtain training data for our ML models. The data preparation, training procedures, and implementation of various algorithms, as well as the visualization algorithm for CNNs are described.
Finite element method
FEM was used to obtain our training data, with the ML algorithms treating the material descriptors produced by an FEM as the ground truth labels. The crack phase field solver was based on the hybrid formulation for the quasi-static fracture of elastic solids in the commercial finite element software ABAQUS with user-element subroutine (UEL). Our previous study showed that the hybrid formation adequately models crack propagation under combined tensile and shear loading and crack propagation within composite materials made of two constituents whereas the widely used anisotropic formulation produces unphysical results. The details of the implementation and validation can be found in our previous study.[Reference Jeong, Signetti, Han and Ryu13]
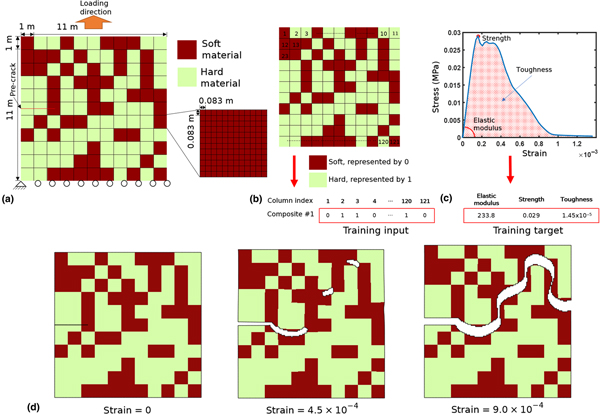
FEM simulations were performed with 2D plane stress condition by employing CPS4 element. A large plate (11 m × 11 m) is divided into 121 blocks (1 m × 1 m) and 70 hard and 51 soft blocks are randomly assigned to generate 26,000 composite configurations [Fig. 1(a)]. Even with the design constraint placed on the number of hard and soft blocks, there are still more than 1030 possible configurations. Material properties of the hard and soft constituents are summarized in Supplementary Material Table SI. Here, we chose a relatively small domain size so that a reasonable amount of training data can be obtained in a computationally feasible timeframe. The number of elements per block was determined by searching for the coarsest mesh that leads to an identical crack path with the reference fine mesh simulations, which used 625 elements for each block. The interface between the hard and soft blocks was assumed to be perfectly bonded. We chose a moderately higher fraction (~58%) of hard blocks, as we expected to find tougher configurations to promote wavy crack propagation; such a mechanism is not likely to occur when the volume fraction of hard domain is very large or very small. Each block was divided into 144 elements (0.083 m × 0.083 m), totaling 17,424 elements for the entire plate [Fig. 1(a)]. The regularization parameter, i.e., the characteristic diffusive length of the crack, is set to be two times larger than the mesh size. A 2.5 m length pre-crack is placed at the middle of the sample before performing quasi-static uniaxial tension tests.
(a) Mesh size description and conditions for testing and developing the composites in this paper. (b) Converting the composite material unit cell geometry to a row vector. (c) Deriving composite material properties from the FEM simulation stress–strain curves. (d) Full crack path of composites. The crack path is represented by removing elements whose phase is greater than 0.9. Deformation is scaled by 50.
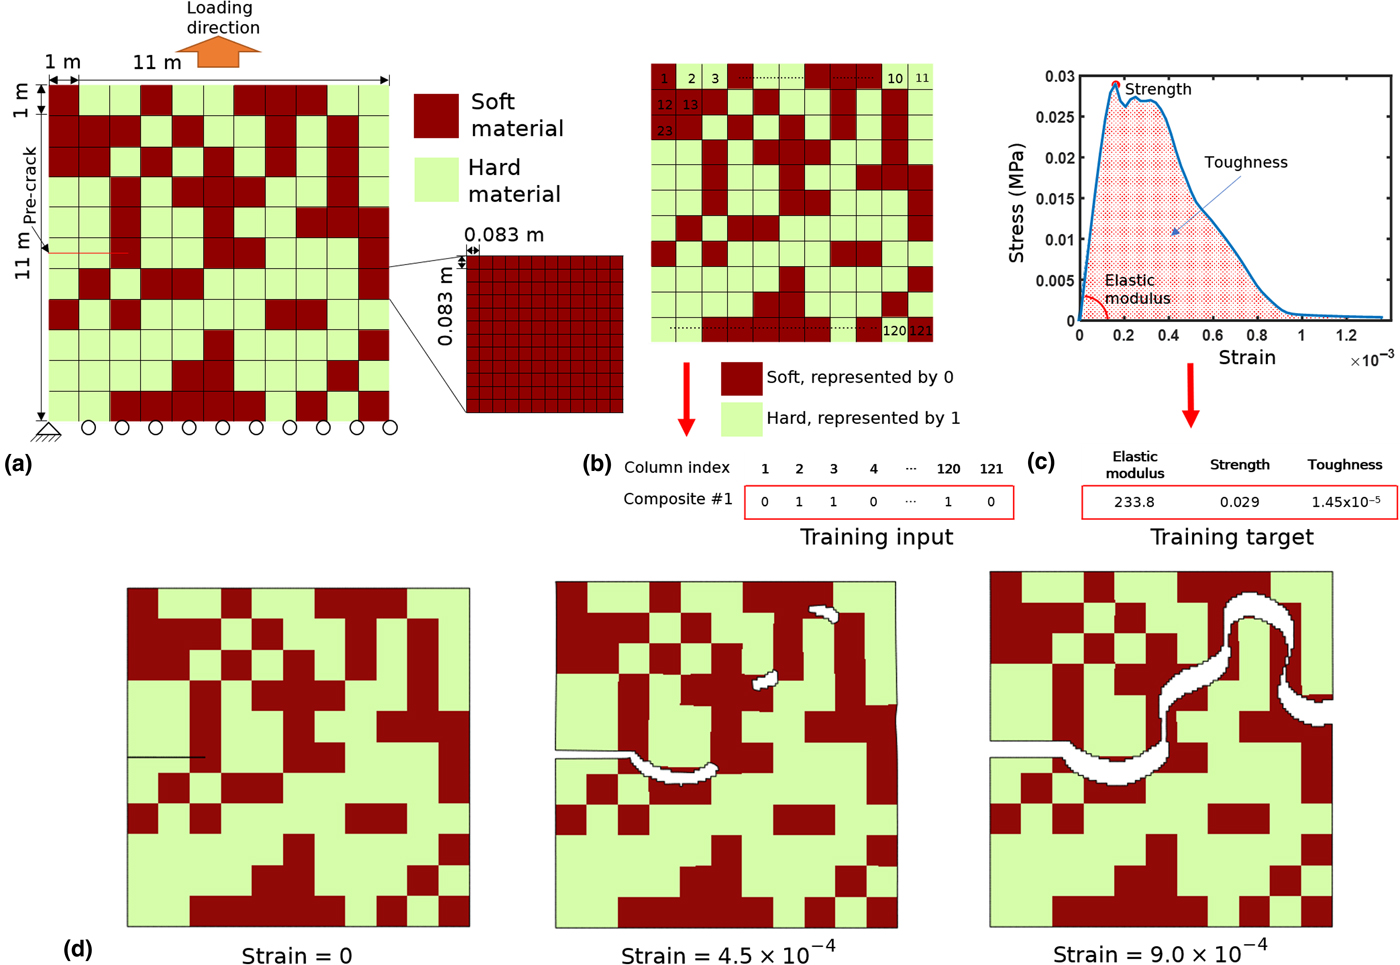
Each composite design is characterized as a 121-dimensional row vector consisting of 0 and 1 corresponding to soft and hard materials, respectively, as shown in Fig. 1(b). From the stress–strain curves obtained from the FEM simulations, we obtain elastic modulus from the initial slope (linear fitting within 0.005% strain), strength from the maximum stress, and toughness (modulus) from the area under the curve [Fig. 1(c)]. Note that the elastic modulus is much less computationally expensive to calculate compared with strength or toughness because it is calculated from the initial slope of the stress–strain curve rather than the entire curve. FEM simulations were run for the duration of the entire crack propagation path, resulting in material descriptors beyond the elastic limit. An example of a crack propagation path is shown in Fig. 1(d).
Data processing
To ensure a fair comparison, all our ML models used the same data processing methodology, with the exception of the input target shape. The target material property values were first normalized to have a mean of 0 and a standard deviation of 1 before being passed to a ML model. All experiments were performed with a randomized 80/20 train/test distribution and each experiment used 15 trials unless otherwise stated. Each trial had a different random train/test distribution to test the model's generalizability across the entire dataset. The number of trials was limited by the computational cost of running many trials for all models and material properties.
Baseline models
More conventional ML algorithms were used to establish a benchmark to compare DL methods with. Ordinary least squares (OLS) linear regression and an RF ensemble[Reference Breiman27] with 100 decision trees were used as baseline models and implemented using the open-source Python package scikit-learn.[Reference Pedregosa, Varoquaux, Gramfort, Michel, Thirion, Grisel, Blondel, Pretenhofer, Weiss, Dubourg, Vanderplas, Passos, Cournapeau, Brucher, Perrot and Duchesnay28] Default hyperparameters were used for linear regression and RF. The input was an unraveled 121-dimensional row vector representing the unit cell.
Convolutional neural networks
Our CNN was implemented using the open-source python package Keras[Reference Chollet29] with a TensorFlow backend. The batch size for all experiments was set to 128 and the number of epochs to 100. Mean squared error (MSE) was the loss function and the Adam optimizer was used.[Reference Kingma and Ba30] See Supplementary Material Fig. S1(a) for a full description of the model architecture. For CNN, an 11 × 11 matrix of binary labels is used rather than the 121-dimensional vector to represent the unit cell in order to take advantage of CNNs’ ability to parameterize 2D inputs efficiently.
CNN filter visualization
Finally, we sought to understand what kind of features the convolution filters in each layer were learning to represent. Drawing from previous work,[Reference Erhan, Bengio, Courville and Vincent31] this question can be posed as an optimization problem to maximize a given filter activation with a matrix of constant norm. Although this is a non-convex problem, gradient ascent can be used to find some local minima. Nesterov accelerated gradient was used as the gradient optimizer[Reference Nesterov32] with a step size (α) of 10−5 and a momentum (γ) of 0.9 and an input image of size of 22 × 22. Although our inputs are binary, we treat this as a continuous problem as a simplification. Intermediate values would correspond to a linear interpolation between the soft and hard blocks. The larger input image size was chosen for ease of visual understanding, as the deeper filters had more complex activations that were more easily understood with larger input images. To improve our gradient ascent performance, 4000 random matrices are initialized, and gradient ascent searched through the input space in parallel. Early stopping is used to prevent gradient ascent from escaping local minima by stopping gradient ascent after the average score of the best-scoring 40 inputs begins to decrease. The base CNN was slightly modified to have an additional convolution layer to better understand the effect of multiple convolution layers. Although such a methodology for examining CNN filters has been proposed previously, we expect different results given our novel, material property prediction regression task, as opposed to traditional image classification problems.
Results and discussion
Here, the data used to train our model and the performance of various ML models are presented. Model performance is quantified with a variety of metrics: MSE, mean absolute error (MAE), and the square of the Pearson correlation coefficient (R 2). OLS, RF, and CNN performance with respect to dataset size is characterized with the given metrics. Modulus as an additional input to CNNs offers further improvements to model performance in smaller data regimes and visualizations of the learned convolution filters were used to explore what features are relevant to CNNs.
Training data distribution
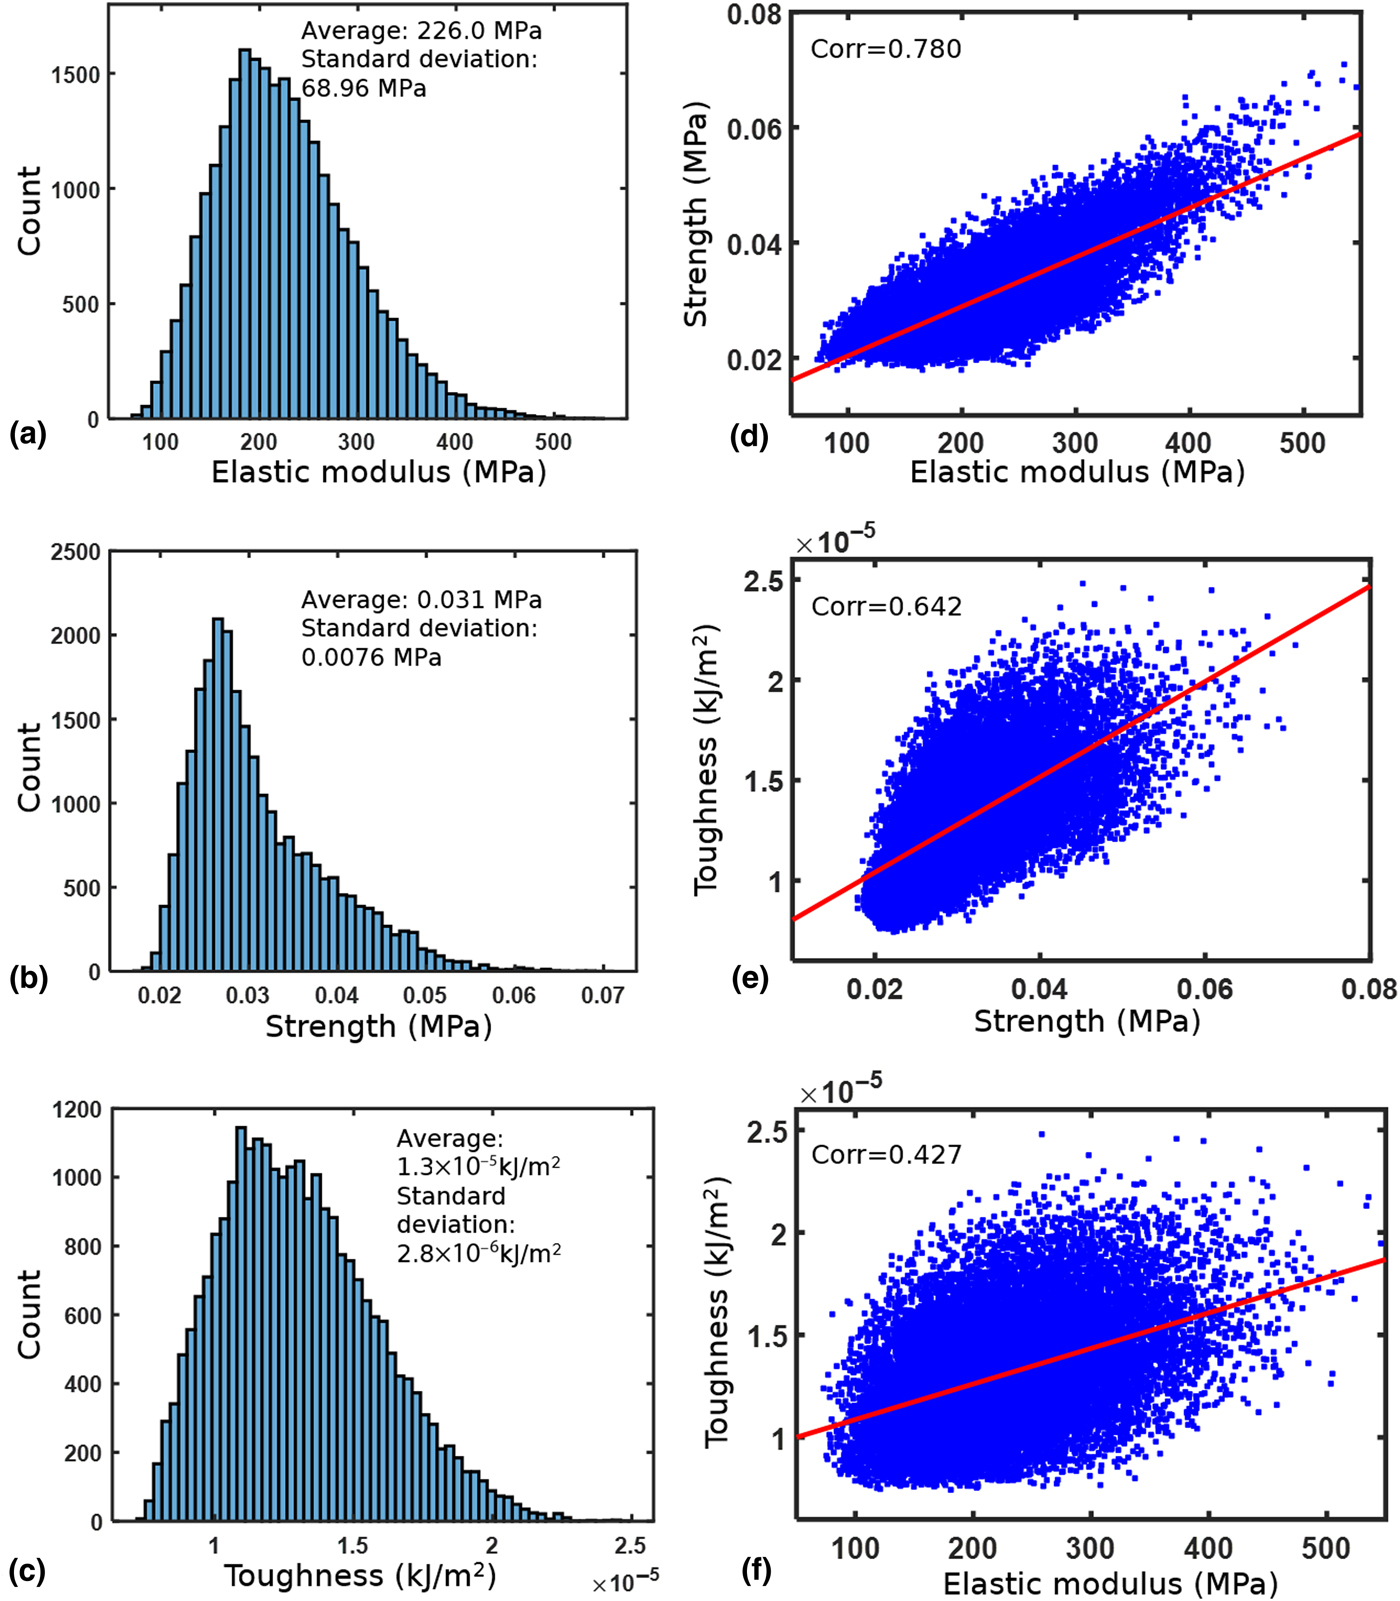
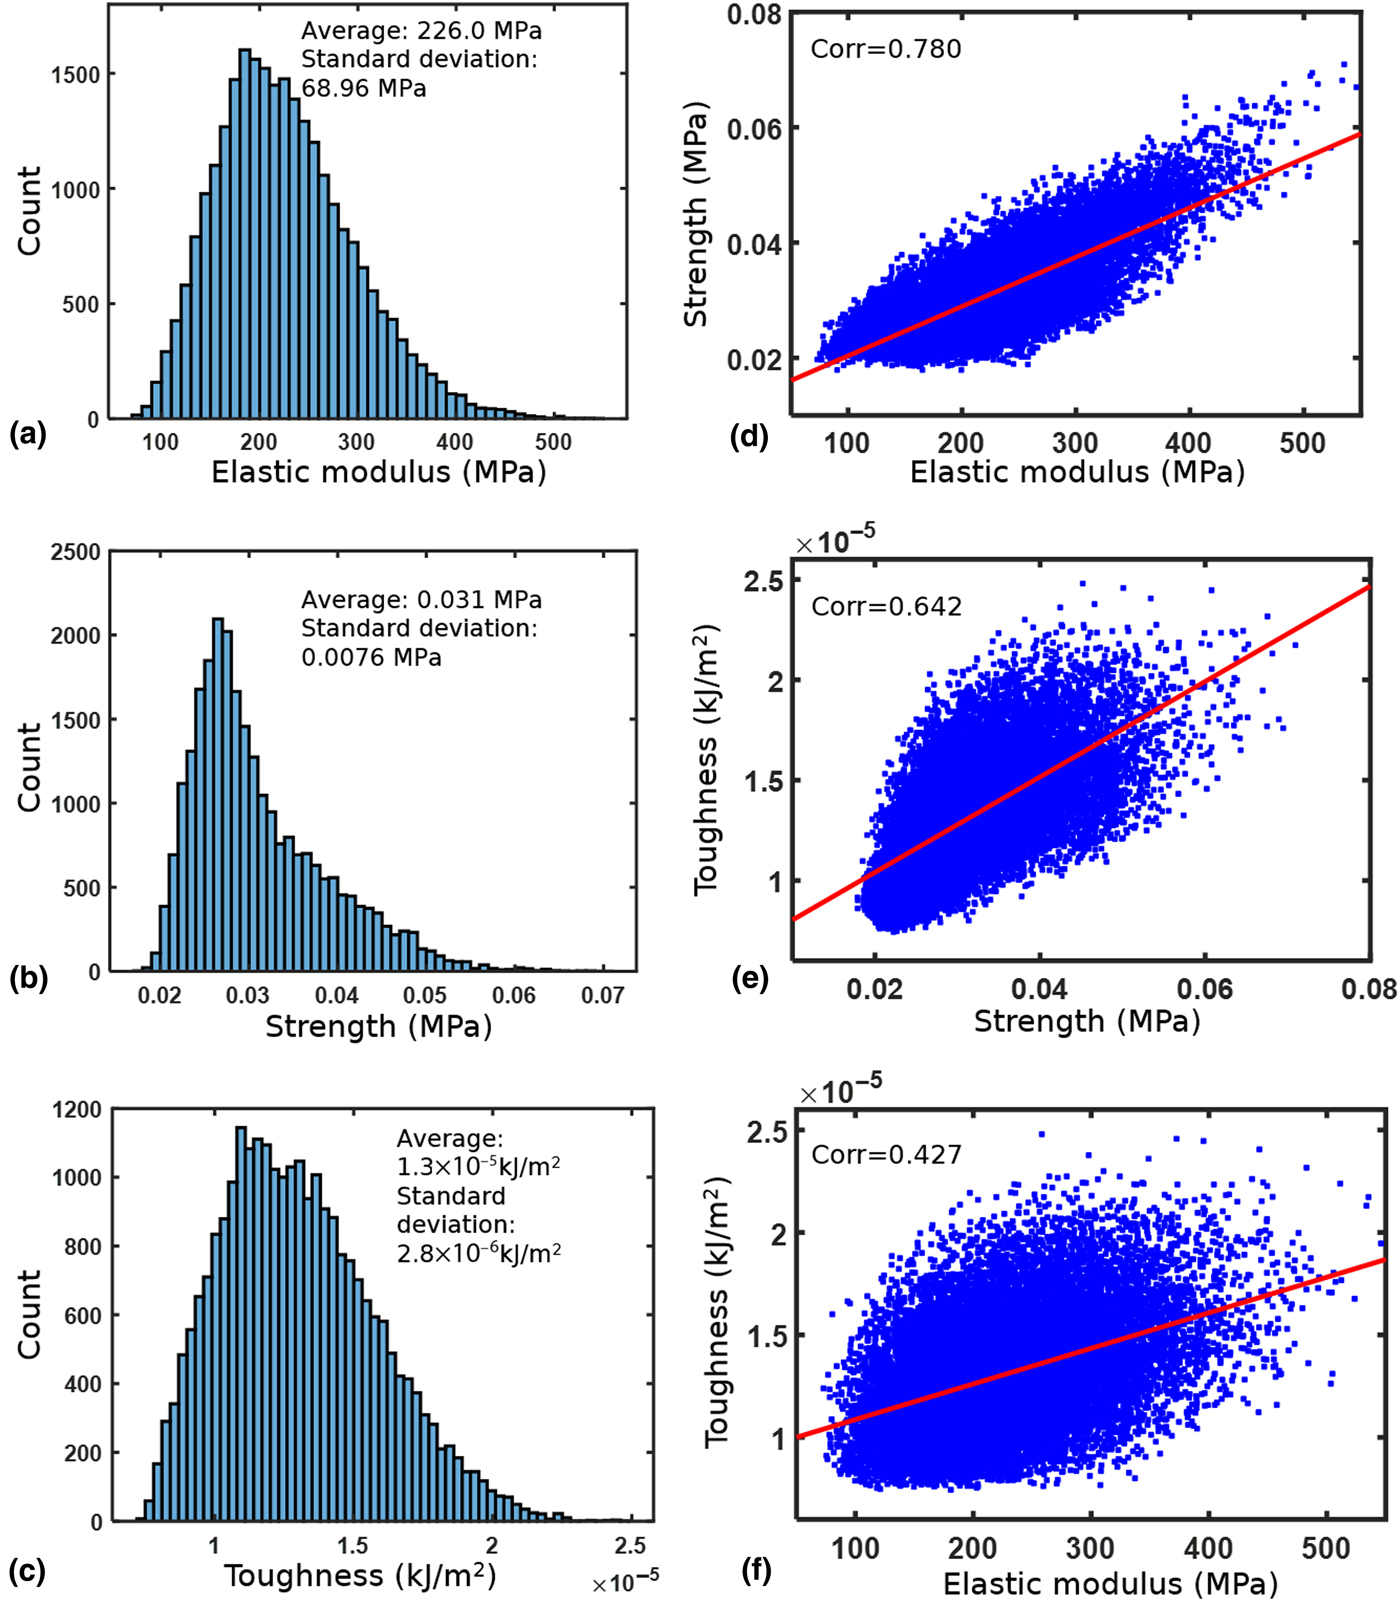
Understanding the distribution of our training data is an important component of exploratory data analysis. Figures 2(a)–2(c) present the histograms of the elastic modulus, strength, and toughness from the stress–strain curves of 26,000 configurations. The distribution of modulus, strength, and toughness is roughly normal with a slight right skew. Ultimately, our goal is to rapidly identify composite design patterns that exhibit properties in the far-right tail of the distributions, oftentimes maximizing their joint distributions e.g., high strength and toughness. In addition, scatter plots between each pair of the set of material descriptors (elastic modulus, strength, and toughness) show the positive correlation among all three properties [Figs. 2(d)–2(f)]. This suggests that the “easy-to-obtain” elastic property (elastic modulus) may serve as a useful descriptor to predict “hard-to-obtain” properties (strength and toughness) in ML.
Histograms of our 26,000 composite FEM results data based on (a) elastic modulus, (b) strength, and (c) toughness. Correlation plots between (d) elastic modulus–strength, (e) strength–toughness, and (f) elastic modulus–toughness. “Corr” means Pearson's linear correlation coefficient.
Comparing CNNs with benchmark models
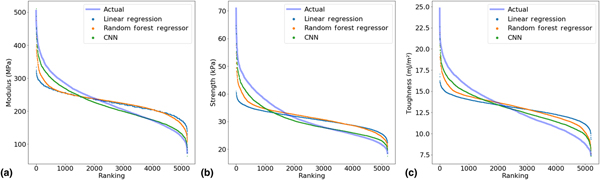
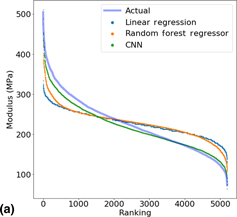
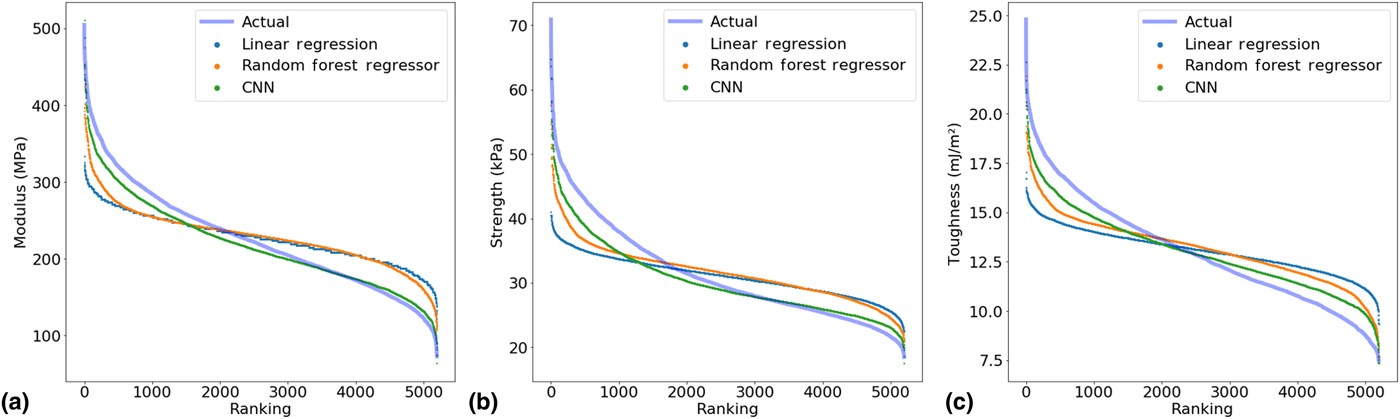
To establish the relative performance of CNNs to traditional ML models, CNNs are compared with linear regression and RFs on a variety of metrics. The distribution of predicted material descriptors against their value ranking is shown in Fig. 3. For elastic modulus and strength, the CNN closely captures the underlying distribution, while linear regression and RF are approximating the average value of the distribution. For toughness, RF is slightly more accurate; see Fig. S2 for model performance as measured by MSE, MAE, and R 2.
Comparing the distribution of values learned by the various models based on ranking for (a) elastic modulus, (b) strength, and (c) toughness.
Different black-box methods can be used as a method to probe the underlying nature of the computation required to calculate such values. For instance, it may be that RF performs better on toughness because the nested if-statements are a closer approximation to the actual toughness calculation method. This offers the intriguing possibility of creating simple analytical models inspired by or derived from the trained RF model and is a research direction we plan to investigate in future work. In particular, feature importance analysis is a promising method to “open up the black box” of ML and confirm that the algorithm is learning a realistic predictive model. Being able to relate the performance of different types of models to the underlying analytical calculation would be a significant step forward in improving and interpreting empirical models.
The design space for CNN is also very large; using techniques such as neural architecture search[Reference Zoph and Le33] to find more optimized architectures may improve performance of CNN beyond that of RF. Differences in the CNN architecture for calculating different material descriptors could be hypothesized based on the known differences in actually simulating these descriptors or conversely, could help us further understand how to speed up simulations by using different approximation models. Finally, CNNs generally scale better with increasing data; with more data, CNNs will most likely come to outperform RF at even calculating toughness. For the rest of the paper, we will consider only CNNs, given their currently untapped potential and excellent general performance.
Effect of dataset size of model performance
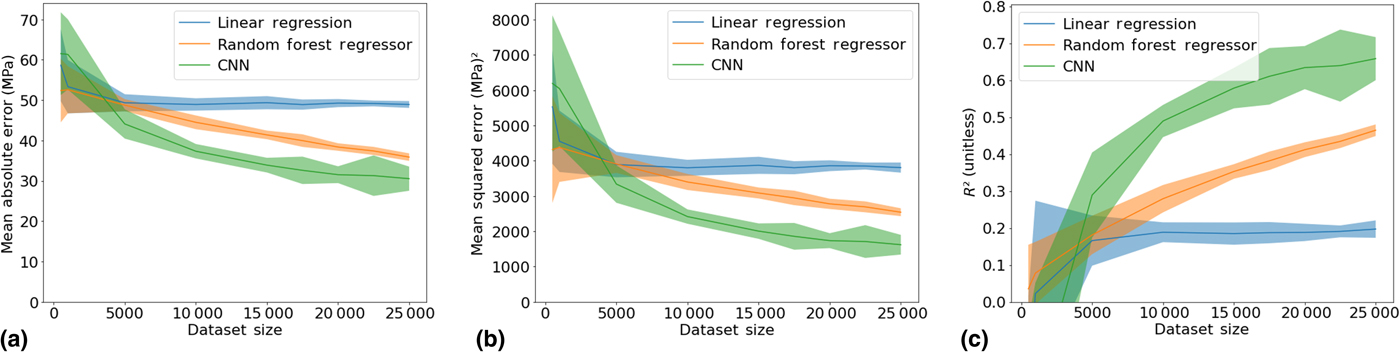
Given the intense compute resources required to generate our dataset, a natural question to ask is how much data are enough to train a CNN. Another important question is when to use traditional ML algorithms versus DL given a dataset of a certain size. The performance of linear regression, RF, and CNN with respect to the dataset size is evaluated on a variety of metrics. The results are shown in Fig. 4 for predicting modulus.
The effect of dataset size on the performance of various models at predicting the elastic modulus as determined by the following metrics: (a) MAE, (b) MSE, and (c) R 2 which is the square of the Pearson correlation coefficient. The given dataset sizes are then fed into the models with an 80/20 train/test split. 95% confidence intervals are shown.
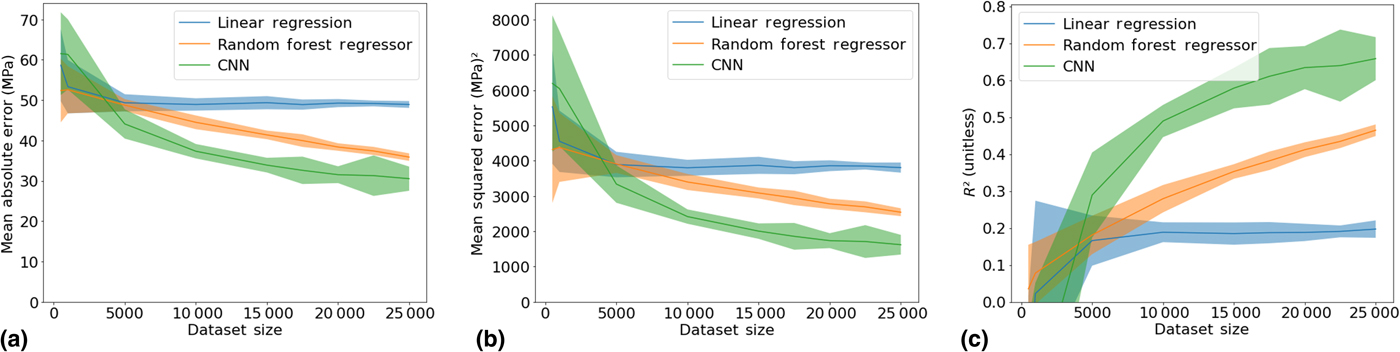
The performance of linear regression with respect to the dataset size plateaus quickly, representing its limited model capacity and is generally characteristic of parametric models. RF and CNN exhibit continual improvements in performance with dataset size as a result of being non-parametric models. However, CNN performance scales much better with larger datasets, outstripping the performance of RF at larger dataset sizes. Note that CNNs’ superiority is not guaranteed over all dataset ranges. In the small data regime, RF and linear regression perform better. Although for predicting modulus, the threshold in dataset size occurs at around 5000 instances, the threshold for other problems will vary based on the problem complexity. This threshold is a good benchmark to use for deciding how much data are needed for problems of similar complexity and design. Changing experimental parameters such as the unit cell size will most likely increase this threshold but changing the ratio of hard and soft blocks should not significantly change this threshold. For material descriptors, some variation in the threshold results due to the differing nature of the calculations required to obtain each descriptor from the stress–strain curve and the metric chosen, as seen in Fig. S3. The performance of linear regression, RF, and CNN with respect to dataset size for predicting strength and toughness is shown in Fig. S3.
Using modulus and unit cells as CNN inputs
One potential concern with using CNN for automating FEM is that the large initial dataset required for training may pose a challenging barrier to scalability. But, as shown in Figs. 2(d)–2(f), the existence of positive correlations between the three material descriptors (modulus, strength, and toughness) suggests that we may be able to use the relatively less compute-intensive elastic modulus property as a feature to feed into the model to improve performance on descriptors that are more computationally expensive to obtain with FEM.
Conveniently, neural networks are a flexible model that can efficiently parameterize and synthesize multimodal inputs e.g., images and scalar values. Our normal CNN, which only took in the unit cell matrix as an input, consisted of blocks of convolution and max pooling layers followed by a series of dense layers; batch normalization[Reference Ioffe and Szegedy34] and leaky ReLU activations were used throughout. To pass in both a unit cell image and the associated modulus value, the same CNN architecture was slightly modified by adding another smaller neural network consisting of dense and batch normalization layers, which took the modulus value as input. The output of this secondary, smaller network was concatenated with the output of the final max pooling layer in the CNN and fed into the series of dense and batch normalization layers. See Fig. S1(b) for a diagram.
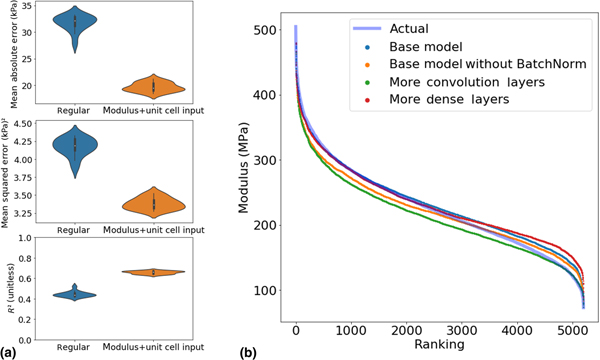
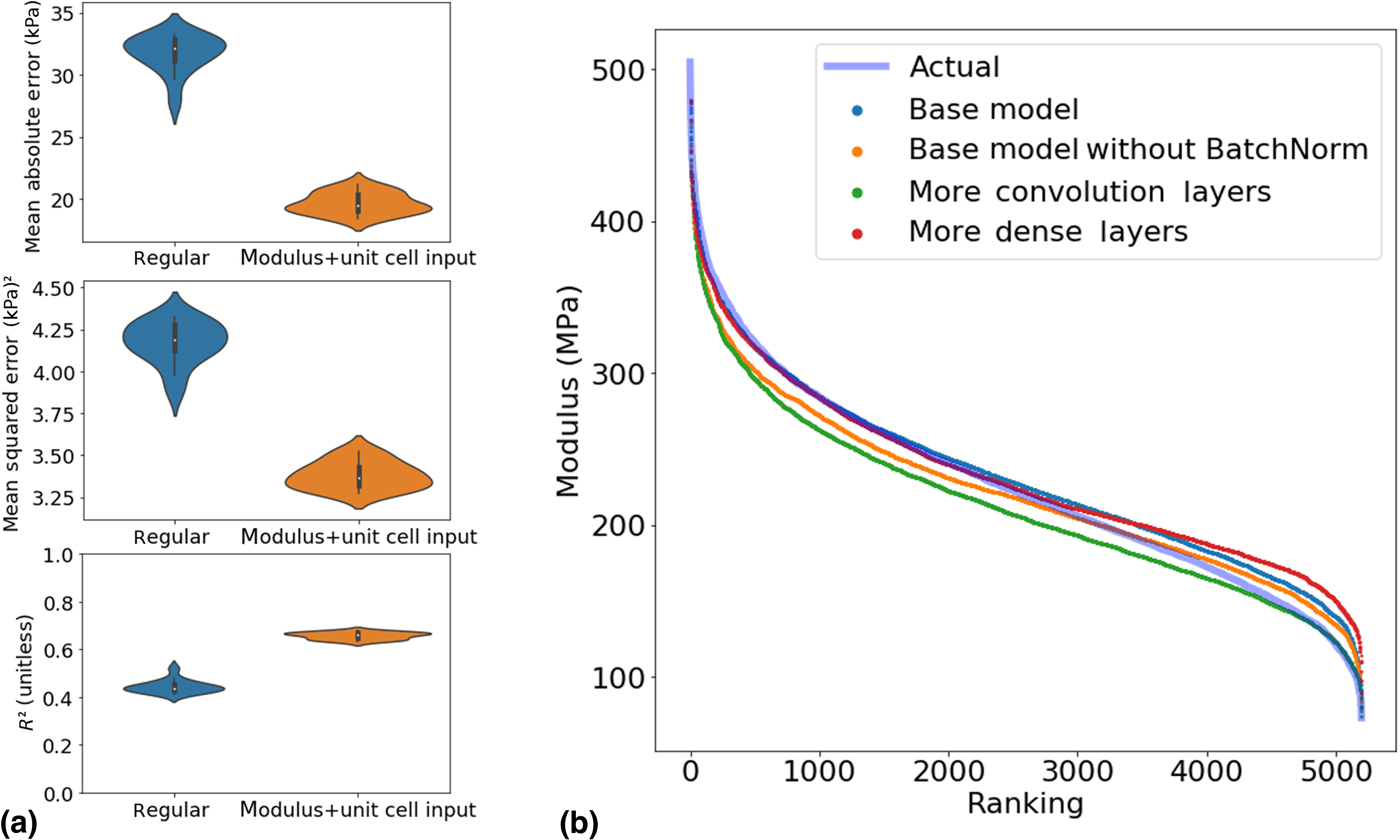
The performance of a neural network that takes in both the composite unit cell and the associated elastic modulus value compared with the regular CNN architecture that only uses the composite unit cell at predicting strength is shown in Fig. 5(a). A 50/50 train/test split was used instead of the regular 80/20 train/test split to demonstrate the utility of this method in smaller datasets. The use of modulus as an additional feature clearly improves the performance of neural networks even on smaller datasets, demonstrating how extra information about composite properties can be leveraged in conjunction with the flexibility of neural networks to improve inference abilities. Rather than just reporting average error values, we show the kernel density estimate of the distribution of errors, as measured by a variety of metrics. The lack of overlap in violin plots in Fig. 5(a) indicates that using modulus as an additional feature significantly improves the performance of CNN on smaller datasets. This augmentation technique can also be applied to reduce the amount of training data required by more data-intensive tasks, such as generative adversarial models for solving the inverse design problem.
(a) Comparing the distribution of performance of CNN across 15 trials with just a unit cell input versus with unit cell input and the associated modulus value at predicting strength. The violin plots are kernel density estimates, which generate smoothed histograms from a given distribution. The metrics used are the MAE, MSE, and R 2 which is the square of the Pearson correlation coefficient. These models were evaluated with a 50/50 train/test split to better represent a smaller dataset size. (b) The distribution of modulus values by ranking as predicted by different CNN architectures. “Base model” is the overall CNN architecture used against RF and OLS. “Base model without BatchNorm” is the base model but with all batch normalization layers removed. “More convolution layers” is the base model without max pooling layers and an extra Conv2D layer. “More dense layers” is the base model but with an extra dense layer at the end. Slight alterations were made to kernel and pool size to keep similar number of parameters for all models.
Testing different CNN architectures
A wide variety of hyperparameters and architecture design choices exist when creating CNNs. To show that our results are generalizable for the entire family of CNN models and that our results are not simply a result a hyperparameter tuning and behind-the-scenes CNN architecture optimization, three other CNN models with different architectures are constructed and their performance in Fig. 5(b). Based on the ranking curves, we can see that their performance is relatively similar and they all learn the underlying distribution of elastic moduli values well. The generalization of CNN performance to a variety of architectures signifies their potential in a variety of computational mechanics fields. Ranking curves for the same set of architectures for predicting strength and toughness are shown in Fig. S4.
Visualizing convolution filters
The recursive convolution layers in the CNN learn to identify features that are considered important to the model over the course of training. Significant work has been carried out for visualizing and understanding what types of features are learned by convolution layers.[Reference Zeiler, Fergus, Fleet, Pajdla, Schiele and Tuytelaars35] Specifically, each convolution filter can be thought of as a neuron that is heavily activated by certain features. Identifying what features activate each filter in each layer can posed as an optimization problem that can be solved with gradient ascent algorithms, which take advantage of the backpropagation calculus built into neural networks.[Reference Erhan, Bengio, Courville and Vincent31] Gradient ascent searches through the input space to maximize the activation of each filter i.e., “neuron,” where the activation is measured by the average value of the output matrix of each filter.
Based on previous work, the shallower convolution layers i.e., the first one, appear to learn simple features while the deeper convolution layers learn more complex features. In traditional image classification, the shallower layers learn lines and color boundaries. The deeper layers learn increasingly complex features, starting with stripes and circles, and eventually faces, flowers, and various animals.[Reference Zeiler, Fergus, Fleet, Pajdla, Schiele and Tuytelaars35] However, previous studies used datasets for image classification, whereas our dataset is predicting material descriptors for composite designs. Although we can use our intuition to guess at what hierarchical features we use every day to recognize objects, that same intuition is not necessarily present when engineers examine composite designs. Thus, visualizing the convolution filter activations may help us understand what kind of features are determined to be important by the CNNs.
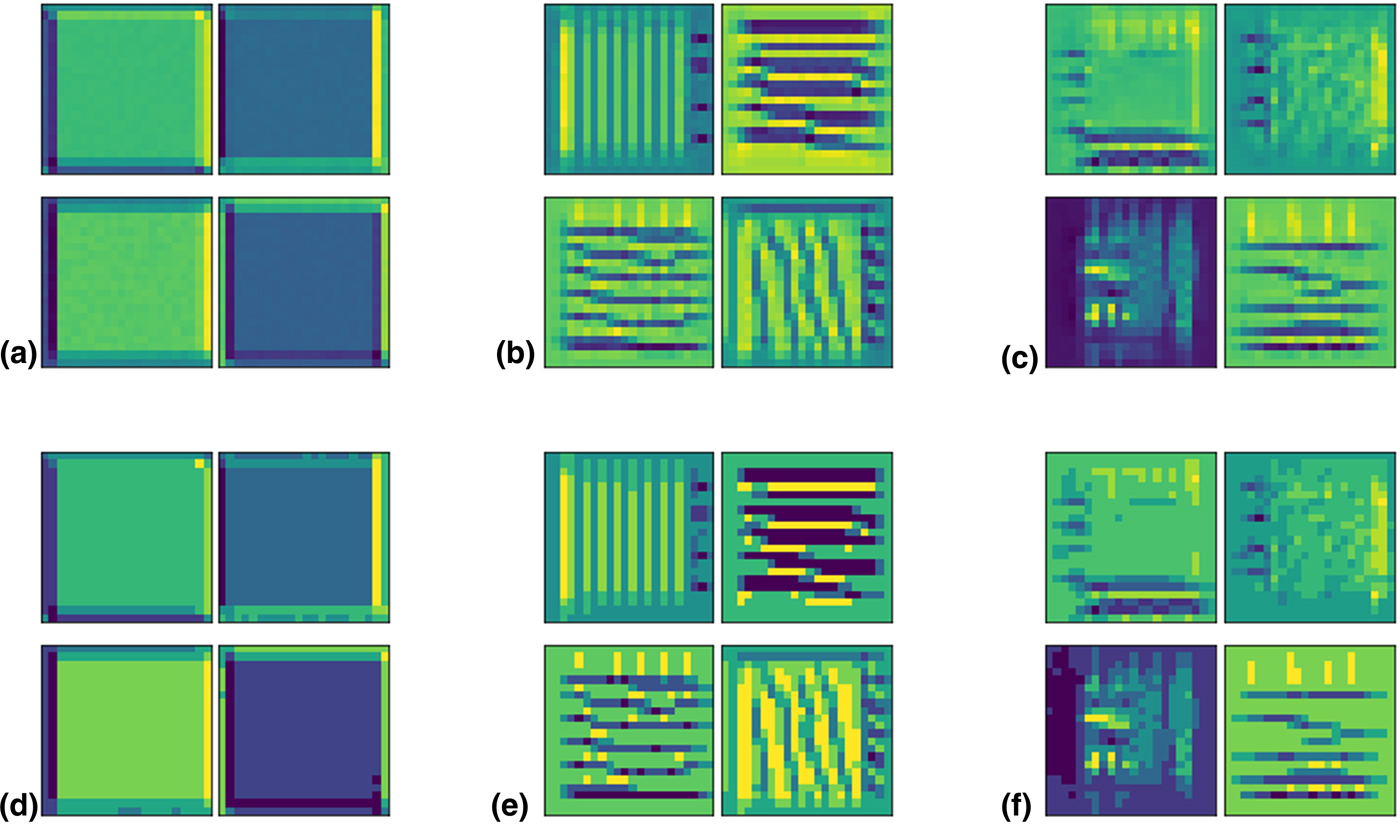
The learned convolution filters are shown in Fig. 6. The top four filters in layer 1 are shown in Fig. 6(a), where each filter is ranked according to the “best” solution found by the gradient optimizer, the quality of the solution being measured by the activation of the filter. The first layer is learning to detect simple edges, mostly the right edge with hard blocks. The four most activated filters in layer 2 [Fig. 6(b)] have learned to detect horizontal and vertical stripes of alternating hard and soft blocks. Finally, layer 3 [Fig. 6(c)] has the most complex features. It seems layer 3 has learned to detect grids of horizontal soft blocks and vertical hard blocks and vice versa. The layer 3 convolutions are the most complex and difficult to interpret as they are compositions of the previous layer activations. The deeper layers were also increasingly more difficult to optimize for; the gradient optimizer stopped due to the early stopping mechanism after a few iterations for the earlier layers but took many more iterations to stop for later layers. In Figs. 6(d)–6(f), we discretize the input unit cell values into ten evenly spaced bins to simplify the visualization and make certain features clearer.
The four filters in each layer with the best solution i.e., the unit cell that most activated the filter, are shown. The deeper layers show more complex, hierarchical learned features whereas the shallower layers learn simple features. The four most activated filters are shown for (a) layer 1, (b) layer 2, and (c) layer 3. We also discretize the input unit cell values into ten evenly-spaced bins which are shown in (d) layer 1, (e) layer 2, and (f) layer 3. The lighter yellow corresponds to harder blocks while the darker blue corresponds to softer blocks.
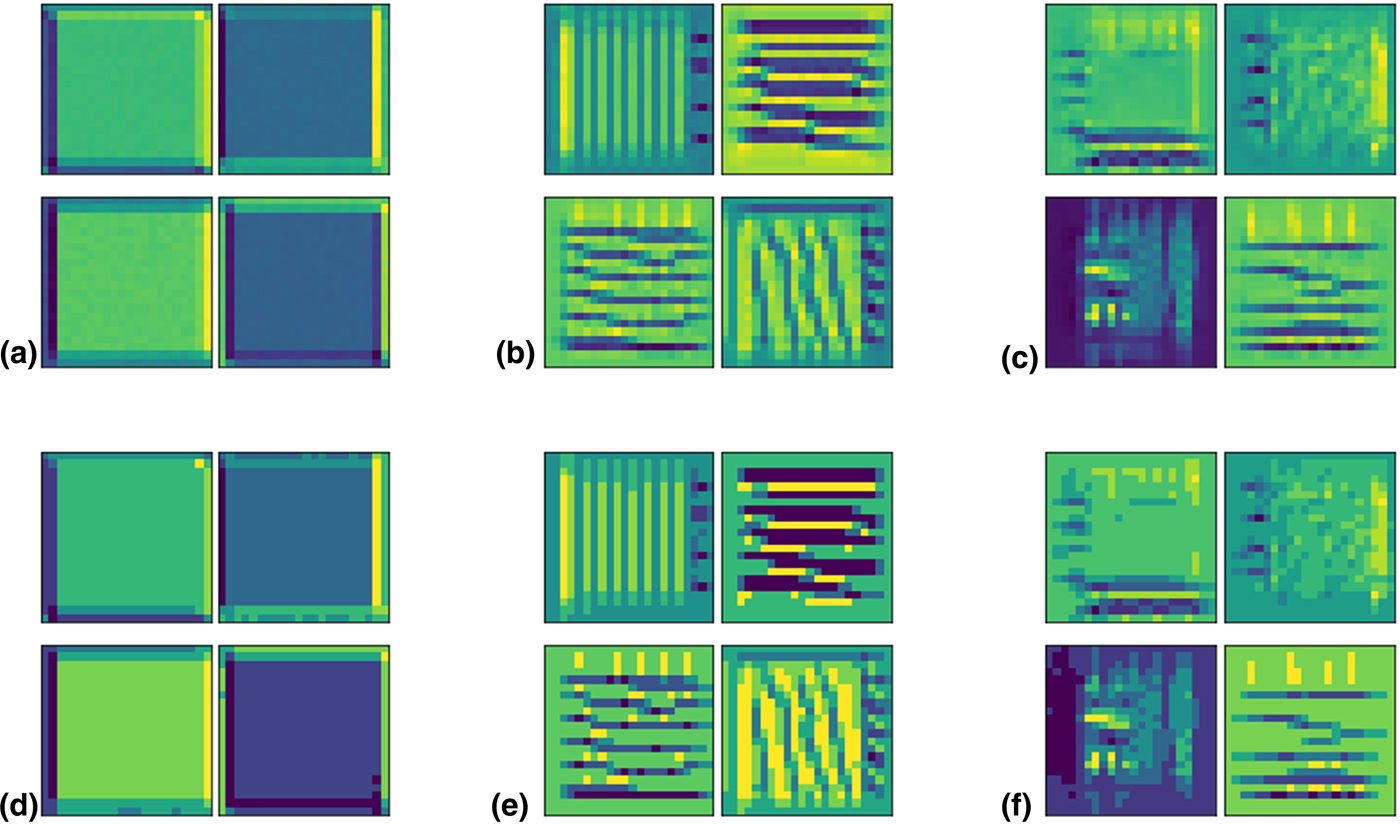
As hypothesized, the learned filters are radically different from those learned for traditional image classification. However, the input cells that most activate each filter in the sequential layers of the CNN still exhibit the hierarchical learning of features that is characteristic of CNNs; in our case, from edges, to stripes, to alternating grids. Using visualization techniques developed by the AI community to explore how CNNs learn to predict various material properties (modulus, strength, and toughness) and how their learning is affected by FEM simulation experimental parameters (crack direction and orientation, composite design constraints) is an unexplored avenue of explanatory AI in scientific applications that we plan to pursue in future work.
Future work
DL is a much faster inference model, capable of making predictions on hundreds of samples in less than a few seconds. In future work, we hope to use optimization algorithms to discover high strength and toughness composite designs based on DL predictions and validated by FEM. In addition, further investigation into neural generative models and more advanced DL models will be undertaken. Finally, significant effort has placed on “opening the black-box” of DL; applying the techniques developed by the AI community, such as convolution filter visualization, to CNNs trained on FEM may help further understanding of how to develop fast approximations of FEM. Ultimately, rapid and accurate simulations based on DL in conjunction with experimental validation via additive manufacturing processes present a novel paradigm for composite design and discovery.
Conclusions
In summary, we have shown that CNNs are capable of accurately predicting mechanical properties of composite materials. Whereas most previous work focused on predicting material's properties in the elastic regime, this study thoroughly investigates the possibility of using ML to detect patterns beyond the elastic regime, overcoming barriers present in current finite element simulation techniques. The relationship between dataset size and various ML algorithms’ performance was investigated and the results for CNN are demonstrated to be generalizable and not specific to a certain CNN architecture. Finally, by visualizing the learned convolution filters, it is demonstrated that the CNN learned hierarchical unit cell features. Use of DL to accelerate FEM calculations offers the tantalizing possibility of discovering novel composite designs via high throughput computation and optimization.
Supplementary material
The supplementary material for this article can be found at https://doi.org/10.1557/mrc.2019.49
Acknowledgments
The authors acknowledge support from the Regents of the University of California, Berkeley and the Extreme Science and Engineering Discovery Environment (XSEDE) Bridges system at the Pittsburgh Supercomputing Center (PSC) through allocation TG-DMR180085, which is supported by National Science Foundation grant number ACI-1548562. The authors also acknowledge support from the Savio computational cluster resource provided by the Berkeley Research Computing program. Additionally, the authors acknowledge support by the Basic Science Research Program (2016R1C1B2011979) and Creative Materials Discovery Program (2016M3D1A1900038) through the National Research Foundation of Korea (NRF), as well as the support by the KAIST-funded Global Singularity Research Program for 2019 (N11190118).