1. Introduction
Subsea power cables constitute key links between offshore power generation facilities (e.g. offshore wind turbines for electricity) and onshore transmission facilities. Integrity of offshore power cables during their operation phase is a crucial issue to be considered in the engineering design and maintenance of those power cables. For sandy or otherwise trench-able seabeds, a common practice is to bury the cables beneath the seabed to protect them from mechanical devices (such as fishing trawls and ship anchors) and excessive hydrodynamic loading induced by environmental conditions as mentioned in DNV-ST-0359 (Det Norske Veritas 2016) and by Palmer & King (Reference Palmer and King2008). Before burial, these cables may temporarily rest in man-made trenches. In a different scenario, trenching becomes significantly more difficult and costly on rocky seabeds. In such cases, an alternative practice to artificial burial of cables is to lay them directly on the seabed surface. Whether cables are temporarily placed in artificial trenches prior to burial or permanently laid on natural seabed features such as valleys or rock outcrops, an accurate assessment of the hydrodynamic forces they experience is essential. This information is crucial for mitigating risks related to excessive flow-induced loadings, and ensuring the structural performance and reliability of subsea cable systems.
As shown in figure 1, the drag and lift coefficients (C D and C L ) acting on a cylindrical structure (pipeline or cable) laid on the seabed under steady flow conditions can be expressed as functions of several non-dimensional parameters, namely
 \begin{align}C_{D},C_{L}=f \big(Re,{k}_{s}^{*},\delta ^{*},{L}_{i}^{*},\varGamma \big),\end{align}
where Re =
 $ UD/\nu$
is the Reynolds number of the incoming flow, with U denoting the freestream velocity, D the cylinder diameter and ν the kinematic viscosity of the fluid. The parameter
 ${k}_{s}^{*}=k_{s}/D$
represents the relative seabed roughness height,
 $\delta ^{*}=\delta /D$
denotes the relative thickness of the inflow boundary layer and
 ${L}_{i}^{*} =L_{i}/D$
defines the relative location of the inflow boundary. The symbol
 $\varGamma$
denotes the seabed geometry. For the trapezoidal trench, which commonly arises in both natural and engineered seabed configurations due to the angle of repose of sediments, the geometry is characterised by the trench-width-to-cylinder-diameter ratio
 $W^{*} = W/D$
, trench-depth-to-cylinder-diameter ratio
 $H^{*} = H/D$
, trench side slope θ and the streamwise offset of the cylinder centre from the trench centreline
 ${L}_{\!P}^{*}={L}_{\!P}/D$
. When θ = 0
 $^{\circ}$
, the configuration reduces to a flat seabed and is taken as the reference geometry. When θ = 90
 $^{\circ}$
, the trench becomes rectangular, whereas when
 $W^{*} = 0$
, it reduces to a triangular cross-section. In this sense, the trapezoidal trench provides a generalised representation that encompasses several limiting seabed geometries and is therefore adopted as a representative cross-section in the present study. Most of the existing studies on hydrodynamic forces are concerned with the flat seabed (figure 1
a) and relatively small artificial trench configurations (figure 1
b), which are often adopted in offshore oil and gas engineering.
Simplified models of trenches in a trapezoidal profile.

Significant research efforts have been devoted to the hydrodynamic forces acting on submarine cylindrical structures resting on a flat seabed. One of the earliest experimental investigations on the hydrodynamic forces acting on a cylinder near a wall in steady flow was conducted by Roshko, Steinolfson & Chattoorgoon (Reference Roshko, Steinolfson and Chattoorgoon1975). Their experiments, carried out in air at Re =
 $2\times 10^{4}$
, investigated the influence of wall proximity on flow-induced forces. The results showed that as the cylinder was moved towards the wall, C
D
decreased rapidly from 1.2 for an isolated cylinder to approximately 0.8 at zero gap ratio, while C
L
peaked upon contact with the wall. This behaviour was attributed to the wall’s interference with the flow around the cylinder, causing the cylinder to be immersed in the lower-energy wall boundary layer. Bearman & Zdravkovich (Reference Bearman and Zdravkovich1978) confirmed this phenomenon through flow visualisation techniques at similar Reynolds numbers (Re =
 $2.5{-}4.8\times 10^{4})$
. Goktun (Reference Goktun1975) further extended these findings, demonstrating that the variation trends of C
D
and C
L
with varying gap ratios given by Roshko et al. (Reference Roshko, Steinolfson and Chattoorgoon1975) remained consistent across different Re and cylinder slenderness ratios
 $ L/D$
(where L is the spanwise length of the cylinder).
Building on an experimental research, Jones (Reference Jones1978) developed a computer programme to determine optimal pipeline specifications under varying conditions, including surface-roughness, water temperature, off-bottom water velocity, water density and bottom friction coefficient. Subsequent studies (e.g. Grace & Nicinski Reference Grace and Nicinski1976; Sarpkaya Reference Sarpkaya1977; Bryndum et al. Reference Bryndum, Jacobsen and Brand1983, Reference Bryndum, Jacobsen and Tsahalis1992) expanded on the research reported by Jones (Reference Jones1978), contributing to the development of practical engineering procedures. The American Gas Association (AGA) and Pipeline Research Council International (PRCI) developed the AGA/PRCI pipeline stability methodology, which provides an accessible framework for on-bottom stability assessment by incorporating the combined effects of hydrodynamic loading, pipe–seabed interaction and environmental conditions into a unified design procedure (INTECSEA Pty Ltd. 2018).
Meanwhile, Det Norske Veritas (DNV) developed the initial version of DNV-RP-F109 (Det Norske Veritas 1988): On-bottom stability design of submarine pipelines, cables and umbilicals, with subsequent revisions in 2002, 2010 and 2021. According to the recent DNV-RP-F109 (Det Norske Veritas 2021), the hydrodynamic forces on a stationary pipeline or cable, accounting for effects such as trenching, marine growth and other influencing factors, under steady flow can be determined using
 \begin{align}F_{Y}(t)=R_{Y}\times \frac{1}{2}\rho C_{Y}(t)DU^{2}; \\[-28pt] \nonumber \end{align}
 \begin{align}F_{Z}(t)=R_{Z}\times \frac{1}{2}\rho C_{Z}(t)DU^{2}, \\[0pt] \nonumber \end{align}
where
 $F_{Y}(t)$
and
 $F_{Z}(t)$
are the hydrodynamic drag and lift forces;
 $\rho$
represents the fluid density;
 $C_{Y}(t)$
and
 $C_{Z}(t)$
denote the respective time-dependent drag and lift coefficients; and
 $R_{Y}$
and
 $R_{Z}$
denote the drag and lift reduction factors due to various influencing factors. The values of
 $R_{Y}$
,
 $R_{Z}$
,
 $C_{Y}(t)$
and
 $C_{Z}(t)$
can be obtained from lookup tables and equations in § 6 of DNV-RP-F109 (Det Norske Veritas 2021).
Research on subsea cylindrical structures has not ceased with the introduction of general design recommendations, but has continued to evolve, based on improved knowledge on different aspects that are related to the stability of a cylindrical structure near the seabed. Taniguchi & Miyakoshi (Reference Taniguchi and Miyakoshi1990) identified a critical gap height between a cylinder and a plane wall that influenced the formation of Kármán vortex streets. They found that this critical gap height correlated well with the thickness of the turbulent boundary layer and could be quantified by the local minimum of the fluctuating drag or lift force acting on the cylinder. Taking a different perspective, Lei, Cheng & Kavanagh (Reference Lei, Cheng and Kavanagh1999) demonstrated that gap height and turbulent boundary layer flow significantly affected the mean forces on the cylinder and the flow patterns around it. This conclusion was further supported by Dipankar & Sengupta (Reference Dipankar and Sengupta2005) and Oner, Kirkgoz & Sami Akoz (Reference Oner, Kirkgoz and Sami Akoz2008). Subsequent research has primarily focused on the flow mechanisms around a near-wall cylinder, expanding the understanding of vortex dynamics, pressure distribution and force fluctuations. Studies by Okhotnikov et al. (Reference Okhotnikov, Molochnikov, Mazo, Malyukov, Goltsman and Saushin2017), Tong et al. (Reference Tong, Cheng, An and Griffiths2017), Chen & Wu (Reference Chen and Wu2019) and Tong et al. (Reference Tong, Cheng, An, Griffiths and Ren2025) have provided detailed numerical and experimental insights, further elucidating the hydrodynamic behaviour of cylinders in the presence of wall effects and boundary layer interactions.
For cylindrical structures laid in artificial trenches, the existing studies typically model them as a smooth circular cylinder and assume the trench has a trapezoidal shape, as illustrated in figure 1(b). Dimensionless analysis suggests the hydrodynamic response of the cylinder is predominantly influenced by the trench configurations (
 $ W^{*}$
,
 $ H^{*}$
, θ and
 ${L}_{\!P}^{*}$
) and inflow conditions (Re,
 ${k}_{s}^{*}$
,
 $\delta ^{*}$
and
 ${L}_{i}^{*}$
). Several studies have investigated the behaviour of cylinders within trenches, focusing on the influences of one or more of these parameters on hydrodynamic forces. The drag force reduction factor (
 $R_D$
) and lift force reduction factor (
 $R_L$
) attributed to trenching are commonly expressed in the following form:
 \begin{align}R_{D}=\frac{C_{D,t}}{C_{D,f}}; \\[-28pt] \nonumber \end{align}
 \begin{align}R_{L}=\frac{C_{L,t}}{C_{L,f}}, \\[0pt] \nonumber \end{align}
in which
 $(C_{D,t},C_{L,t})$
and
 $(C_{D,f},C_{L,f})$
represent the force coefficients for a cylinder in the trench and on a flat seabed under identical flow conditions, respectively.
Wilkinson et al. (Reference Wilkinson, Palmer, Ells, Seymour and Sanderson1988) conducted a series of experimental tests on pipelines in trenches with varying
 $ H^{*}$
(= 0.5 and 1) to optimise the concrete coating thickness required for a 24-inch West Sole gas pipeline, ensuring stability during installation and throughout its design life span. Jo et al. (Reference Jo, Lee, Shin, Hong and Min2002) numerically simulated flow over a pipeline, and validated the results against particle image velocimetry (PIV) measurements to examine the effects of
 $ H^{*}$
(= 2, 3 and 4), θ (= 11.41
 $^{\circ}$
, 18.44
 $^{\circ}$
and 45
 $^{\circ}$
), Re (=
 $6\times 10^{3}$
,
 $6\times 10^{4}$
and
 $3\times 10^{5}$
) and
 $\delta ^{*}$
(= 0.1, 0.15 and 0.2) on the hydrodynamic forces acting on a pipeline. The importance of these parameters was also highlighted by Sumer & Fredsøe (Reference Sumer and Fredsøe2006), where both Re (=
 $1.5\times 10^{4}$
–
 $3\times 10^{4}$
) and
 ${L}_{\!P}^{*}$
(= −2.5, 0 and 2.5) were shown to significantly influence the resulting forces. A parameter study on
 $ H^{*}$
(= 0.5 and 1) and θ (= 5.71
 $^{\circ}$
, 9.46
 $^{\circ}$
and 18.44
 $^{\circ}$
) was conducted by Griffiths et al. (Reference Griffiths, Shen, Xu and Leggoe2012) to evaluate the accuracy and suitability of DNV-RP-F109 load factors using both two-dimensional (2-D) and three-dimensional (3-D) numerical simulations. These studies collectively demonstrated that both R
D
and R
L
generally decrease with increasing
 $ H^{*}$
, while remaining relatively unaffected by changes in
 $\delta ^{*}$
. However, the trends become more complex when the influences of multiple parameters are considered together. For instance, the rate at which R
D
and R
L
decrease with increasing
 $ H^{*}$
slows as the trench becomes wider (
 $ W^{*}$
ranging from 0 to 2). Regarding the effect of Re, the reduction factors decline more sharply in shallow trenches with gentle side slopes (e.g. θ = 11.41
 $^{\circ}$
) compared with steeper ones (e.g. θ = 45
 $^{\circ}$
). Additionally, while R
D
tends to decrease monotonically with increasing θ in wider and deeper trenches (
 $ W^{*}$
= 2,
 $ H^{*}$
= 3), the variation becomes more intricate and less predictable in a narrow and shallow trench (
 $ W^{*}$
= 0,
 $ H^{*}$
= 0.5). Notably, previous studies have largely concentrated on narrow trenches (
 $ W^{*}$
 $\leq$
5), with limited attention given to the systematic effects of
 $ W^{*}$
on the hydrodynamic forces acting on the cylinder.
To simplify calculations and provide practical guidance for engineering applications, the reduction factors in (1.2) and (1.3), which quantify the effects of artificially trenched configurations, namely
 $ H^{*}$
and θ, on the hydrodynamic forces in DNV-RP-F109 (Det Norske Veritas 2021), are expressed as
 \begin{align}R_{Y}=1.0-0.18\boldsymbol{\cdot }\left(\theta -5\right)^{0.25}\boldsymbol{\cdot }\left(H^{*}\right)^{0.42}; \\[-28pt] \nonumber \end{align}
 \begin{align}R_{Z}=1.0-0.14\boldsymbol{\cdot }\left(\theta -5\right)^{0.43}\boldsymbol{\cdot }\left(H^{*}\right)^{0.46}, \\[0pt] \nonumber \end{align}
where both
 $R_{Y}$
and
 $R_{Z}$
exhibit monotonic decrease with increasing
 $ H^{*}$
and θ. However, (1.6) and (1.7) apply only to shallow trenches (
 $ H^{*} \lt 1$
and
 $ \theta \lt 45^{\circ}$
), while the effects of
 $ W^{*}$
, Re and
 $\delta ^{*}$
are entirely neglected. The comparison between the effects of
 $ H^{*}$
and θ predicted by DNV-RP-F109 (Det Norske Veritas 2021) and previous studies reveals poor consistency. It has been demonstrated by Griffiths et al. (Reference Griffiths, Shen, Xu and Leggoe2012) that the sheltering effect of the trench is sometimes overestimated or underestimated by (1.6) and (1.7) for shallow trenches (
 $ H^{*}$
= 0.5) and deep trenches (
 $ H^{*}$
≥ 1) with varying side slopes.
One of the limiting cases of trench configurations is the cavity, a canonical geometry that has been extensively studied in fluid mechanics due to its fundamental importance in understanding shear layer behaviour and flow–structure interactions. Depending on the cavity’s width-to-depth ratio, distinct flow regimes emerge, typically classified as closed, transitional and open cavity flows (Everhart et al. Reference Everhart, Alter, Merski, Wood and Prabhu2006). Figure 2 illustrates these regimes: (a) in the open cavity, the outer shear layer spans the cavity without penetrating it, leading to fully enclosed recirculating eddies; (b) in the transitional cavity, the shear layer intermittently dips into the cavity and interacts with the internal recirculation zone, forming a more complex, partially open regime; and (c) in the closed cavity, the shear layer fully enters the cavity, impinges on the cavity bottom, and reattaches before exiting, facilitating substantial momentum exchange between the outer flow and the cavity interior. These regimes are referenced throughout this study to help interpret the observed flow phenomena in various trench geometries, particularly in terms of shear-layer behaviour and wake dynamics.
Schematic illustration of classic cavity flow regimes adapted from Everhart et al. (Reference Everhart, Alter, Merski, Wood and Prabhu2006), showing the evolution of flow behaviour with increasing cavity width-to-depth ratio. (a) Open cavity flow, (b) transitional cavity flow and (c) closed cavity flow.

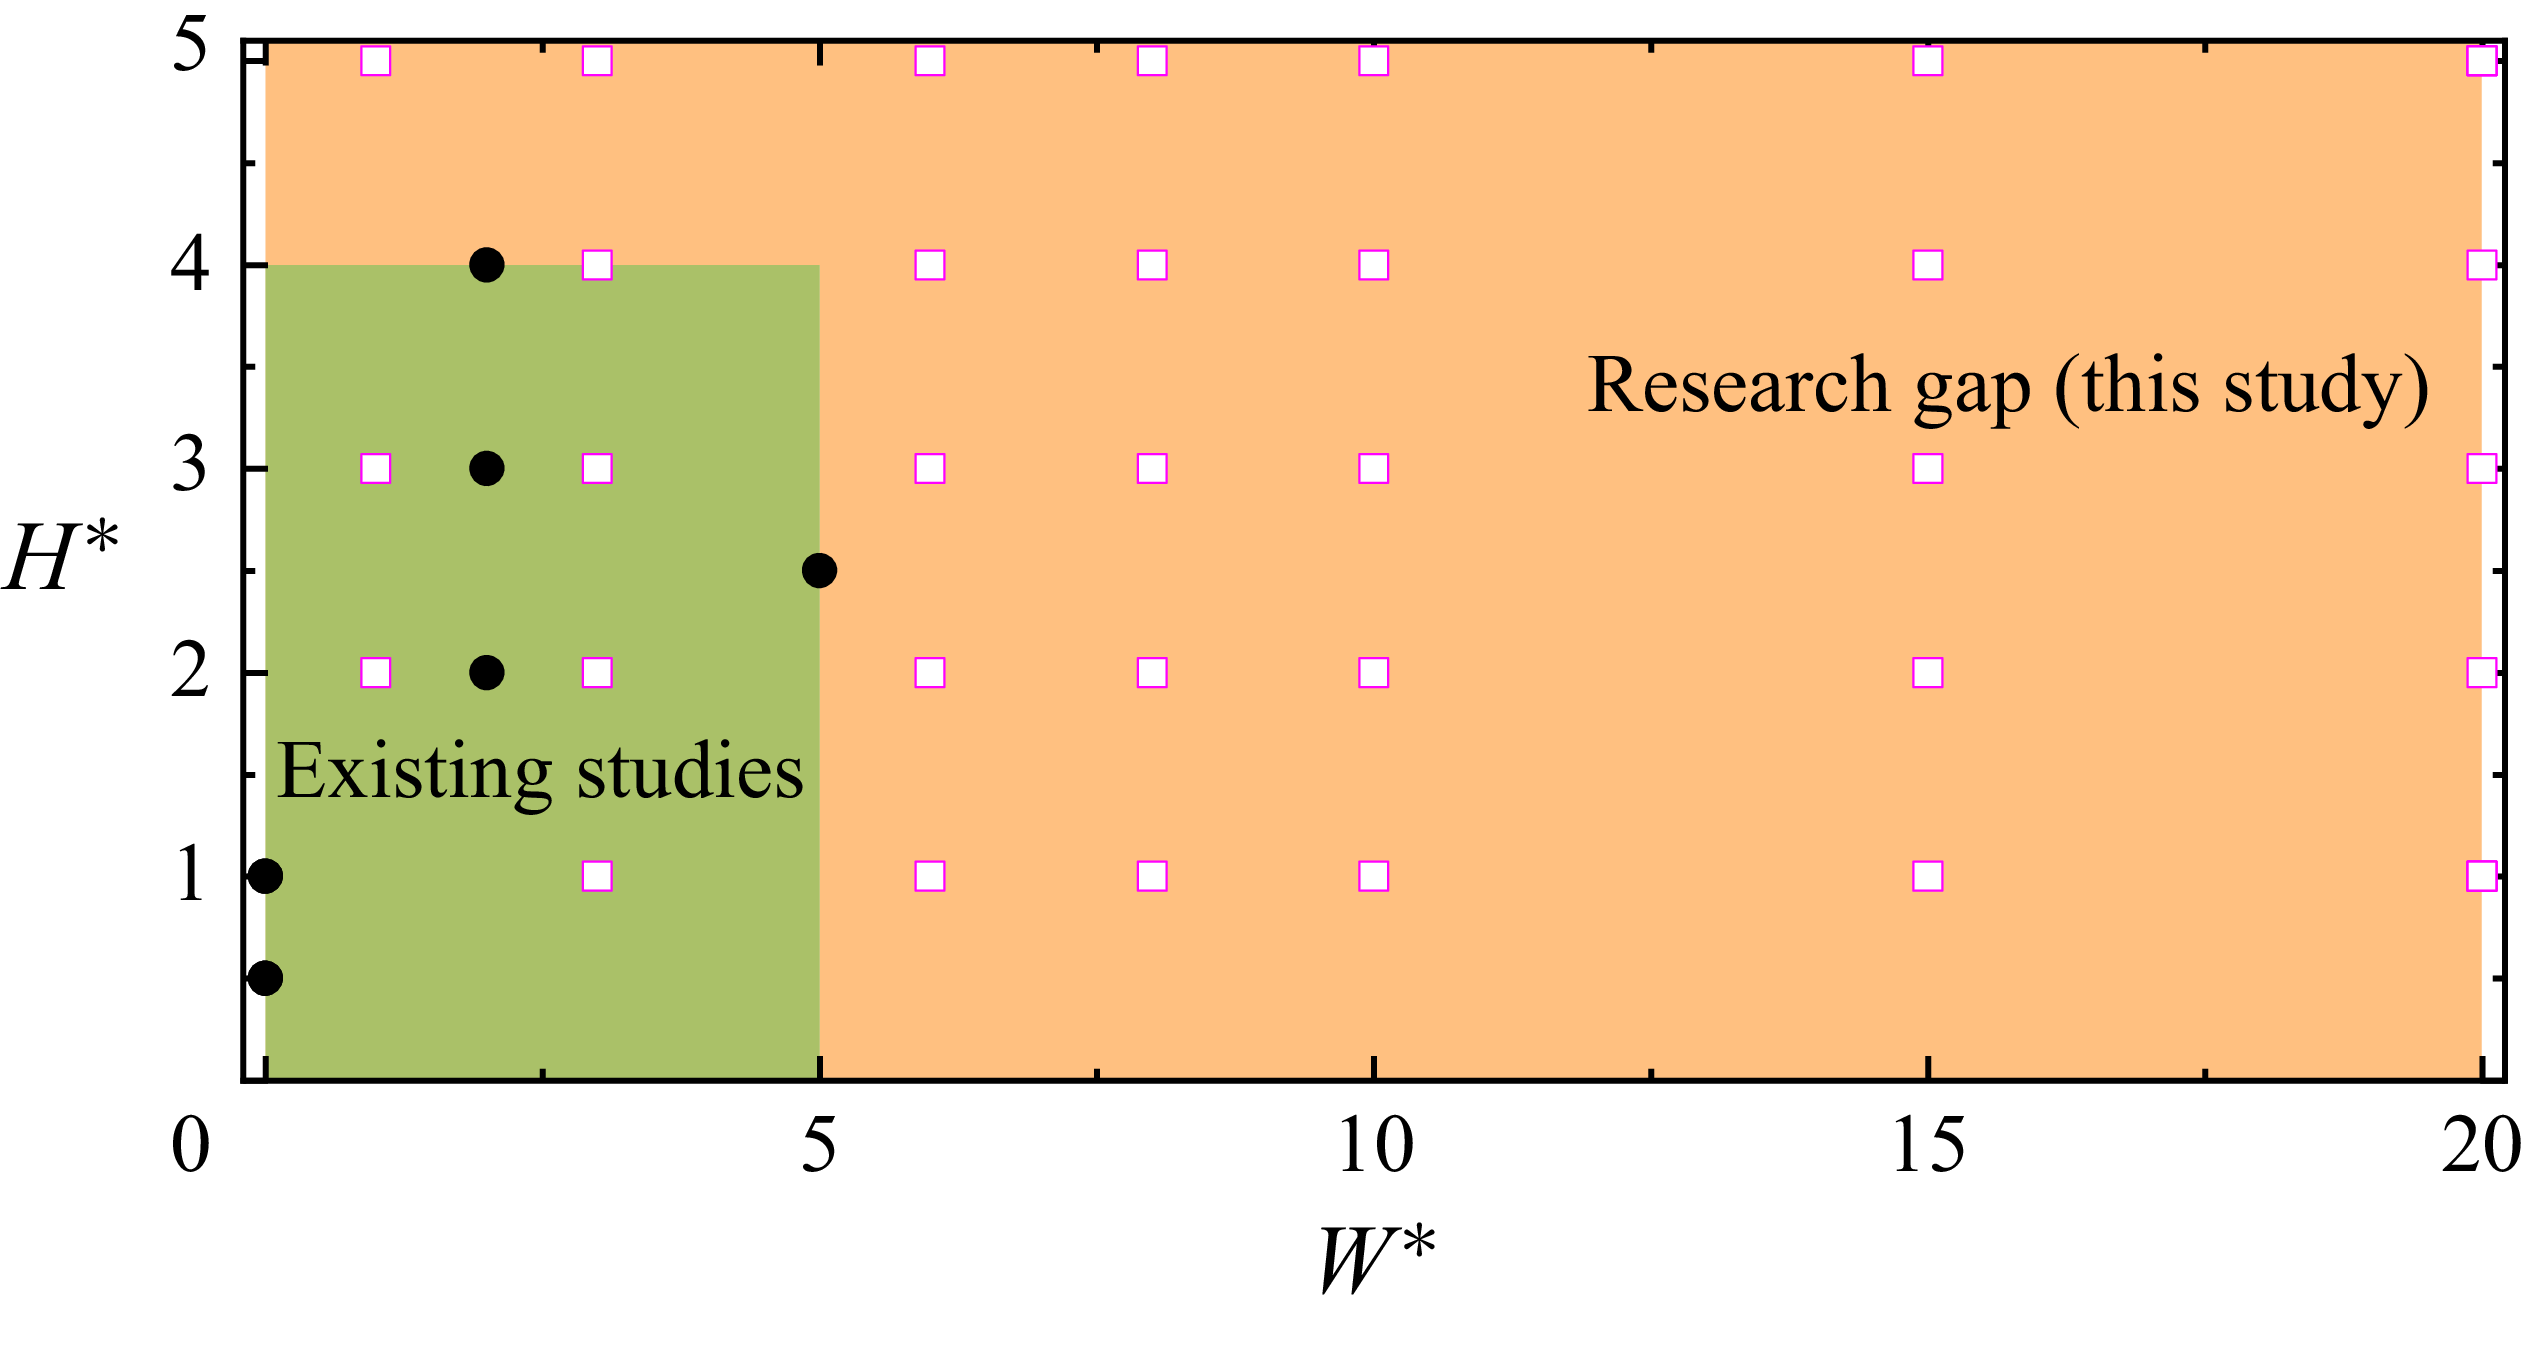
As shown in figure 3, although some studies have addressed cylinders in artificial trenches, research on hydrodynamic forces acting on those placed in natural seabed valleys or large artificial trenches remains limited. This gap is particularly relevant for offshore power cables, which are much smaller than the pipelines typically studied in applications relevant to offshore oil and gas industry. Liu et al. (Reference Liu, Cheng, Ren, Griffiths and Tong2023) conducted a preliminary investigation of steady flow past a cylinder in a trench with varying trench configurations (θ = 30°,
 $W^{*}$
= 3–20 and
 $H^{*}$
= 1–15), primarily employing 2-D direct numerical simulation (DNS). This study explicitly identified three distinct flow regimes: no vortex shedding regime, oscillatory regime and irregular regime, which evolved as
 $W^{*}$
and
 $H^{*}$
increased. The results also highlighted the important role of 3-D effects in governing the transitions between these regimes. However, due to constraints in computational resources and time, only three 3-D cases were simulated, limiting the ability to comprehensively evaluate the influence of 3-D flow structures.
Parameter space of
 $ W^{*}$
and
 $ H^{*}$
explored in existing studies for
 $\theta$
< 45
 $^{\circ}$
(green region with black circles from Wilkinson et al. (Reference Wilkinson, Palmer, Ells, Seymour and Sanderson1988), Jo et al. (Reference Jo, Lee, Shin, Hong and Min2002), Sumer & Fredsøe (Reference Sumer and Fredsøe2006) and Griffiths et al. (Reference Griffiths, Shen, Xu and Leggoe2012)), and the broader range investigated in the present study (orange region with magenta squares). This highlights the research gap addressed by this study, particularly for wide and deep trench configurations not previously examined.

Although previous studies have predominantly focused on flat seabed or a limited range of narrow trench configurations, often using 2-D approaches, a systematic investigation spanning a broader parameter space remains scarce. The present study addresses this gap by developing a comprehensive understanding of flow over a cylinder situated within natural seabed valleys or relatively deep and wide artificial trenches under steady current conditions, thereby providing insight into trench configurations that lie outside the typical assumptions of existing design frameworks. To this end, a series of 3-D simulations was conducted, focusing on the influences of
 $ W^{*}$
,
 $ H^{*}$
, θ,
 ${L}_{\!P}^{*}$
and Re on hydrodynamic forces and flow characteristics. It is noted that the seabed is assumed to be hydraulically smooth in the present study, and the potential influence of the relative seabed roughness height
 ${k}_{s}^{*}$
on the flow dynamics and hydrodynamic forces is not considered. In addition, the relative thickness of the inflow boundary layer
 $\delta ^{*}$
and the relative location of the inflow boundary
 ${L}_{i}^{*}$
are kept fixed to isolate the effects of trench geometry and Reynolds number on the hydrodynamic response of the cylinder. The present study is restricted to steady current conditions and the complex irregular wave–current combinations typically considered in design practices such as DNV-RP-F109 are not addressed.
The remainder of this paper is structured as follows. Section 2 provides a brief overview of the numerical method, parameter selection and numerical validation. Section 3 presents the results and analysis on hydrodynamic responses of the cylinder inside various trenches. Discussions and major conclusions are summarised in §§ 4 and 5, respectively. Additionally, a detailed mesh sensitivity study, linear interpolation for forces calculations and statistical convergence check are provided in Appendices A–C.
2. Methodology
2.1. Numerical method
The governing equations for the high-fidelity 3-D implicit large-eddy simulation (iLES) are the dimensional incompressible Navier–Stokes (N–S) equations:
 \begin{align}\boldsymbol{\nabla }\boldsymbol{\cdot }\boldsymbol{u}=0, \\[-28pt] \nonumber \end{align}
 \begin{align}\frac{\partial \boldsymbol{u}}{\partial t}+\boldsymbol{u}\boldsymbol{\cdot }\boldsymbol{\nabla }\boldsymbol{u}=-\frac{\boldsymbol{\nabla }p}{\rho }+\nu {\nabla} ^{2}\boldsymbol{u}, \\[0pt] \nonumber \end{align}
where
u
= (u, v, w) is the velocity vector, p the pressure,
 $\rho$
the fluid density and ν the kinematic viscosity. All variables are subsequently non-dimensionalised using the free stream velocity U, cylinder diameter D and the fluid density
 $\rho$
when presenting the results.
Equations (2.1) and (2.2) are directly solved by using the Incompressible Navier–Stokes Solver in the open-source software package Nektar++ (Cantwell et al. Reference Cantwell2015), where a spectral/hp element method is employed in the cross-sectional direction (x–y plane), and a Fourier expansion method is used in the spanwise direction (z-direction) (Karniadakis 1990). The mesh resolution in the x–y plane is controlled through a combination of h-type and p-type refinements. The h-type increases the number of macro-elements by subdividing the computational domain, whereas the p-type refinement enhances spatial accuracy by increasing the polynomial interpolation order (
 $N_{p}-1$
) within each element, where
 $N_{p}$
denotes the number of solution points. The inset in figure 4 represents the distributions of h-type (black lines) and p-type mesh (grey lines) near the cylinder surface. Consequently, the total number of grid subdivisions in the x–y plane is given by
 ${N_{xy}}=N_{el}\times (N_{p}-1)^{2}$
, where
 $N_{el}$
denotes the total number of macro-elements in the h-type mesh. In the spanwise direction, the discretisation spacing is determined by the cylinder span length L
z
and the number of non-zero Fourier modes N
z
, giving
 $ \Delta_{z} = L_{z}/N_{z}$
. In the present study, fifth-order Lagrange polynomials (N
p
= 6) are used for spatial discretisation in the x–y plane. In contrast, the spanwise length L
z
is fixed as 3D (where D denotes the cylinder diameter) and the number of Fourier modes N
z
= 96 is employed in the spanwise direction. A second-order implicit–explicit time-integration scheme, a velocity correction scheme and a continuous Galerkin projection are employed to solve (2.1) and (2.2) (Jiang & Cheng Reference Jiang and Cheng2021). A spectral vanishing viscosity (SVV) technique (Kirby & Sherwin Reference Kirby and Sherwin2006) is applied to stabilise the solution by selectively increasing viscosity on the highest-order spectral modes, which corresponds to the smallest resolved scales. This selective damping is physically motivated by the scale-separation concept in turbulent flows, where energy is transferred from large to progressively smaller scales before being dissipated at the smallest scales. By restricting the artificial dissipation to the high-order spectral modes, the SVV formulation stabilises under-resolved high-wavenumber components while preserving the accuracy of the resolved large-scale flow dynamics (Tadmor Reference Tadmor1989; Karamanos & Karniadakis Reference Karamanos and Karniadakis2000). The SVV parameters adopted in the present study follow those used in our previous investigation of steady flow past an isolated cylinder at Re = 400–3900 (Jiang & Cheng Reference Jiang and Cheng2021). Specifically, the SVV cut-off ratio is set to 0.75, meaning the first 75 % of spectral modes remain undamped. The SVV diffusion coefficient is set to 0.1, which controls the strength of the dissipation applied to the higher-order spectral modes.
Computational domain, h-type mesh (the physical mesh) distributions of cylinder in a trench.

As illustrated in figure 4, the origin of the reference Cartesian coordinate system (x, y) is positioned at the centre of the trench along the x-axis and at the centre of the cylinder along the y-axis. The distances from the origin to the outlet and top boundaries are defined as
 $ L_{o}$
= 100D and
 $ L_{t}$
= 20D + H (where H denotes the depth of the trench), respectively. A length of
 $ L_{i}$
= 100D is selected as the distance from the origin to the inlet boundary for all the simulations. For velocity conditions, a Dirichlet boundary condition (u = U, v = 0 and w = 0) is specified on the inlet and top boundaries of the computational domain, while a Neumann boundary condition (
 $ \partial u/\partial x = 0$
,
 $ \partial v/\partial x = 0$
and
 $ \partial w/\partial x = 0$
) is implemented on the outlet boundary. A no-slip boundary condition is enforced on the wall and the cylinder surface. A zero Dirichlet pressure condition is enforced on the outlet condition, while a high-order Neumann condition for pressure, as suggested by Karniadakis, Israeli & Orszag (Reference Karniadakis, Israeli and Orszag1991) and Blackburn & Sherwin (Reference Blackburn and Sherwin2004), is specified on other boundaries. This inflow configuration provides a uniform steady current and is adopted as a simplified baseline for examining the shear-layer dynamics and flow–structure interaction in the trench–cylinder system under steady flow conditions.
Notably, the cylinders used in this study is partially buried in the seabed (approximately 7 %, shown as the grey dashed lines in figure 4) for easier mesh generation around the cylinder and reduced computational cost. Hence, the mean force acting on the cylinder is rectified by a linear interpolation of the two points of intersections between the cylinder and the seabed as Griffiths et al. (Reference Griffiths, Shen, Xu and Leggoe2012) mentioned in their research. The detail of the linear interpolation is illustrated in Appendix B.
A zero initial condition is specified in all the cases in the present study. The non-dimensional time step
 ${\unicode{x0394}}t^{*}$
for each case is chosen to be
 ${\unicode{x0394}}t^{*} = 0.001$
, based on the Courant–Friedrichs–Lewy (CFL) stability criterion, which is defined as
 \begin{align}\mathrm{CFL}=\frac{\left| \boldsymbol{u}\right| {\unicode{x0394}} t^{*}}{{\unicode{x0394}} l},\end{align}
where
 $| \boldsymbol{u}|$
is the magnitude of the velocity in each cell and
 ${\unicode{x0394}} l$
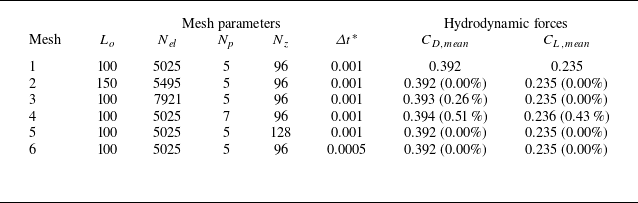
is the cell size in the direction of the velocity. The maximum value of CFL is kept smaller than 0.5 herein for all the cases in the present study, which has been demonstrated to be sufficient for ensuring numerical accuracy in Nektar++ (Ren et al. Reference Ren, Cheng, Xiong, Tong and Chen2021). Detailed mesh convergence check can be found in Appendix A.
In the present study, six types of statistical force coefficients are frequently used. They are defined as follows.
-
(i) The instantaneous drag coefficient C D (t), which is defined as
 $C_{D}(t)=F_{D}(t)/({1}/{2}\rho U^{2}(D-e)L_{z})$
, where F
D
(t) is the total instantaneous drag force on the cylinder and e is the embedment depth of the cylinder which is equal to
${2-\sqrt{3}}/{4}D$
in the present study.
-
(ii) The instantaneous lift coefficient C L (t), which is defined as
$C_{L}(t)=F_{L}(t)/({1}/{2}\rho U^{2}(D-e)L_{z})$
, where F
L
(t) is the total instantaneous lift force on the cylinder. -
(iii) The mean drag coefficient C D,mean , which is the average value of the drag coefficient over a statistical period of 400 non-dimensional time units (t*), for which statistical convergence has been verified in Appendix C.
-
(iv) The mean lift coefficient C L,mean , which is the average value of the lift coefficient over a statistical period of 400 t * .
-
(v) The root-mean-square (r.m.s.) drag coefficient C D,rms , which is defined as
$C_{D,rms}=\sqrt{{1}/{T}{\int }_{0}^{T}(C_{D}(t)-C_{D,mean})^{2}\,\text{d}t}$
, where T is the statistical period (= 400 t*). -
(vi) The r.m.s. lift coefficient C L,rms , which is defined as
$C_{L,rms}=\sqrt{{1}/{T}{\int }_{0}^{T}(C_{L}(t)-C_{L,mean})^{2}\,\text{d}t}$
.


Noted that the instantaneous drag and lift coefficients are used to analyse forces acting on the cylinder at specific time instants, providing real-time insights into its performance; the mean coefficients offer an average value over time, which is useful for assessing overall behaviour under steady incoming flow conditions; the r.m.s. coefficients quantify the fluctuations in drag and lift, helping to understand the amplitude of temporal oscillations of forces experienced by the cylinder.
In addition, the dominant frequency f, normalised by U and D, is extracted from the spectra of the force coefficients and selected flow-field quantities. The surface pressure coefficient
 $C_{p}$
is also used in the present study and is defined as
 $C_{p}= (p_{mean}-p_{0,mean})/({1}/{2}\rho U^{2})$
, where
 $p_{mean}$
and
 $p_{0,mean}$
are the surface and outlet pressures, respectively, averaged over a statistical period of 400
 $ t^{*}$
.
Together, these coefficients enable a comprehensive evaluation of hydrodynamic performance of the cylinder in trenches of various configurations and governing flow parameters.
2.2. Parameter selection
This section introduces the governing parameters in the present study and examines the influence of
 $ W^{*}$
,
 $ H^{*}$
, θ,
 ${L}_{\!P}^{*}$
and Re on the hydrodynamic force coefficients. Since a full combination of those parameters would be computational prohibitive, the influence of a specific parameter is investigated through varying the parameter while keeping most of the other parameters as constant values. By defaults, following strategies are adopted specifically under the conditions of
 ${L}_{i}^{*}$
= 100 and
 $\delta ^{*}$
= 0 to ensure that the flow is fully developed before interacting with the cylinder as suggested by Houghton et al. (Reference Houghton, Collicott, Carpenter and Valentine2016). These strategies are summarised as follows.
-
(i) Influence of
$ W^{*}$
and
$ H^{*}$
are investigated over the ranges of 1
$\leq$
$ W^{*}$
$\leq$
20 and 1
$\leq$
$ H^{*}$
$\leq$
5 with
$\theta$
= 30
$^{\circ}$
, Re = 3900 and
${L}_{p}^{*}$
= 0. -
(ii) Influence of
$\theta$
is quantified from 15
$^{\circ}$
to 60
$^{\circ}$
with (
$ W^{*}$
,
$ H^{*}$
) = (20, 1) and (20, 5), Re = 3900 and
${L}_{p}^{*}$
= 0. -
(iii) Influence of
${L}_{p}^{*}$
is investigated between −8.5 and 8.0 with (
$ W^{*}$
,
$ H^{*}$
) = (20, 1),
$\theta$
= 30
$^{\circ}$
and Re = 3900. -
(iv) Influence of Re is checked at Re = 500, 1000, 2000, 3000 and 3900 with (
$ W^{*}$
,
$ H^{*}$
) = (6, 1), (20, 1), (20, 3) and (20, 5),
$\theta$
= 30
$^{\circ}$
and
${L}_{p}^{*}$
= 0.


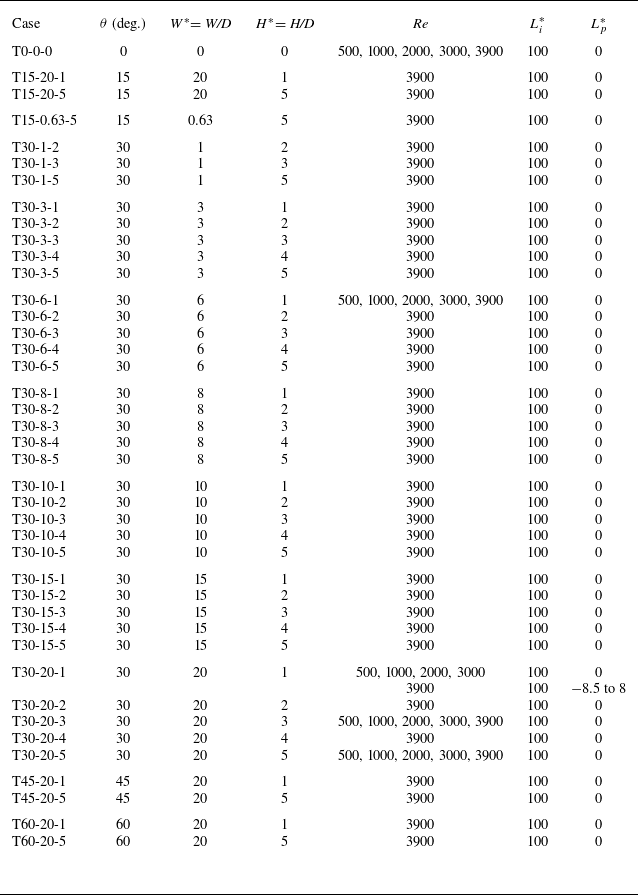
The above-mentioned combinations of parameters lead to a total of 76 iLES cases, which are detailed in table 1. The case number is denoted as ‘T
 $\theta$
-
 $ W^{*}$
–
 $ H^{*}$
’, where T,
 $\theta$
,
 $ W^{*}$
and
 $ H^{*}$
denote trench configuration, side slope angle, trench-width-to-cylinder-diameter ratio and trench-depth-to-cylinder-diameter ratio, respectively.
Detailed case information considered in the present study.

The default Re = 3900 is adopted in strategies (i), (ii) and (iii) based on several considerations. First, the Re = 3900 falls within the subcritical regime (300 < Re < 3
 $\times$
105) for an isolated cylinder in steady current, where the wake is expected to be turbulent and the laminar boundary layer separates from the cylinder surface (Sumer & Fredsøe Reference Sumer and Fredsøe2006). In this regime, the time-averaged force coefficients on an isolated stationary cylinder are weakly dependent on Re as mentioned by Sumer & Fredsøe (Reference Sumer and Fredsøe2006), indicating that the findings at Re = 3900 could potentially be extended to practical engineering conditions for subsea cables (Re > 104). However, the flow behaviour beyond the subcritical regime (Re
 $\gt$
∼3 × 10⁵) is not addressed in the present study and is left for future investigation. Additionally, Re = 3900 is widely recognised as a benchmark case in computational fluid dynamics (CFD) studies of flow past an isolated circular cylinder, for which extensive experimental and numerical reference data are available (e.g. Norberg Reference Norberg1994; Afgan et al. Reference Afgan, Kahil, Benhamadouche and Sagaut2011; Gallardo, Andersson & Pettersen Reference Gallardo, Andersson and Pettersen2014; Jiang & Cheng Reference Jiang and Cheng2017). As discussed further in § 2.3, the good agreement between the present results and these well-established datasets for the isolated-cylinder configuration at Re = 3900 provides confidence in the accuracy of the adopted mesh resolution and numerical methodology. Simulations of flow over a cylinder laid on a flat seabed, denoted as T0-0-0, are also carried out at different Re for the purpose of comparison with those cases with the cylinder in a trench.
2.3. Numerical validation
Validation tests were conducted for two scenarios. The first is conducted for flow around an isolated cylinder at Re = 3900 to assess the applicability of the numerical model used in this study. The second validation is conducted for flow past a near-wall cylinder with different gap-to-cylinder-diameter ratio (
 $ G/D$
) at Re = 3900, aiming to evaluate its accuracy in capturing hydrodynamic features near a wall.
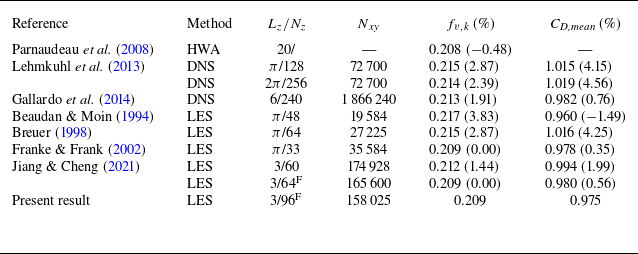
Table 2 summarises key parameters from previous studies on flow past an isolated cylinder at Re = 3900, including the total mesh resolution in the x–y plane (N
xy
), the spanwise domain length and resolution (
 $ L_{z}/N_{z}$
). It compares the reported frequency of the Kármán vortex street (
 $ f_{v,k}$
) and the mean drag force coefficient (C
D,mean
) from those studies with the corresponding values obtained in the present validation case. The close agreement, where the maximum differences in
 $ f_{v,k}$
and C
D,mean
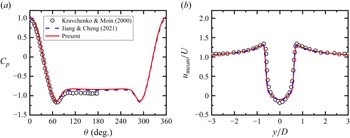
are less than 4 % and 5 % across all cases mentioned in table 2, highlights the consistency and reliability of the numerical approach adopted in this study. This agreement is further supported by figure 5, which compares the surface pressure coefficient distributions and the time-averaged streamwise velocity profile sampled at
 $ x/D$
= 1.06 from the present study with those reported in previous investigations (Kravchenko & Moin Reference Kravchenko and Moin2000; Jiang & Cheng Reference Jiang and Cheng2021). The close collapse of the profiles demonstrates that the present simulations accurately capture the key flow features associated with Kármán vortex shedding, thereby providing additional confidence in the validity and robustness of the numerical results.
Studies of flow past an isolated cylinder at Re = 3900, which provide the frequency of the Kármán vortex street
 $ f_{v,k}$
and the mean drag force coefficient C
D,mean
. The abbreviations HWA, DNS and LES represent hot wire anemometry, direct numerical simulation and large-eddy simulation, respectively. The superscript ‘F’ denotes simulations in which the spanwise direction is treated using a Fourier spectral discretisation. Accordingly, N
z
corresponds to the number of non-zero Fourier modes retained. For simulations without the superscript ‘F’, N
z
instead refers to the number of grid subdivisions in the physical z-direction. The total number of grid subdivisions in the x–y plane is denoted by N
xy
.The values in the brackets behind
 $ f_{v,k}$
and C
D,mean
are the relative difference compared with the present study.

(a) Surface pressure coefficient (
 $C_{p}$
) distributions around an isolated circular cylinder and (b) the time-averaged streamwise velocity profile sampled at
 $ x/D$
= 1.06at Re = 3900. The present results are compared with reference data from Kravchenko & Moin (Reference Kravchenko and Moin2000) and Jiang & Cheng (Reference Jiang and Cheng2021).

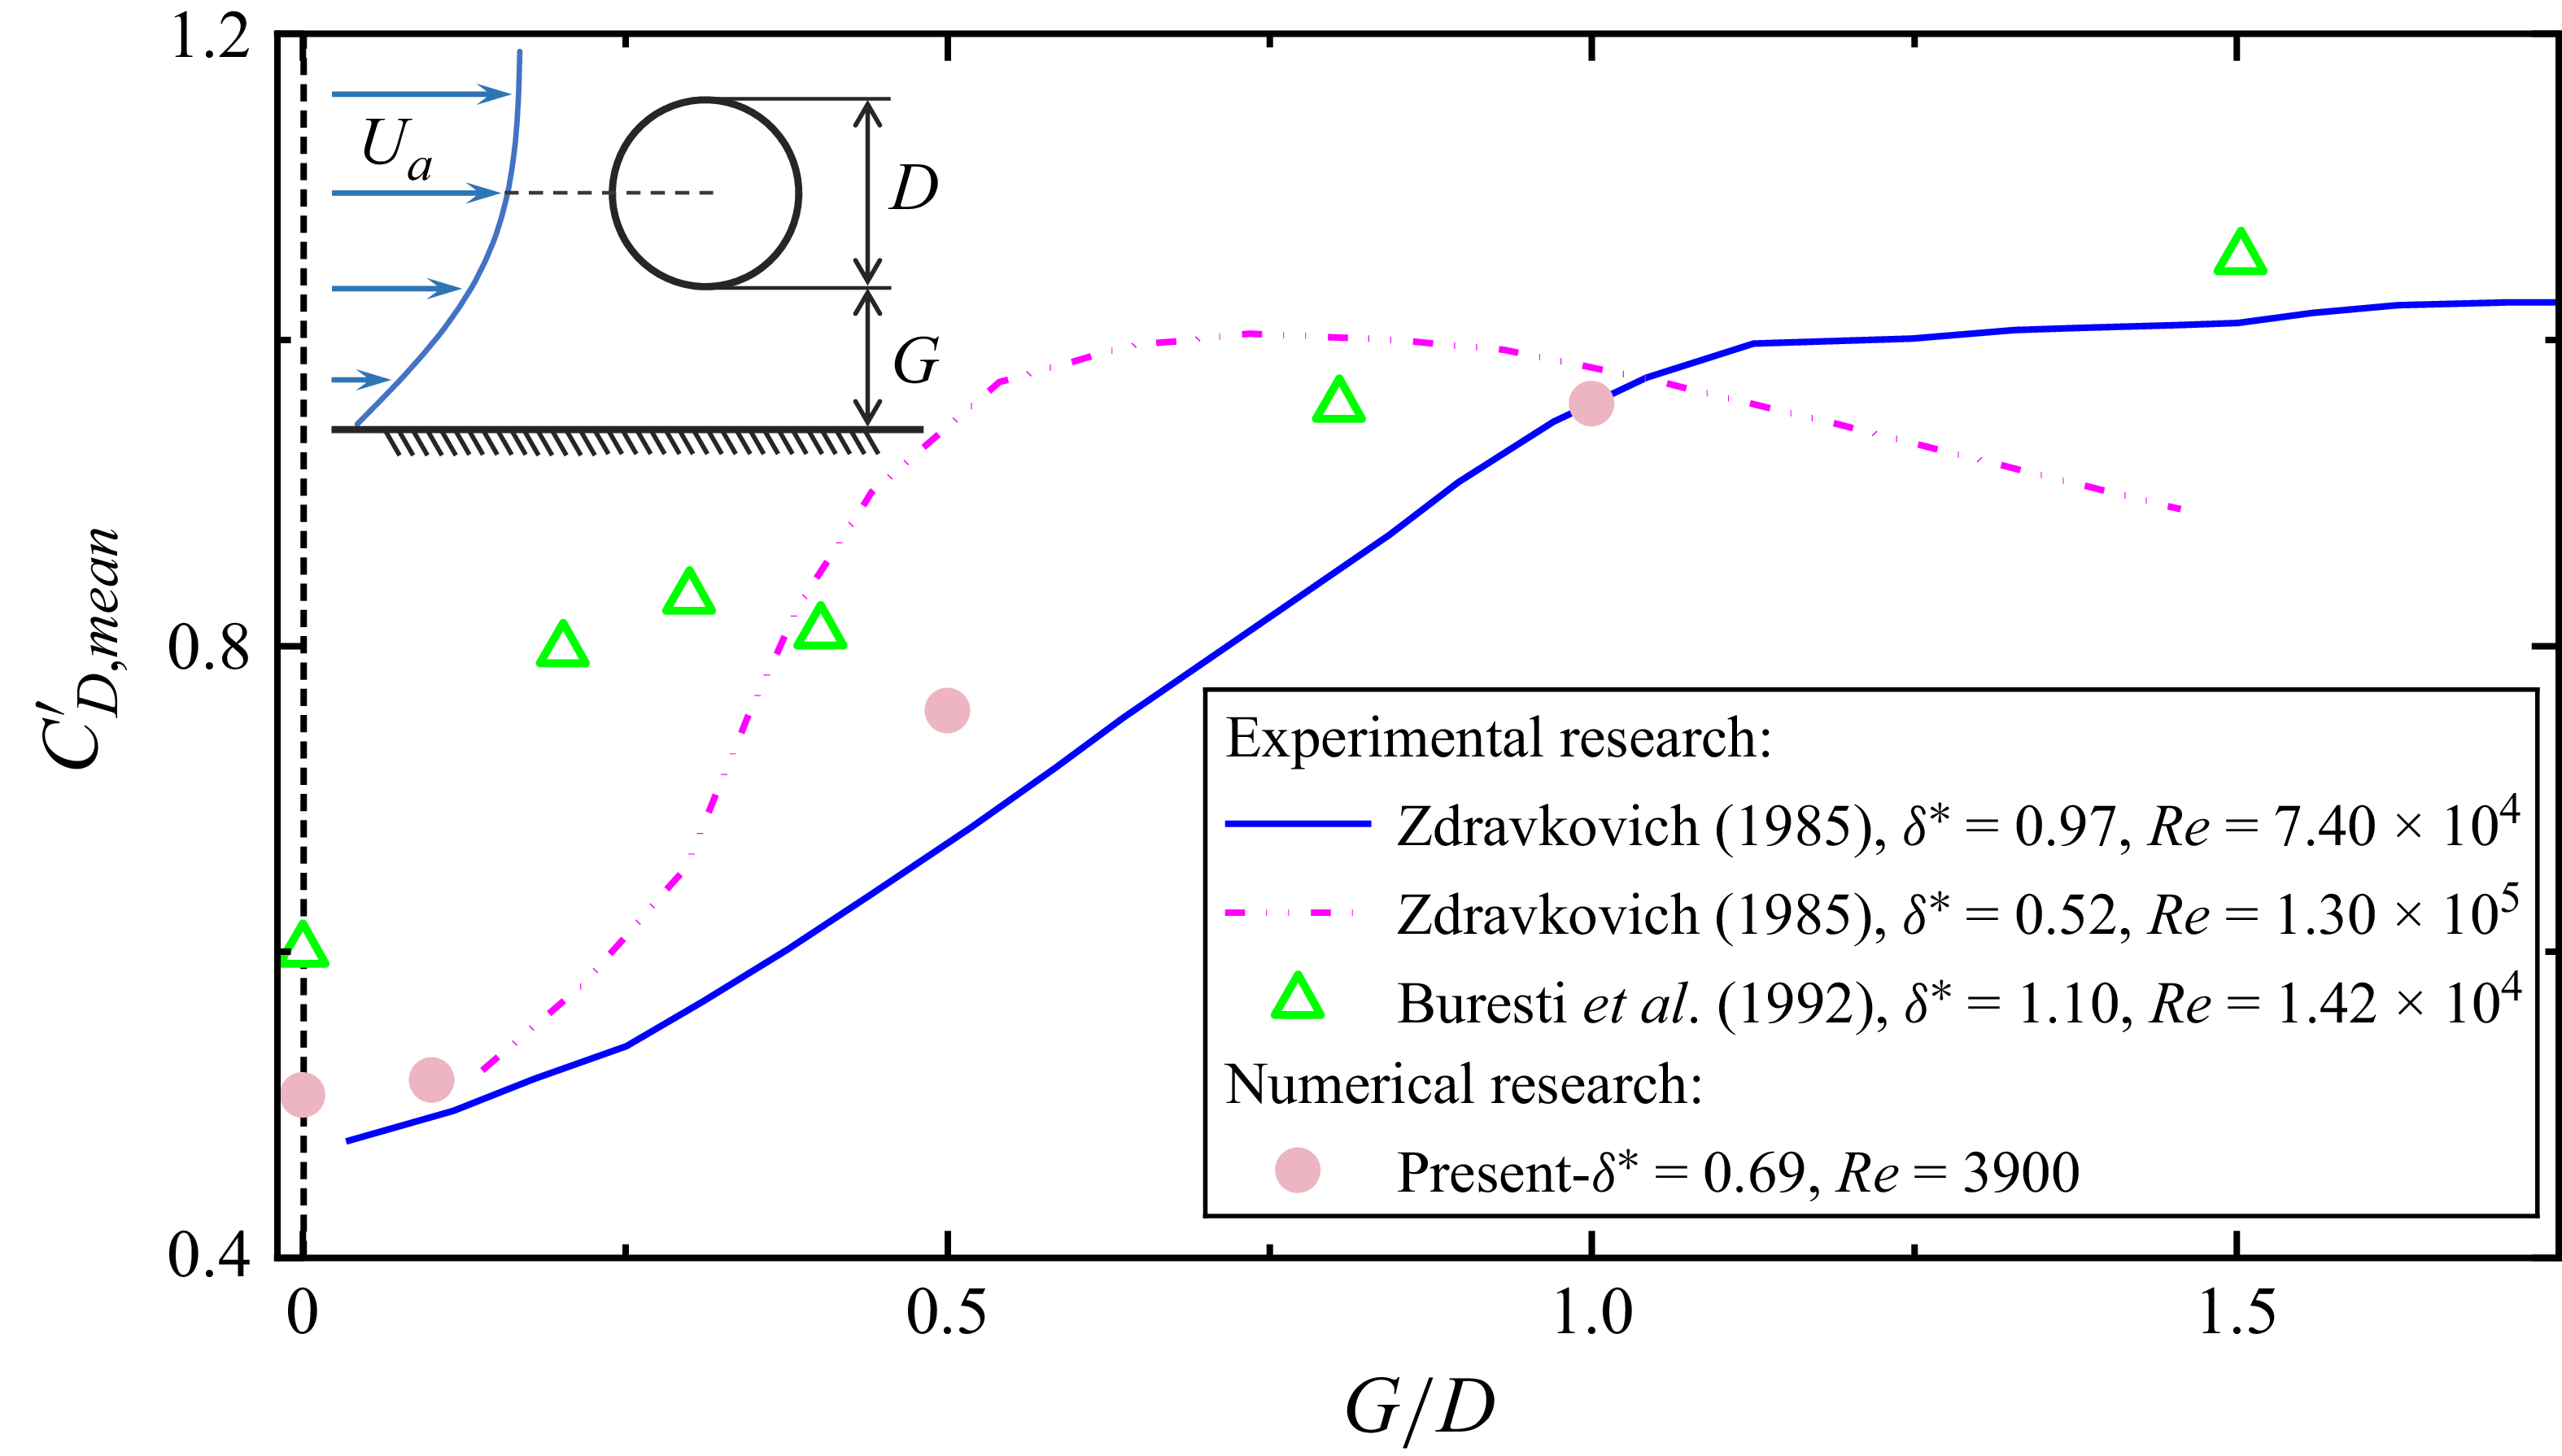
In figure 6, the present normalised
 ${C}_{D,mean}^{\prime}$
distributions, obtained at a boundary layer thickness of
 $\delta ^{*}$
= 0.69 and Re = 3900, are compared with findings from previous studies (Zdravkovich Reference Zdravkovich1985; Buresti & Lanciotti Reference Buresti and Lanciotti1992). To mitigate the influence of boundary layer thickness (
 $\delta ^{*}$
), the drag coefficients are normalised by the local velocity at the cylinder axis position (U
a
). Although the Reynolds numbers considered in these studies differ by more than an order of magnitude, such comparisons are appropriate for assessing qualitative trends in near-wall cylinder hydrodynamics. In the turbulent-wake regime, the dependence of
 ${C}_{D,mean}^{\prime}$
on the gap ratio
 $ G/D$
has been shown to be only weakly sensitive to the Reynolds number, consistent with the trends observed here. The present results fall within the range of the existing experimental data and show particularly good agreement with the measurements of Zdravkovich (Reference Zdravkovich1985) at
 $\delta ^{*}$
= 0.97, Re =
 $7.40\times 10^{4}$
. This consistency demonstrates the reliability of the present numerical model in capturing the hydrodynamic characteristics of near-wall flow around a circular cylinder.
Comparations of the mean drag force coefficient
 ${C}_{D,mean}^{\prime}$
over
 $ G/D$
relationship obtained from the present study with those from previous studies (Zdravkovich Reference Zdravkovich1985; Buresti & Lanciotti Reference Buresti and Lanciotti1992). Note that the
 ${C}_{D,mean}^{\prime}$
is normalised by the local velocity at the cylinder centre position U
a
.

3. Results
The numerical results from this study are reported and interpreted in this section. The section is organised in the following way. A phenomenon where both lift and drag forces on the cylinder in a trench exhibit periodic fluctuations is reported and discussed in § 3.1. The influences of various parameters are presented in § 3.2 and the physics behind observed variation trends of hydrodynamic forces with different parameters are interpreted in § 3.3.
3.1. Force characteristics and mechanisms
A noticeable feature revealed by this study is that a cylinder placed on the bottom of the trench experiences oscillatory forces with well-defined frequencies. A typical case of trench configurations (T30-20-1) is illustrated in figure 7, where both C D and C L undergo significant oscillations with much larger amplitudes than their counterparts of a cylinder on a flat seabed (T0-0-0), despite that the mean drag and lift coefficients are much smaller in the trenched case of T30-20-1. Specifically, the C D,rms values are 0.006 for T0-0-0 and 0.168 for T30-20-1; for C L,rms , the corresponding values are 0.007 and 0.066. At T30-20-1, the peak-to-peak amplitudes of C D and C L are 0.6 and 0.3, respectively, with a shared f of approximately 0.145, as highlighted in the frequency spectra shown in figure 7(c). A tilted irregular elliptical loop of the C D −C L phase diagram (figure 7 d) suggests a distinct phase difference between drag and lift. The above-mentioned features are somewhat unexpected because (i) oscillatory forces on a cylinder in steady currents are normally induced by shedding of vortices from the cylinder and (ii) vortex shedding from a cylinder placed on the bottom of trench is not anticipated, based on the understanding of fluid mechanics around a cylinder placed on a flat surface. It is widely recognised that when a cylinder is mounted on a flat seabed under steady flow, vortex shedding is suppressed due to the presence of the seabed (Sumer & Fredsøe Reference Sumer and Fredsøe2006), resulting in near-constant forces with minor fluctuations. Therefore, the pronounced oscillatory forces observed in the trenched configuration are unlikely to be caused by classical vortex shedding and warrant further investigation.
Time histories of (a) C D and (b) C L for a cylinder mounted on a flat seabed (T0-0-0, dashed lines) and inside a wide trench (T30-20-1, solid lines) at Re = 3900. (c) Frequency spectra of C D and C L for the cylinder inside T30-20-1 at Re = 3900, where A denotes spectral amplitude. (d) Phase diagram of C D versus C L for T30-20-1.

To elucidate the underlying physics, the flow dynamics in case T30-20-1 is analysed in detail. The distinctive force behaviours observed for the cylinder in the wide and shallow trench configuration are closely linked to the complex flow features induced by the trench geometry. The trench simultaneously introduces both shielding and destabilising effects, which collectively govern the hydrodynamic forces acting on the cylinder.
On one hand, the trench acts as an effective shield, isolating the centrally located cylinder from direct exposure to the incoming outer flow. This sheltering mechanism markedly reduces the local flow velocity surrounding the cylinder, promoting a more uniform pressure distribution across its surface, as illustrated by the blue line in figure 8. This leads to a substantial reduction in the mean drag and lift forces, compared with the configuration without such geometric protection (T0-0-0, red line in figure 8).
Time- and spanwise-averaged pressure coefficient
 $C_{p}$
around the cylinder surface for a cylinder mounted on a flat seabed (T0-0-0) and inside a wide trench (T30-20-1) at Re = 3900.

On the other hand, the trench also generates pronounced force fluctuations. Unlike the flat seabed scenario (T0-0-0), where the incoming boundary layer transitions smoothly before interacting with the cylinder (figure 10 a), the trench geometry, particularly its inclined leading edge, creates a sharp geometric discontinuity. As a result, a strong velocity gradient forms between the high-speed outer flow above the trench and the slower, recirculating flow trapped within it: a configuration that may be highly susceptible to Kelvin–Helmholtz (K–H) instability (Matsuoka Reference Matsuoka2014), which typically arises in regions of intense shear between two streams of differing velocities.
To assess the presence of K–H instability, the normalised velocity profiles at four upstream locations, namely
 $ x/D$
= −10, −9, −8 and −5, are compared with the hyperbolic tangent curve, as shown in figure 9. Notably, all measured profiles collapse into the canonical hyperbolic tangent curve, which is widely regarded as a hallmark of turbulent mixing layers. This form is commonly used in linear stability analyses of K–H instability (e.g. Harang et al. Reference Harang, Thual, Brancher and Bonometti2014; He et al. Reference He, Ghisalberti, An, Draper, Branson, Ren and Cheng2024) and is defined as
 \begin{align}\frac{\left(u-U_{mean}\right)}{{\unicode{x0394}} U}=\frac{1}{2}\tanh\frac{y-y_{0}}{2\delta _{m}},\end{align}
where u is the streamwise velocity at transverse location y,
 $U_{mean}$
and
 ${\unicode{x0394}} U$
are the arithmetic mean and velocity difference between the high-speed flow above and the low-speed recirculating flow within the trench,
 $y_{0}$
indicates the location where u =
 $U_{mean}$
, and
 $\delta _{m}$
represents the momentum thickness of the shear layer. This thickness quantifies the integral contribution of the velocity deficit and is defined as
 \begin{align}\delta _{m}={\int }_{-\infty }^{\infty }\left[\frac{1}{4}-\left(\frac{u-U_{mean}}{{\unicode{x0394}} U}\right)^{2}\,{\rm d}y\right].\end{align}
Comparison of normalised velocity profiles with hyperbolic tangent function in T30-20-1 at Re = 3900.

Contour of instantaneous spanwise vorticity
 $\omega _{z}$
in (a) T0-0-0 and (c) T30-20-1, and iso-surface of
 $\lambda _{2}=-2$
coloured by the corresponding instantaneous streamwise vorticity
 $\omega _{x}$
in (b) T0-0-0 and (d) T30-20-1 at Re = 3900.

As shown in figure 9, the collapse of the present velocity profiles across multiple upstream locations (represented by different symbols) in T30-20-1 onto the theoretical hyperbolic tangent curve (solid line) strongly suggests that the shear layer maintains a self-similar form and evolves in a manner consistent with classical mixing layers. Such agreement substantiates the hypothesis that the incoming shear layer in the trench behaves analogously to the early developmental stages of the K–H instability.
In T30-20-1, the inclined leading edge plays a pivotal role by triggering the roll-up of the incoming shear layer upstream of the cylinder. This process promotes the formation and amplification of K–H vortices. Figure 10(c) shows a clear intensification of spanwise vorticity
 $\omega _{z}$
beginning around
 $ x/D$
= −5, highlighting the onset of shear-layer instability. Further downstream, more complex 3-D vortex structures begin to develop. These flow structures are visualised in figure 10(d) using iso-surfaces of the second largest eigenvalue λ2
= –2 of the tensor
 ${S^{2}}+\varOmega ^{2}$
, where
 $ S $
and
 $\varOmega$
denote the symmetric strain-rate and anti-symmetric rotation-rate tensors, respectively (Jeong & Hussain Reference Jeong and Hussain1995). Under the λ2
-criterion, regions with λ2
< 0 indicate coherent vortical structures associated with local pressure minima; the specific threshold λ2
= –2 is adopted here purely for visualisation purposes, enabling a consistent identification of shear-layer roll-up and vortical structures induced by K–H instability in both the T0-0-0 and T30-20-1 cases. Such evolution is consistent with the classical picture of K–H instability, in which initially organised two-dimensional structures undergo a transition to three-dimensional vortical motions and enhanced mixing (Fritts et al. Reference Fritts, Lund, Lund and Wang2023).
Collectively, these 3-D turbulent structures induced by the trench configuration generate a highly unsteady flow environment around the cylinder, resulting in significant temporal fluctuations in both drag and lift forces. This behaviour is quantitatively confirmed through spectral analysis of the flow field variables. As shown in figure 11(a–c), the frequency spectra of the streamwise velocity (u), cross-flow velocity (v) and pressure (p) reveal a dominant peak at approximately f = 0.144 across multiple streamwise locations at (x, y, z) = (−5.0, 0.75, 1.5), (−4.0, 0.75, 1.5) and (−3.0, 0.75, 1.5). Notably, the dominant frequency observed in the flow variables matches closely with the peak frequency identified in the hydrodynamic force spectra (f = 0.145), as illustrated in figure 7(c), indicating a strong coupling between the unsteady wake structures and the hydrodynamic forces acting on the cylinder.
Frequency spectra of flow variables at selected streamwise locations: (a) streamwise velocity u, (b) cross-flow velocity v and (c) pressure p at (x, y, z) = (−5, 0.75, 1.5), (−4, 0.75, 1.5) and (−3, 0.75, 1.5) for the cylinder inside T30-20-1 at Re = 3900.

The persistence of a consistent dominant frequency across different probe locations provides a strong piece of evidence for the presence of a globally synchronised instability mode, rather than a purely convective one. In addition, the moderately narrowband nature of the spectral peaks indicates that the unsteady motions are governed by organised, coherent structures, rather than by broadband turbulent fluctuations. The characteristic frequency observed in the present study (f = 0.144) is consistent with theoretical expectations for K–H instability. Previous investigations (e.g. Ho & Huerre Reference Ho and Huerre1984; Dimotakis Reference Dimotakis1986) have demonstrated that, for typical free shear layers, the most amplified instability frequencies lie within the range of 0.1–0.2. The close agreement between the observed and theoretical frequencies provides further confirmation that the unsteady hydrodynamic force fluctuations and coherent vortex structures around the cylinder are primarily governed by a shear-layer-driven K–H instability mechanism.
3.2. Influence of trench geometries and flow conditions
Building on the coherent flow structures as discussed previously, this section illustrates how trench geometries and flow conditions influence the hydrodynamic forces on the cylinder. These influences are discussed in four groups, which are (i) trench width and depth ratios (
 $ W^{*}$
and
 $ H^{*}$
), (ii) trench side slope (
 $\theta$
), (iii) the streamwise offset of the cylinder centre from the trench centreline (
 ${L}_{p}^{*}$
) and (iv) flow Reynolds number (Re).
3.2.1. Influence of trench width and depth
Trench width (
 $ W^{*}$
) and depth (
 $ H^{*}$
) ratios are found to both individually and jointly affect the hydrodynamic forces on the cylinder. To show the influence of
 $ W^{*}$
and
 $ H^{*}$
, θ,
 ${L}_{\!P}^{*}$
and Re are held constant to ensure that the observed variations in hydrodynamic forces arise solely from changes in trench dimensions. The specific configurations follow strategy (i) in § 2.2.
Figure 12 presents the reduction factors of the mean drag and lift coefficients, as well as the r.m.s. values as functions of
 $ W^{*}$
and
 $ H^{*}$
at θ = 30
 $^{\circ}$
. Overall, all cases exhibit some degree of mean force attenuation due to the presence of the trench, as shown in figures 12(a) and 12(b), where the reduction factors remain below 1.0, indicating that the hydrodynamic forces are reduced relative to those experienced by a cylinder on a flat seabed.
Reduction factors of (a) C
D,mean
and (b) C
L,mean
, and r.m.s. values of (c) C
D
and (d) C
L
for the cylinder in trenches with varying
 $ W^{*}$
and
 $ H^{*}$
at θ = 30
 $^{\circ}$
.

As shown in figure 12, for narrow trenches (
 $ W^{*}$
 $\leq$
6; grey-shaded region), the cylinder remains well sheltered across all tested trench depths (
 $ H^{*}$
= 1–5). Under those conditions, the drag and lift reduction factors remain small in magnitude (
 $| R_{D}|$
,
 $| R_{L}|$
< 0.1), and the corresponding C
D,rms
and C
L,rms
are consistently below 0.01, indicating that the cylinder is well sheltered in these trench configurations. This conclusion is further supported by the time histories of force coefficients for representative cases T30-1-2 (the narrowest and shallowest in this region) and T30-6-5 (the widest and deepest in this region), as shown in figure 13. Both C
D
and C
L
time histories exhibit only small-amplitude fluctuations (
 $ \lt 0.05$
) and no discernible dominant frequency. Although the C
L
signal shows slightly greater variability than C
D
, its amplitude remains comparable to that of a cylinder placed on a flat seabed, typically around 0.06 (as the dashed lines shown in figures 7
a and 7
b).
Time histories of (a) C
D
and (b) C
L
for typical trench configurations T30-1-2 and T30-6-5, corresponding to narrow trenches with
 $ W^{*}$
= 1 and 6, respectively, at θ = 30
 $^{\circ}$
. Corresponding frequency spectra for (c) T30-1-2 and (d) T30-6-5, respectively.

As
 $ W^{*}$
increases, shown in figure 12, the hydrodynamic force response of the cylinder exhibits distinct trends that depend strongly on the trench depth H
*
.
-
(1) For the shallowest trench depth (
$ H^{*}$
= 1), both R
D
and R
L
begin to increase steadily beyond
$ W^{*}$
= 10, reflecting a gradual reduction of the trench’s sheltering effect with increasing
$ W^{*}$
. Simultaneously, C
D,rms
rises sharply, increasing from zero at
$ W^{*}$
= 6 to approximately 0.16 at
$ W^{*}$
= 15, beyond which it levels off. The value of C
L,rms
also increases gradually, reaching approximately 0.06 at
$ W^{*}$
= 20. These trends point to the onset of increasingly oscillatory flow around the cylinder. To illustrate this behaviour in detail, the spectral response of a representative configuration at an intermediate trench width, case T30-15-1, is examined. As shown in figure 14(ai), both lift and drag frequencies exhibit pronounced peak at f = 0.137, confirming the emergence of coherent flow structures (see figure 14
aii). While T30-15-1 is presented as a typical example, similar trends are observed across adjacent widths (e.g. T30-10-1 and T30-20-1), reinforcing the generality of this behaviour. -
(2) For
$ H^{*}$
= 2, the force response exhibits increased variability and nonlinearity. The value of R
D
initially increases in magnitude, reaching a peak negative value near
$ W^{*}$
= 15, suggesting a reversal of net streamwise force acting on the cylinder. Beyond this point, the value of R
D
recovers to a positive value of approximately 0.08 at
$ W^{*}$
= 20. Concurrently, the value of R
L
follows a similarly complex trend: it rises to 0.24 at
$ W^{*}$
= 10, dips to 0.11 at
$ W^{*}$
= 15 and then rebounds to 0.23 at
$ W^{*}$
= 20. These variations reflect sensitive interactions between the evolving shear layer and trench geometry, which appear to modulate the lift production mechanisms non-monotonically.Figure 14.Frequency spectra of C D (black lines) and C L (red lines) (ai-di) for T30-15-1, T30-10-2, T30-20-3 and T30-15-4 cases. Prominent spectral peaks are marked by blue dashed lines (dominant frequencies) and green dashed lines (subdominant frequencies), highlighting key unsteady flow features associated with each configuration. (aii–dii) Instantaneous spanwise vorticity
$\omega _{z}$
contours for typical cases T30-15-1, T30-10-2, T30-20-3 and T30-15-4.The unsteady components of the force, quantified by C D,rms and C L,rms , also show significant growth as W* > 6. The value of C D,rms rises monotonically from 0.02 to 0.22 as
$ W^{*}$
increases from 6 to 20. The variation of C
L,rms
with
$ W^{*}$
generally algins with the variation trend of R
L
, where the value of C
L,rms
increases sharply to approximately 0.09 at
$ W^{*}$
= 10, followed by a slight decline at
$ W^{*}$
= 15 and a plateau near
$ W^{*}$
= 20. The enhanced lift fluctuations at T30-10-2 are likely driven by the distinct flow behaviour. Spectral analysis of this case (figure 14
bi) reveals two distinct peaks in the frequency spectra at f ≈ 0.058 and f ≈ 0.113. While the lower-frequency peak is associated with larger-scale trench-induced recirculation (represented by the small-scale vortices between the cylinder and trench’s trailing edge in figure 14
bii), the higher-frequency peak is associated with the presence of direct vortex shedding from the shear-layer (see the shed vortex above the cylinder in figure 14
bii). Notably, the higher-frequency peak at f ≈ 0.113 also aligns with typical values of K–H shear layer instabilities. Due to the interaction of large-scale unsteadiness and localised forcing of unsteady flow associated with respective low and high frequencies, the force coefficients experience significant elevation and fluctuating in this case. -
(3) For
$ H^{*}$
= 3, both R
D
and R
L
remain close to zero for
$ W^{*}$
$\leq$
10. As
$ W^{*}$
increases beyond 10, the absolute values of both quantities increase: R
D
in the upstream direction and R
L
in the upward direction, implying a progressive erosion of the trench’s shielding effect and enhanced interaction between the outer shear layer and the cylinder. This trend is accompanied by a marked increase in C
D,rms
and C
L,rms
, indicating the development of significant unsteady forcing. These observations are consistent with the broadband spectral content seen in case T30-20-3 (figure 14
ci), where the absence of a distinct frequency peak suggests a disordered wake dominated by multi-scale vortex interactions shown in figure 14(cii). The lack of spectral coherence points to irregular pressure fluctuations on the cylinder surface, which in turn amplify the unsteady hydrodynamic forces. -
(4) For the deeper trench cases,
$ H^{*}$
= 4 and
$ H^{*}$
= 5, the hydrodynamic force response indicates a sustained and effective sheltering effect across the entire range of trench widths tested. Both R
D
and R
L
increase only gradually with
$ W^{*}$
, and their magnitudes remain low, reflecting limited mean force amplification and suggesting that the cylinder is largely insulated from energetic outer flow interactions. The values of C
D,rms
and C
L,rms
also exhibit only modest growth, indicating that unsteady loading remains relatively weak in these deeper geometries.This behaviour is consistent with the characteristics frequency spectral of lift and drag coefficients shown in figure 14(di), where the force spectra display broad frequency contents and the absence of sharp spectral peaks. The absence of distinct spectral features indicates a lack of dominant oscillatory modes typically associated with coherent flow structures. Instead, the broadband signature suggests that the unsteady loading on the cylinder is driven by weak, non-periodic disturbances (represented by the disordered vortices in figure 14 dii) rather than organised flow structures.


These findings underscore that trench depth alone, which is commonly used in industry standards such as DNV-RP-F109 (Det Norke Veritas 2021), is insufficient as a design parameter for taking into account of the influence of flow shielding. Instead, a combined assessment of both trench width and depth is required, as their interaction fundamentally governs the unsteady loading experienced by the cylinder and, by extension, the overall hydrodynamic stability of the system.
3.2.2. Influence of trench side slope
Previous studies (e.g. Jo et al. Reference Jo, Lee, Shin, Hong and Min2002; Sumer & Fredsøe Reference Sumer and Fredsøe2006) have demonstrated that, in relatively narrow trenches (
 $ W^{*}$
 $\leq$
5), increasing trench side slope generally leads to an increase in flow shielding effectiveness. However, the influence of the side slope in wide trench configurations remains poorly understood. This section addresses this knowledge gap by investigating the hydrodynamic force response for a cylinder embedded in wide trenches (
 $ W^{*}$
= 20) with varying trench side slopes
 $\theta$
. Two representative trench depths, namely a shallow trench at
 $ H^{*}$
= 1 and a deep trench at
 $ H^{*}$
= 5 are investigated. The specific configurations follow strategy (ii) in § 2.2.
Figure 15 presents the reduction factors of the mean drag and lift coefficients, along with the r.m.s. values of these coefficients, across four
 $\theta$
values. Across all configurations, R
D
and R
L
remain below 1.0, confirming that even without side slope optimisation, wide trenches provide some degree of hydrodynamic shielding relative to the flat seabed reference case.
(a) Drag reduction factors, (b) lift reduction factors, (c) r.m.s. drag coefficients and (d) r.m.s. lift coefficients for the cylinder in trenches with different θ for
 $ H^{*}$
= 0, 1 and 5 at
 $ W^{*}$
= 20.

In the shallow trench cases (
 $ H^{*}$
= 1), R
D
and R
L
show minimal sensitivity to
 $\theta$
, remaining nearly constant across the side slope range (both around 0.5). The r.m.s. values exhibit a slight increase between
 $\theta$
= 30
 $^{\circ}$
and 45
 $^{\circ}$
, after which C
D,rms
and C
L,rms
remain approximately constant at 0.2 and 0.08, respectively, suggesting sustained energetic fluctuations. This behaviour is consistent with the strong and persistent spectral peaks observed in the frequency spectra (figure 16
ai–aiv), indicating that coherent flow structure remains active regardless of side slope variation, as also evidenced by the similar flow structures shown in figures 16(ci) and 16(cii) for cases T15-20-1 and T60-20-1. This limited variation implies trench side slope has only a marginal effect on suppressing unsteady forces in shallow configurations. Supporting this argument, the time- and spanwise-averaged pressure distributions in figure 17(a) show near-identical surface pressure profiles across all side slopes, indicating minimal modification of the near-wall pressure field.
Frequency spectra of C
D
(black lines) and C
L
(red lines) for the (ai–aiv) T*-20-1 and (bi–biv) T*-20-5 cases with
 $\theta$
= 15°–60°. Prominent spectral peaks are indicated by blue dashed lines, corresponding to dominant frequencies in the force signals. (ci–civ) Instantaneous spanwise vorticity
 $\omega _{z}$
contours for typical cases T15-20-1, T60-20-1, T15-20-5 and T60-20-5.

Time- and spanwise-averaged pressure coefficients
 $C_{p}$
around the cylinder surface for cases with varying trench side slopes θ, at (a)
 $ H^{*}$
=1and (b)
 $ H^{*}$
=5.

In contrast, the deeper trench cases (
 $ H^{*}$
= 5) reveal a pronounced side slope dependence. As
 $\theta$
increases from 15
 $^{\circ}$
to 60
 $^{\circ}$
, the absolute value of R
D
drops from 0.34 to near zero. A similar trend is observed in R
L
. The r.m.s. values also decline markedly: C
D,rms
falls from 0.08 at
 $\theta =15^{\circ}$
to a value of 0.025 at
 $\theta =$
60
 $^{\circ}$
, while C
L,rms
drops sharply from approximately 0.09 to 0.02 as
 $\theta$
increases from
 $15^{\circ}$
to
 $60^{\circ}$
, indicating a substantial suppression of unsteady flow. Correspondingly, the frequency spectra in figure 16(bi–biv) reveal diminished peak sharpness and increasingly broadband energy distribution across all side slope angles. While the dominant f values exhibit some variation (e.g. f ranging from approximately 0.005 to 0.068), the consistent attenuation of spectral peaks suggests that increasing side slope tends to weaken the formation of coherent flow structures around the cylinder and promote more disordered force oscillations. These results suggest that in deep trenches, steeper side slopes enhance the sheltering of the trench and suppress hydrodynamic fluctuations on the cylinder. The pressure distributions in figure 17(b) reinforces the previous interpretation. At
 $\theta$
= 15
 $^{\circ}$
, the pressure profile around the cylinder exhibits a large asymmetry, with a pronounced difference between upstream and downstream surfaces, reflecting limited sheltering. As
 $\theta$
increases, the profiles become more symmetric and the pressure differential diminishes, indicating improved shielding and wake stabilisation.
Taken together, these observations demonstrate that trench side slope θ becomes an increasingly important control parameter as trench depth increases, with steeper side slopes in deep trenches yielding superior hydrodynamic shielding through reductions in both mean and fluctuating force components, as well as diminished spectral coherence in the flow-induced forces.
3.2.3. Influence of cylinder placement position
The impact of cylinder placement position inside the trench on hydrodynamic forces is demonstrated by the T30-20-1 configuration, as defined in strategy (iii) of § 2.2. The variations of drag and lift coefficients with the streamwise offset of the cylinder centre from the trench centreline
 ${L}_{p}^{*}$
are shown in figure 18, while corresponding spectral responses and Strouhal numbers are presented in figure 19.
(a) Drag reduction factors, (b) lift reduction factors, (c) r.m.s. drag coefficients and (d) r.m.s. lift coefficients for the cylinder with different streamwise offsets
 ${L}_{p}^{*}$
in T30-20-1 at Re = 3900. (e–h) Instantaneous spanwise vorticity
 $\omega _{z}$
contours for typical cases in different ranges. The shaded regions labelled (A–D) represent distinct regions identified based on differences in the trends of the hydrodynamic forces.

(ai–axiii) Frequency spectraof C
D
(black lines) and C
L
(red lines) for the T30-20-1 case at various cylinder streamwise offsets
 ${L}_{p}^{*}$
. Prominent spectral peaks are highlighted with blue dashed lines. (b) Dominant frequencies derived from C
D
and C
L
signals as a function of
 ${L}_{p}^{*}$
.

When the cylinder is positioned upstream within the trench (
 ${L}_{p}^{*} \leq$
−7, grey regions (A) in figure 18), both C
D,rms
and C
L,rms
fall below 0.01, indicating negligible unsteady forcing. The corresponding drag and lift reduction factors (R
D
and R
L
) also remain well below 0.1, confirming that the cylinder resides in a region of effective flow shielding, largely isolated from external disturbances, as illustrated in figure 18(e). The force signals exhibit only minor fluctuations, and although not shown here, the corresponding frequency spectra are broadband with no dominant peaks, which is consistent with a nearly steady flow regime.
As the cylinder moves downstream to
 ${L}_{p}^{*}$
= −6.5 (orange-shaded regions (B) in figure 18), both C
D,rms
and C
L,rms
exhibit a modest increase, while R
D
and R
L
remain relatively low. This behaviour suggests the partial exposure to the outer shear layer and marks a transitional region where flow instabilities start to influence the near-cylinder dynamics, as illustrated in figure 18(f). This is further supported by the emergence of dominant spectral peaks in both C
D
and C
L
in figure 19(ai).
Between
 ${L}_{p}^{*}$
= −6.5 and
 ${L}_{p}^{*}$
= 2 (white-shaded regions (C) in figure 18), the unsteady response intensifies markedly. Both C
D,rms
and C
L,rms
rise considerably compared with the upstream cases, accompanied by increasing mean force reduction factors. Although R
D
and R
L
remain below 1.0, the trench’s capacity to dampen unsteadiness weakens considerably. Spectral analysis (figure 19
aii–aviii) reveals the emergence of strong, narrowband peaks, indicative of the presence of coherent flow structures (see figure 18
g). The associated dominant frequencies become well-defined and remain relatively consistent across this range, as shown in figure 19(b), confirming the establishment of organised flow structures.
At further downstream positions (
 ${L}_{p}^{*} \geq$
2, the pink-shaded regions (D) in figure 18), the flow becomes highly unsteady. Here, R
D
and/or R
L
exceed 1.0, signifying that the mean forces acting on the cylinder surpass those observed in the flat seabed case. The r.m.s. coefficients also remain elevated, reflecting strong and persistent vortex-induced fluctuations. Notably, although the dominant frequencies remain confined within a narrow range (figure 19
aix–axii), the amplitudes of the spectral peaks progressively diminish. This trend suggests a gradual dispersion of energy across the frequency spectrum, likely due to increasingly complex interactions between the wake and the downstream trench geometry, as shown in figure 18(h).
Collectively, these observations delineate a spatial progression from strong trench-induced sheltering to increasingly vigorous wake instability as the cylinder moves laterally downstream within the trench. It is also reasonable to infer that, as the trench widens further, the shear layer gains more space to develop and intensify before touching the cylinder. As a result, the mean drag and lift forces acting on a centrally positioned cylinder may not only increase, but even surpass those experienced over a flat seabed, leading to R D and R L values exceeding 1.0. This highlights the possibility of force amplification in geometries traditionally assumed to be protective.
3.2.4. Influence of Reynolds number
This section investigates the influence of Reynolds number (Re, ranging from 500 to 3900) on the hydrodynamic forces acting on a cylinder placed within both shallow and deep trench configurations. The specific configurations follow strategy (iv) in § 2.2. Four representative cases are examined: T30-6-1 and T30-20-1 for shallow trenches, and T30-20-3 and T30-20-5 for deep trenches.
To establish a baseline for comparison, the hydrodynamic forces of an isolated cylinder and a cylinder placed on a flat seabed are first evaluated across the range of tested Re. As shown in figure 20, the presence of the seabed significantly alters the hydrodynamic force characteristics on the cylinder compared with the isolated case. Specifically, the value of C D,mean for the cylinder on a flat seabed is consistently lower than that of the isolated cylinder (figure 20 a), highlighting the influence of near-wall momentum reduction and flow confinement effects. In contrast, the value of C L,mean (figure 20 b) becomes distinctly non-zero across all Re, diverging from the near-zero values typically observed for a symmetrically exposed, isolated cylinder in steady flow. The value of C D,rms and C L,rms (figures 20 c and 20 d) are also markedly reduced for the flat seabed case, indicating weaker unsteady fluctuations and a more stable force response in the absence of trench-induced disturbances. Additionally, for the flat seabed case, both mean force coefficients exhibit an increase with Reynolds number, tending to plateau between 3000 and 3900.
(a) Mean drag coefficients, (b) mean lift coefficients, (c) r.m.s. drag coefficients and (d) r.m.s. lift coefficients for an isolated cylinder and a cylinder on a flat seabed as functions of Re.

The reduction factors of the mean drag and lift coefficients for the trench cases, shown in figure 21, are referenced to the corresponding flat seabed values discussed previously and are presented alongside the r.m.s. force coefficients as functions of Re. This comparison provides a direct assessment of how trench-induced modifications to the flow develop with increasing Re.
(a) Drag reduction factors and (b) lift reduction factors based on the mean drag and lift coefficients, and (c) r.m.s. drag and (d) lift coefficients for the cylinder in various trench configurations at different Re.

Dominant frequency f estimated from the frequency spectra of the (a) drag and (b) lift coefficient signals for cases T30-20-1, T30-20-3 and T30-20-5.

For the narrow and shallow trench T30-6-1 (red squares in figure 21), the cylinder remains effectively sheltered across the entire Re range. Both the drag and lift reduction factors remain near zero, and the associated r.m.s. values are negligible, indicating that flow unsteadiness is minimal. These results suggest that the outer shear layer barely interacts with the cylinder, maintaining a stable and steady near-cylinder flow throughout the investigated Reynolds number range.
In the case of the wider, shallow trench T30-20-1 (blue circles), the hydrodynamic response exhibits clear Re dependence. At low Reynolds numbers (Re = 500 and 1000), the force response remains weak, with small reduction factors and r.m.s. values. The negative lift reduction factor at these conditions implies a stabilising lift suppression effect. However, as Re increases beyond 2000, the force response intensifies: R D and R L both increase, and the r.m.s. coefficients exhibit a non-monotonic trend: both C D,rms and C L,rms peak around Re = 3000 before slightly declining. These transitions correspond to increasingly organised wake dynamics, which are reflected in the evolution of the dominant frequencies shown in figure 22. For T30-20-1, the dominant frequencies derived from both drag and lift signals rise systematically with Re, indicating progressively stronger and more coherent flow structures. This shift aligns with the observed increase in the mean and rms force coefficients, confirming the role of Re in energising the trench-confined wake.
For the intermediate-depth trench configuration T30-20-3 (green triangles), the cylinder experiences weak forcing at Re = 500 and 1000, with both the mean and r.m.s. force coefficients remaining low, indicative of a predominantly steady flow regime. As the Reynolds number increases to 2000 and above, both metrics rise noticeably, reflecting the emergence of unsteady flow features. This transition is corroborated by the frequency response: at Re = 2000, a distinct dominant frequency appears, as reflected in the corresponding dominant frequency in figure 22. At higher Reynolds numbers (Re = 3000 and 3900), the dominant frequency becomes relatively stable, indicating the establishment of coherent, periodic flow fields. While both the mean and r.m.s. lift coefficients increase with Reynolds number up to Re = 3000, a slight decline is observed at Re = 3900. This trend suggests a possible moderation in force amplitudes, potentially due to saturation of unsteady forcing or changes in the wake–trench interaction dynamics, even as organised flow structures remain present.
In the deepest trench configuration, T30-20-5 (purple diamonds), the cylinder remains effectively shielded from the external flow at low Reynolds numbers (Re
 $\leq$
1000), with mean force coefficients remaining negligible (R
D
and R
L
are near zero). As Re increases, the r.m.s. force components begin to rise gradually, indicating a progressive erosion of the trench’s protective effect. Despite this increase in unsteady loading, the associated dominant frequencies remain consistently low (below 0.05) and largely invariant with Re, suggesting the absence of strongly periodic vortex shedding around the cylinder. This spectral response indicates that, while inertial effects enhance unsteadiness, the flow around the cylinder retains a predominantly broadband and disorganised character. Thus, deep trenches are shown to effectively suppress coherent vortex dynamics around the cylinder across the entire range of Reynolds numbers tested.
The effect of Reynolds number (Re) on hydrodynamic forces reveals that increasing Re intensifies unsteady flow interactions within trench-confined configurations. At low Re, the cylinder experiences minimal forcing due to effective flow shielding, especially in deeper or narrower trenches. As Re increases beyond∼2000, wider and intermediate-depth trenches exhibit stronger mean and fluctuating forces, accompanied by the emergence and stabilisation of organised flow structures around the cylinder. However, in deep trenches, even at high Re, coherent flow structures remain detached from the cylinder and the surrounding flow retains a disorganised, broadband character.
3.3. Physical mechanisms
The preceding section has documented the hydrodynamic responses of a cylinder inside a trench, highlighting the influences of trench geometry (
 $ W^{*}$
,
 $ H^{*}$
and
 $\theta$
), cylinder streamwise offset (
 ${L}_{p}^{*}$
) and flow Reynolds number (Re) on force magnitudes and spectral characteristics. In this section, these trends were interpreted by examining the underlying physical mechanisms that drive the observed force behaviours. Particular attention is given to the interplay between the external shear layer, trench-induced recirculation zones and local vortex dynamics near the cylinder. Through analysis of instantaneous and time-averaged flow fields, we aim to clarify how different flow regimes, ranging from fully sheltered to highly unsteady, emerge as a consequence of trench–wake–cylinder interactions.
Trench geometry, which is defined by the combined effects of width, depth and side slope, plays a dominant role in shaping flow behaviour and modulating the hydrodynamic loading on a cylinder within it. Rather than acting independently, these geometric parameters interact synergistically to regulate the accessibility of the outer shear layer, the structure and persistence of trench-confined recirculation zones, and the onset or suppression of organised flow structures.
3.3.1. Complete shielding of wake dynamics
As illustrated in § 3.2, narrow, deep and steep-sided trench configurations are effective at shielding the cylinder from energetic outer flows. In narrow trench cases, two distinct mechanisms of trench–wake–cylinder interaction emerge, depending on trench depth.
In the shallow trench case T30-1-2 (figure 23 a), the λ2 = –0.1 iso-surface reveals only weak, localised structures confined near the trench’s trailing edge, with no indication of coherent vortex roll-up or wake formation near the cylinder. This configuration is representative of an open cavity flow regime in figure 2(a), where the shear layer spans the trench opening without obvious reattachment and the internal flow remains largely undisturbed. As a result, the trench interior remains isolated from energetic outer-layer dynamics, consistent with the steady forces and broadband spectral features reported in § 3.2.
Instantaneous flow structures in narrow trench configurations at Re = 3900. (a) Iso-surface of
 $\lambda _{2}=-0.1$
from case T30-1-2 coloured by corresponding streamwise vorticity
 $\omega _{x}$
. (bi–bv) Sequential snapshots of the iso-surface
 $\lambda _{2}=-1$
from case T30-6-5, also coloured by
 $\omega _{x}$
, with dashed boxes highlighting the evolution and disruption of the primary vortex structure over time.

In contrast, the deeper narrow trench case T30-6-5 exhibits stronger unsteady features (figure 23 bi–bv). The higher threshold (λ2 = –1) iso-surface highlights the formation of a coherent vortex shed from the upstream shear layer, characteristic of K–H instability. However, as shown in the dashed regions across sequential snapshots (figure 23 bi–bv), this large-scale vortex quickly transitions to fine-scale vortex structures due to the interference of the trench’s trailing edge. The time-averaged velocity field in figure 24(a) further supports this interpretation: two large, stable, counter-rotating recirculating zones are observed within the trench, constrained below the outer shear layer and delineated by smooth, closed streamlines. These trench-scale vortices occupy the trench and are bounded above by the outer shear layer, which traverses throughout the trench without fully reattaching. This characteristic also resembles that of open cavity flow regime defined in figure 2(a). As a result, the cylinder remains immersed in a low-velocity, shielded region, with minimal penetration from the energetic outer shear layer. This no-interaction state, where the outer shear layer does not engage with the cylinder’s boundary layer, explains the complete shielding force response observed in § 3.2, characterised by low r.m.s. force coefficients and a broadband spectral signature.
Time-averaged streamwise velocity (u) field and in-plane streamlines for case (a) T30-6-5 and (b) T30-20-5 at Re = 3900.

In comparison, the wide and deep trench configuration T30-20-5 exhibits qualitatively similar, yet more pronounced, flow behaviour. The time-averaged velocity field with streamlines (figure 24
b) shows a dominant, large-scale recirculation cell occupying the full trench width, bounded above by a well-defined outer shear layer. This configuration closely resembles the transitional cavity flow regime in figure 2, in which the shear layer remains detached from the trench floor, but interacts with the internal recirculating flow. The detached shear layer undergoes sustained roll-up, creating favourable conditions for the onset and downstream amplification of K–H instabilities. Instantaneous flow fields shown in figure 25 further illustrate this process. The
 $\lambda _{2}=-2$
iso-surface, coloured by
 $\omega _{x}$
, reveals that shedding of vortices initiates upstream of the cylinder. Within the dashed boxes, large-scale vortices are seen to roll up along the shear layer, which is a clear signature of K–H instability. Unlike in narrow trenches, where geometric confinement rapidly disrupts such instabilities, these vortices in T30-20-5 persist and amplify, as highlighted in the green-circled regions of figure 25. The downstream coherent vortex retains as it propagates over the cylinder and interacts with the trench’s trailing edge, where it eventually dissipates energy and breaks down into small-scale vortices. This sequence reflects a more fully developed K–H instability, facilitated by the increased trench width and depth, which provide the spatial extent necessary for instability growth before encountering geometric constraints.
Instantaneous flow structures for wide and deep case T30-20-5 at Re = 3900, visualised by
 $\lambda _{2}=-2$
iso-surfaces coloured by corresponding streamwise vorticity
 $\omega _{x}$
.

The side slope of the trench also plays a significant role in modulating shear-layer development by altering the effective spatial extent and confinement characteristics of the trench. By adjusting the degree of enclosure and the geometry of the trench sidewalls, variations in side slope influence the strength and evolution of recirculation zones, the accessibility of the outer shear layer, and ultimately the formation of coherent vortical structures.
The influence of trench side slope is clearly evident by comparing the steep-sided configurations at T45-20-5 and T60-20-5, as shown by the time-averaged velocity fields and streamline patterns in figure 26. In both cases, two large, stable, counter-rotating recirculating zones are again present, resembling those observed in narrower and moderately sloped configurations such as T30-6-5, but in contrast to one broader, more horizontally extended recirculation cell seen in case T30-20-5. The steep sidewalls reduce the effective horizontal space within the trench, thereby constraining the upward and downward development of the vortex cells and limiting their interaction with the cylinder’s boundary layer. As a result, the flow near the cylinder remains relatively steady, consistent with the lower levels of unsteady forcing and the broadband spectral response documented in § 3.2.
Time-averaged streamwise velocity (u) field and in-plane streamlines for case (a) T45-20-5 and (b) T60-20-5 at Re = 3900.

It is also noteworthy that when the trench is sufficiently deep, configurations with similar trench opening lengths (i.e. the span of the top trench edge exposed to the outer flow) tend to exhibit comparable shear-layer behaviour. This geometric similarity promotes analogous patterns of shear-layer interaction and vortex distribution within the trench, which in turn yields similar hydrodynamic force responses on the cylinder. This trend is evident in cases such as T30-20-5, T45-27.32-5, T60-31.55-5 and T90-37.32-5, all of which share an opening length of approximately 37.32D, although detailed comparisons are not presented here.
Taken together, these findings demonstrate that narrow, deep and steep-sided trenches are highly effective at limiting the interaction between the coherent structures generated by K–H instability and the boundary layer of the cylinder, thereby mitigating unsteady hydrodynamic forces on cylinders. Whether achieved through reduced trench width, increased depth or steeper sidewalls, these configurations consistently produce flow regimes characterised by stable recirculating vortices and low-velocity zones around the cylinder. These mechanisms lead to consistently low force fluctuations and broadband spectral signatures, underscoring the shielding capacity of such configurations.
3.3.2. Interaction between the outer shear layer and cylinder’s boundary layer
Wide, shallow trench configurations establish a distinct interaction regime in which the outer shear layer penetrates into the trench and interacts directly with the flow structures developing around the cylinder. This geometric arrangement facilitates enhanced coupling between the outer shear layer and the cylinder’s boundary layer, promoting vortex amplification and resulting in stronger unsteady forcing compared with more confined trench cases. The representative case T30-20-3 is examined here to illustrate this behaviour. In this configuration, the trench is moderately shallow yet sufficiently wide to allow penetration of the outer shear layer toward the cylinder.
The instantaneous flow structures, visualised via iso-surfaces of λ
2 = –2 coloured by the streamwise vorticity
 $\omega _{x}$
(figure 27), reveal a spatially distributed and dynamically active vortex field. Coherent vortices periodically emerge along the outer shear layer and interact with the trench-induced recirculation upstream of the cylinder (highlighted in dashed boxes), exhibiting stronger connectivity with the near-cylinder region compared with deeper or more confined configurations. Although these structures are less spatially coherent than those found in wide, deep trenches, their persistent interaction with the cylinder results in intensified unsteady flow dynamics.
Instantaneous flow structures for case T30-20-3 at Re = 3900, visualised by
 $\lambda _{2}=-2$
iso-surfaces coloured by corresponding streamwise vorticity
 $\omega _{x}$
.

This behaviour is consistent with a closed cavity regime depicted in figure 2(c), where the shear layer interacts with the internal recirculating flow and reattaches along the trench floor. The time-averaged velocity field and streamline patterns (figure 28) support this classification, showing that the shear layer dips into the trench and approaches the cylinder, forming a recirculation region upstream and adjacent to the cylinder body. This configuration enables frequent interactions between the descending shear layer and the trapped trench vortices, initiating repeated vortex shedding near the cylinder.
Time-averaged streamwise velocity (u) field and in-plane streamlines for case T30-20-3.

Consequently, this geometry produces the strongest unsteady forcing among all configurations considered. It exceeds that of narrow, confined trenches where shear-layer penetration is suppressed, as well as wide, deep trenches where the shear layer evolves more freely but remains less coupled to the cylinder. The wide, shallow trench facilitates vigorous vortex amplification and efficient momentum exchange near the cylinder, reflected in the elevated r.m.s. force coefficients and pronounced spectral peaks reported in § 3.2.
Importantly, the development of K–H instability along the shear layer is significantly modulated by the presence of the cylinder. As the shear layer convects downstream, its coherent roll-up is disrupted by the bluff-body-induced disturbance. This interaction alters the spatial development of the instability, preventing the formation of continuous large-scale vortices and instead promoting fragmented and reorganised structures in the cylinder’s vicinity. Despite this disruption, the persistent reconnection between the shear layer and internal recirculation sustains vigorous, three-dimensional unsteady flow dynamics. Thus, the wide, shallow trench emerges as the most dynamically active configuration studied, characterised by cylinder-induced disturbance, persistent shear-layer–cylinder interaction and strongly amplified vortex-induced forcing.
This mechanism also explains the progressive amplification of hydrodynamic response with increasing cylinder streamwise offset
 ${L}_{p}^{*}$
in case T30-20-1 (refer to figure 18). When the cylinder is positioned near the trench’s leading edge (
 ${L}_{p}^{*} \leq$
−7), the outer shear layer remains elevated and largely unaffected by the trench geometry. In this zone, the cylinder resides within a region of flow isolation and experiences negligible interaction with the overlying shear layer, resulting in a stable, nearly steady hydrodynamic response. As the cylinder moves downstream to
 ${L}_{p}^{*}$
= −6.5, the outer shear layer begins to intrude into the trench and descend towards the cylinder, initiating interactions with the cylinder’s boundary layer. This transition corresponds to the modest increase in C
D,rms
and C
L,rms
, along with the appearance of distinct spectral peaks in both C
D
and C
L
, indicating the onset of coherent unsteady forcing.
As the cylinder is displaced downstream into the range −6.5
 $\lt {L}_{p}^{*}\lt$
2, the unsteady response intensifies significantly. The descending shear layer penetrates deeper into the trench, progressively interacting with the cylinder and promoting stronger shear-layer instabilities around the cylinder. In the upstream portion of this range (e.g.
 ${L}_{p}^{*}=$
−5), this interaction destabilises the cylinder’s boundary layer, initiating vortex shedding directly from the cylinder surface, as visualised in figure 29. Further downstream, the shear layer becomes increasingly unstable and disintegrates into finer-scale vortices before reaching the cylinder (like the T30-20-3 case shown previously). This evolution gives rise to more chaotic fluctuations and diminishes the coherence of the vortex shedding, resulting in irregular force responses. Overall, this zone is characterised by pronounced shear-layer–cylinder interactions, where increasing
 ${L}_{p}^{*}$
leads to increasingly disorganised and spatially distributed unsteady forcing.
Instantaneous flow structures for case T30-20-1 at Re = 3900 with
 ${L}_{p}^{*}$
= −5, visualised by
 $\lambda _{2}=$
−1 iso-surfaces coloured by corresponding streamwise vorticity
 $\omega _{x}$
.

(a–e) Instantaneous streamwise vorticity fields
 $\omega _{z}$
and (f) time-averaged streamwise velocity (u) field and in-plane streamlines for case T30-20-1 at Re = 3900 with
 ${L}_{p}^{*}$
= 8.

At even larger
 ${L}_{p}^{*}$
values (
 ${L}_{p}^{*} \geq$
2), the cylinder is positioned downstream of the shear-layer reattachment point, as indicated by the streamline patterns in figure 30(f). In this zone, the cylinder is subjected to pronounced shear-layer penetration and strong interactions with trench-scale recirculation originating from the trailing edge. This exposure leads to intensified turbulence and frequent vortex impingement, as illustrated in figure 30(a–e). The resulting flow regime is highly energetic, characterised by elevated turbulence intensity and strong three-dimensionality. Consequently, the drag and/or lift reduction factors (R
D
and/or R
L
) exceed 1.0, surpassing those observed over a flat seabed configuration.
Wide, shallow trench configurations produce a distinct flow regime where the outer shear layer penetrates the trench and actively interacts with the near-cylinder region. In contrast to the complete shielding observed in narrow, confined trenches or the instabilities of wide, deep geometries, this configuration facilitates intermittent shear-layer penetration, reconnection and enhanced vortex shedding in the vicinity of the cylinder. These processes culminate in the strongest unsteady force response among all tested cases. The intensity of this interaction is further modulated by the cylinder streamwise offset: as
 ${L}_{p}^{*}$
increases, the local shear layer becomes increasingly unstable and interacts more directly with both the cylinder and trench-scale recirculations, leading to intensified turbulence and irregular force fluctuations. Collectively, these findings highlight the critical influence of trench geometry and cylinder placement in governing the interplay between shear-layer evolution, boundary-layer destabilisation, and vortex-induced hydrodynamic loading.
3.3.3. Shear layer instability and Reynolds number
Reynolds number exerts a pronounced influence on the stability and evolution of the outer shear layer, particularly in trenched configurations where its interaction with trench-induced recirculation and the cylinder boundary layer plays a pivotal role. As Re increases, the outer shear layer becomes progressively thinner and develops sharper velocity gradients, as shown in figure 31 as an example, making it more prone to K–H instabilities. This promotes earlier roll-up and enhances the complexity of unsteady interactions with both the trench geometry and the cylinder surface.
(a) Streamwise velocity profiles at
 $ x/D$
= −10 and (b) corresponding shear-layer thicknesses
 $\delta_m$
, quantified using (3.2), for varying Reynolds numbers (500–3900) in case T30-20-3.

These effects are clearly illustrated in the shallow, wide trench configuration T30-20-3, as shown in figure 32. At Re = 500, the flow remains largely steady and attached, with negligible vortex shedding (figure 32 a) and minimal turbulence intensity (figure 32 f), as evidenced by the uniformly low turbulence kinetic energy (TKE) distribution. This behaviour is consistent with that observed in narrow, confined trench configurations discussed in § 3.3.1. As the Reynolds number increases to Re = 1000 (figure 32 b), the onset of K–H roll-up becomes apparent, with coherent vortical structures beginning to develop near the trench’s trailing edge, accompanied by rising TKE levels in the downstream region (figure 32 g). The appearance of such coherent structures mirrors the behaviour observed in ‘deep, wide’ trench cases described in § 3.3.1, indicating that the effective ‘depth’ and ‘width’ of a trench must also be considered relative to the evolving shear-layer characteristics of the outer flow, not merely in terms of geometric containment of the cylinder.
Instantaneous vorticity fields in case T30-20-3 at various Reynolds numbers, visualised using iso-surfaces of
 $\lambda _{2}$
coloured by the corresponding streamwise vorticity
 $\omega _{x}$
: (a)
 $\lambda _{2}$
= −0.1 at Re = 500; (b,c)
 $\lambda _{2}$
= −1 at Re = 1000 and 2000; (d,e)
 $\lambda _{2}$
= −2 at Re = 3000 and 3900. (f– j) Time- and spanwise-averaged turbulence kinetic energy (TKE) for each case, using a uniform contour threshold range of 0–0.05.

At Re = 2000, K–H roll-up becomes more pronounced and initiates closer to the cylinder (figure 32 c), generating enhanced unsteady forcing and a notable increase in local TKE (figure 32 h). As the Reynolds number rises to Re = 3000, the flow transitions into a more spatially complex and energetically active regime. Vortex structures grow in size and strength, exhibiting pronounced three-dimensionality (figure 32 d), while the TKE distribution broadens in both vertical and streamwise directions (figure 32 i). This expansion indicates intensified vortex amplification and more efficient momentum exchange between the outer shear layer and the trench-confined flow. At the highest Reynolds number considered (Re = 3900), the outer shear layer becomes highly unstable, fragmenting into finer-scale vortical structures that fill the trench region (figure 32 e). Although large-scale coherence diminishes, elevated turbulence levels persist, indicating sustained dynamical activity within the trench. Notably, the TKE field exhibits a clear upstream shift relative to lower Re cases (figure 32 j), signalling that instability onset and energy amplification occur earlier along the shear layer path. This upstream displacement of turbulent energy highlights the increasing susceptibility of the shear layer to K–H instabilities and underscores the dominant role of shear-layer evolution over trench-induced recirculation at high Reynolds numbers. These trends reflect the intensified interaction between outer flow structures and the cylinder boundary layer, as described in § 3.3.2, and collectively demonstrate how increasing Re enhances the overall unsteadiness and energetic complexity of the flow.
To conclude, increasing Reynolds number progressively destabilises the outer shear layer, enhancing its susceptibility to Kelvin–Helmholtz instability and promoting earlier onset of vortex roll-up. In wide, shallow trench configurations such as T30-20-3, this results in more frequent and energetic interactions between the shear layer and the cylinder, thereby intensifying unsteady forcing. The upstream shift in turbulence production and the breakdown of large-scale coherence at higher Reynolds numbers reflect a transition towards a more turbulent, less organised flow regime. These findings underscore the role of Reynolds number as a key modulator of flow unsteadiness in trenched environments, particularly when the geometry allows for appreciable shear-layer intrusion. Accordingly, when classifying a trench as ‘wide’ or ‘deep’, it is essential to consider the local Reynolds number, which governs the effective spatial development and dynamical behaviour of the shear layer.
4. Discussions
To better elucidate the evolution of hydrodynamic responses experienced by a cylinder within trench geometries, four characteristic flow regimes around the cylinder are identified: (I) no interaction regime; (II) transitional regime; (III) interaction regime; and (IV) strong interaction regime. These classifications are based on two key indicators: the mean force reduction factors R D and R L , and the fluctuation intensity of the drag force signal, quantified by the peak-based metric Ψ D proposed by Ren et al. (Reference Ren, Liu, Cheng, Tong and Xiong2023). This metric is defined as
 \begin{align}\Psi_D = \left(C_{D}^{\textit{pks}}-\overline{{C}_{D}^{\textit{pks}}} \right)\!,\end{align}
where
 ${C}_{D}^{\textit{pks}}$
denotes the local maxima of the instantaneous drag coefficients C
D
(t), and
 $\overline{{C}_{D}^{\textit{pks}}}$
is the corresponding mean value. This metric captures the amplitude and variability of peak force events, offering a more sensitive measure of unsteady forcing than global r.m.s. values alone.
Regime map as a function of the trench-width-to-cylinder-diameter ratio (
 $ W^{*}$
) and trench-depth-to-cylinder-diameter ratio (
 $ H^{*}$
) at
 $\theta$
= 30
 $^{\circ}$
and Re = 3900. The shaded regions (I–IV) represent the flow regimes identified based on the Ψ
D
criterion. (a–c) Schematic representations of typical trench flow conditions (open, transitional and closed trench configurations), with the corresponding flow regimes indicated by matching labels (I–IV) and colours (blue, yellow, pink and grey) for the cylinders placed within the trench.

Based on these criteria, the four regimes are defined as follows.
-
(I) No interaction regime: R D , R L
$\lt$
1.0 and Ψ
D
$\leq$
0.0001. This regime is characterised by near-steady hydrodynamic force behaviour, where both the mean and peak fluctuations remain minimal due to the protective effect of the trench configuration. In this regime, the outer shear layer does not significantly interact with the cylinder’s boundary layer. Cases classified within this regime are indicated by blue shading in the regime map as a function of trench-width-to-cylinder-diameter ratio (
$ W^{*}$
) and trench-depth-to-cylinder-diameter ratio (
$ H^{*}$
) in figure 33.This flow regime can occur across different trench types (same as the definition of cavity flow behaviour), namely, open, transitional and closed. As shown by the blue cylinders in figure 33(a–c), in open trenches, the cylinder may be placed anywhere along the trench bottom and still remain within the shielded regime. In transitional and closed trenches, cylinders positioned outside the direct influence zone of the outer shear layer can also exhibit similar shielding characteristics.
-
(II) Transitional regime: R D , R L
$\lt$
1.0 and 0.0001
$\lt$
Ψ
D
$\leq$
0.001. This regime represents an intermediate state where mild fluctuations begin to develop. Although the mean hydrodynamic shielding remains largely effective, early signs of unsteady flow become apparent. Vortex shedding occurs, but it has not yet established direct interaction with the cylinder’s boundary layer. Instead, the recirculating flow within the trench starts to exert a noticeable influence on the near-cylinder dynamics. Cases falling into this regime are indicated by yellow shading in figure 33. The transitional regime typically appears in both transitional and closed trench configurations, where the outer shear layer begins to approach the cylinder’s boundary layer. This is illustrated by the yellow cylinders in the right insets of figure 33. -
(III) Interaction regime: R D , R L
$\lt$
1.0 and 0.001
$\lt$
Ψ
D
$\leq$
0.01. This regime is characterised by pronounced unsteady forces, typically resulting from the K–H instabilities combined with vortex disruption induced by the presence of the cylinder. In this regime, shed vortices from the outer shear layer interact directly with the cylinder’s surface, leading to intensified energy exchange and significant flow disturbances. Cases within this regime are marked by pink shading in figure 33. It predominantly occurs in transitional and closed trench configurations, where the outer shear layer directly impinges on the cylinder, illustrated by the pink cylinders in figure 33(b,c). -
(IV) Strong interaction regime: R D or R L
$\geq$
1.0, often accompanied by relatively large values of Ψ
D
. In this regime, the trench no longer provides effective hydrodynamic shielding and the mean forces acting on the cylinder exceed those observed over a flat seabed. Cases in this regime are indicated by grey shading in figure 33. The amplification of hydrodynamic forces is typically driven by intensified turbulence near the shear-layer reattachment region, as illustrated by the grey cylinder in the closed trench configuration in figure 33(c). Such behaviour is likely to arise when the outer shear layer breaks down into highly chaotic vortices that directly interact with the cylinder’s boundary layer. Such conditions may arise when the cylinder is located near the downstream end of a trench, as discussed in § 3.3.2, in the centre of sufficiently wide trench geometries or under high Reynolds number flows where turbulent instabilities dominate.


5. Conclusions
This study presents a systematic parametric investigation of the hydrodynamic response of a stationary circular cylinder placed within trenched seabed geometries under steady current conditions, with particular emphasis on natural seabed valleys, and relatively deep and wide artificial trenches. High-fidelity three-dimensional implicit large-eddy simulation (iLES) using Nektar++ is performed over an extended parameter space, including trench width and depth (1
 $\leq$
 $ W^{*}$
 $\leq$
20, 1
 $\leq$
 $ H^{*}$
 $\leq$
5), trench side slope (15
 $^{\circ}\leq \theta \leq$
60
 $^{\circ}$
), the streamwise offset of the cylinder centre from the trench centreline (
 ${L}_{p}^{*}$
) and Reynolds number (500
 $\leq$
Re
 $\leq$
3900). The novel findings and conclusions of this study are summarised as follows.
-
(i) Trench geometry strongly governs hydrodynamic response. Narrow, deep and steep-sided trenches provide complete shielding by limiting the penetration of the outer shear layer and confining trench-induced recirculation zones. In contrast, wide and shallow trenches allow significant shear-layer intrusion and promote its direct interaction with the cylinder’s boundary layer, leading to intensified force fluctuations. In such cases, both R D and R L increase significantly and may become larger than the reduction factors implied by DNV-RP-F109, indicating that the guideline may not remain conservative under these conditions. For such trench configurations, trench-width effects are more reliably assessed through dedicated CFD analyses.
-
(ii) The streamwise offset of the cylinder centre from the trench centreline (
${L}_{p}^{*}$
) determines the exposure to shear-layer activity. Cylinders positioned near the trench’s leading edge are effectively shielded from flow instabilities, while those located downstream encounter stronger shear-layer interactions and vortex impingement. The resulting force fluctuations evolve from low-amplitude with broadband oscillations to high-amplitude with energy-concentrated oscillations. -
(iii) Reynolds number modulates the onset and strength of flow instability. As Re increases, the outer shear layer becomes increasingly susceptible to Kelvin–Helmholtz instabilities, initiating earlier vortex roll-up and enhancing energy exchange with the trench interior. This process shifts turbulence production upstream and leads to progressively stronger unsteady forcing on the cylinder, especially in wide trench configurations.
-
(iv) Four characteristic flow regimes are identified: no interaction, transitional, interaction and strong interaction regimes, based on the combination of mean force reduction factors (R D , R L ) and peak drag fluctuation metric (Ψ D ). These regimes capture the progression from steady to increasingly energetic flow states and provide a physically grounded framework for classifying trench–cylinder flow regimes.

In summary, this work provides detailed physical insight into the complex flow phenomena around trenched cylinders and offers an improved foundation for assessing hydrodynamic responses on subsea cables laid in natural topographies. The proposed regime classification and parameter sensitivities can inform both numerical modelling strategies and practical engineering guidelines.
Acknowledgements
The authors would like to thank the three anonymous referees for their valuable comments and suggestions, which have greatly improved the manuscript.
Funding
This research was supported by computational resources provided by the National Computational Merit Allocation Scheme (NCMAS) and the Pawsey Supercomputing Centre, with funding from the Australian Government and the Government of Western Australia. F.T. and L.C. acknowledge the Australian Research Council Discovery Project (Project ID: DP200102804). This work was also supported by Fundamental Research Funds for the Central Universities (Funding: No. 2025ZYGXZR060) and Guangdong Basic and Applied Basic Research Foundation (Funding: No. 2026A1515030017).
Declaration of interests
The authors report no conflicts of interest.
Appendix A. Mesh sensitivity check
A mesh dependence study on the 3-D mesh used in the present study is performed based on the flat seabed case T0-0-0 at Re = 3900 over the following parameters: computational domain (the outflow length
 $ L_{o}$
), h-type mesh
 $N_{el}$
, interpolation order N
p
, spanwise Fourier expansion N
z
and timestep
 $\varDelta{t}^*$
. The h-type mesh distribution close to the cylinder is shown in figure 34. The cylinder circumference is subdivided into N
c
= 56 elements; the height of the first layer of macro-element around the cylinder is approximately 0.01D; the expansion ratios of the macro-elements are kept below 1.2, referring to Jiang & Cheng (Reference Jiang and Cheng2021), Ren et al. (Reference Ren, Cheng, Xiong, Tong and Chen2021) and Ren et al. (Reference Ren, Liu, Cheng, Tong and Xiong2023). The mesh convergence is checked by comparing the mean force coefficients
 $C_{D,mean}$
and
 $C_{L,mean}$
on the cylinder.
The h-type mesh distribution close to the cylinder.

The results are listed in table 3, selecting the mesh with
 $ L_{o}$
= 100D,
 $N_{el}$
= 5025, N
p
= 6, N
z
= 96 and
 $\varDelta{t}^*$
= 0.001 as the reference mesh numbered 1 in table 3. The biggest difference of the hydrodynamic forces calculated between mesh 2–6 and the reference mesh 1, as shown in brackets after the mean values, is 0.51 %, indicating that mesh 1 is adequate for the numerical simulations of the present study with Re
 $\leq$
3900.
Influence of the mesh parameters on hydrodynamic force coefficients.

Appendix B. Linear interpolation for forces on the cylinder
The numerical models include a contact width where the cylinder is lying on the flat seabed / bottom of the trench, as shown in figure 35. The effect of this on the hydrodynamic forces of the cylinder is eliminated using the linear interpolation. The missing pressure for the ‘buried’ part of the cylinder is estimated from the average of the pressure at points A and B (see the red dotted line in figure 36). The lateral and longitudinal components of the interpolation pressure are added to the mean value of drag and lift coefficients, respectively, to get the corrected value. This method is valid for seabeds with limited permeability mentioned by Griffiths et al. (Reference Griffiths, Shen, Xu and Leggoe2012).
Cylinder–seabed/trench bottom contact width correction.

Linear interpolation of pressure on the circular cylinder.

To assess the influence of partial cylinder burial on the flow dynamics, a sensitivity check was conducted prior to the full set of numerical simulations for two near-wall configurations with very small burial ratios:
 $ G/D$
= 0.07 (approximately 7 %, adopted in the present study for meshing convenience) and
 $ G/D$
= 0.001, which closely represents a cylinder just touching the wall. The resulting mean drag and lift coefficients differ by less than 1.5 %, and no discernible differences are observed in the wake structure or vortex-shedding behaviour. These results indicate that, within the near-wall regime considered here, the choice of
 $ G/D$
= 0.07 has a negligible influence on the hydrodynamic response.
Appendix C. Statistical convergence check
Figure 37 presents a statistical convergence check for the T30-20-1 case. The mean and root-mean-square values of the drag and lift coefficients, together with the dominant frequency of lift coefficient, are evaluated as functions of the averaging time window. Statistics are collected over increasing sampling intervals ranging from 100 to 600 non-dimensional time units (t*), following an initial flow development period of approximately 600t*. It is observed that all statistical quantities rapidly converge towards stable, asymptotic values once the averaging window exceeds approximately 300t*. Based on this assessment, and to ensure statistical convergence across all simulated cases, an averaging period of 400t* is adopted throughout the present study.
Statistical convergence of the mean and r.m.s. force coefficients and the dominant frequency in T30-20-1.