INTRODUCTION
The population dynamics of any living organism are shaped by both intrinsic (e.g. density) and extrinsic (e.g. climate) factors (Berryman Reference BERRYMAN1999). Density-dependence seems to vary greatly among the taxa in which it has been reported. While rare in birds (Croxall & Rothery Reference CROXALL, ROTHERY, Perrins, Lebreton and Hirons1991), it seems especially common in mammals (Erb et al. Reference ERB, BOYCE and STENSETH2001). Small mammals in particular have proved ideal subjects for investigating density-dependence by various methods (time series: Stenseth Reference STENSETH1999; enclosure experiments: Aars & Ims Reference AARS and IMS2002; analysis of demographic parameters estimated from capture-recapture data: Julliard et al. Reference JULLIARD, LEIRS, STENSETH, YOCCOZ, PREVOT-JULLIARD, VERHAGEN and VERHEYEN1999, Lima et al. Reference LIMA, STENSETH, LEIRS and JAKSIC2003, Prévôt-Julliard et al. Reference PRÉVÔT-JULLIARD, HENTTONEN, YOCCOZ and STENSETH1999). Many extrinsic factors have also been put forward to account for the population dynamics of small mammals, including predation (Ims & Andreassen Reference IMS and ANDREASSEN2000), parasitism (Telfer et al. Reference TELFER, BENNETT, BOWN, CAVANAGH, CRESPIN, HAZEL, JONES and BEGON2002), climate (Lima et al. Reference LIMA, JULLIARD, STENSETH and JAKSIC2001) and food resources (Boutin Reference BOUTIN1990). While most studies have focused on a single factor, some have recently demonstrated that population dynamics is best understood in a framework combining multiple factors, particularly because of interactions between extrinsic and intrinsic factors (Leirs et al. Reference LEIRS, STENSETH, NICHOLS, HINES, VERHAGEN and VERHEYEN1997, Lima et al. Reference LIMA, JULLIARD, STENSETH and JAKSIC2001, Stenseth Reference STENSETH1999). Environmental disturbances such as fires, clear-cutting or flooding are known to have tremendous impacts on small-mammal population dynamics (Brown et al. Reference BROWN, WHITMAN, ERNEST and GEHRING2001, Halvorson Reference HALVORSON1982, Yunger Reference YUNGER2002). The effects of floods on small-mammal population dynamics have been closely studied in various small-mammal communities (Chamberlain & Leopold Reference CHAMBERLAIN and LEOPOLD2003, Fournier-Chambrillon et al. Reference FOURNIER-CHAMBRILLON, FOURNIER, GAILLARD, GENTY, HANSEN and VIÉ2000, Granjon et al. Reference GRANJON, COSSON, QUESSEVEUR and SICARD2005, Haferkorn Reference HAFERKORN1994, Jacob Reference JACOB2003, but see Batzli Reference BATZLI1977). Most studies have reported variation in abundance for various species and have investigated the effects of flooding on the composition of small-mammal communities (e.g. by allowing certain previously rare species to proliferate) or the order in which species recolonize areas after flooding (Anderson & Shapiro Reference ANDERSON and SHAPIRO1957, Klinger Reference KLINGER2006, Zhang et al. Reference ZHANG, WANG, WANG, GUO, LI and HUANG2007). This paper focuses instead on demographic parameters – survival and recruitment – within a single species, the multimammate rat Mastomys erythroleucus (Temminck, 1853).
Multimammate rats of the genus Mastomys are among the most widespread pest species in West Africa where they may severely damage crops especially during outbreaks (Leirs Reference LEIRS, Singleton, Hinds, Krebs and Spratt2003). Worse still, several Mastomys species are substantial reservoirs of human pathogens (Gratz Reference GRATZ1997). Primarily to alleviate the burden Mastomys imposes on human populations, certain Mastomys species have come in for close study (see Leirs in press for a synthesis) as regards their physiology (Granjon et al. Reference GRANJON, GANEM, BA and DUPLANTIER1994), ecology (Hubert & Adam Reference HUBERT and ADAM1981, Hubert et al. Reference HUBERT, ADAM and POULET1978, Leirs Reference LEIRS1995) and evolutionary biology (Granjon & Duplantier Reference GRANJON and DUPLANTIER1993, Leirs et al. Reference LEIRS, VERHAGEN and VERHEYEN1994). In the realm of population dynamics, studies have been conducted on M. erythroleucus (Hubert Reference HUBERT1982, Granjon Reference GRANJON1987) and M. huberti (Granjon et al. Reference GRANJON, GANEM, BA and DUPLANTIER1994, Reference GRANJON, COSSON, QUESSEVEUR and SICARD2005) in West Africa. In East African populations of M. natalensis, a few studies have reported that abundance of individuals impacts survival in wild populations (Julliard et al. Reference JULLIARD, LEIRS, STENSETH, YOCCOZ, PREVOT-JULLIARD, VERHAGEN and VERHEYEN1999, Leirs et al. Reference LEIRS, STENSETH, NICHOLS, HINES, VERHAGEN and VERHEYEN1997, Lima et al. Reference LIMA, STENSETH, LEIRS and JAKSIC2003, Sluydts et al. Reference SLUYDTS, CRESPIN, DAVIS, LIMA and LEIRS2007).
In this paper, we use 4 y of capture-recapture data collected year round at a site in Mali flooded annually by the Niger River to describe the pattern in survival and recruitment in a wild population of M. erythroleucus. We use recent capture-recapture methods to analyse population size (Karanth & Nichols Reference KARANTH and NICHOLS1998), survival (Lebreton et al. Reference LEBRETON, BURNHAM, CLOBERT and ANDERSON1992) and seniority (Nichols et al. Reference NICHOLS, HINES, LEBRETON and PRADEL2000). More specifically, these analyses allow us to investigate the impact of the flood of the River Niger on survival and seniority probabilities, by combining one intrinsic (abundance) and two extrinsic (cumulative rainfall, taken as a surrogate of primary production, and water level of the River Niger) factors.
METHODS
Study site
Djoliba is located 40 km south-west of Bamako (Mali 8°12 W 12°32 N). The climate is Sahelian to Sudanian with a single rainfall season of about 5 mo (June–October). The dry season is traditionally split into a first period, from November to February, where daily and especially night-time temperatures are relatively cool, and a second period, from March to May, where daily temperatures are hotter. There was much variation among years in the amount of rainfall and the number of rainy days. The year 2000 had 717 mm of rainfall over 80 d; 2001: 722 mm over 60 d; 2002: 720 mm over 55 d; 2003: 1108 mm over 82 d (data from the National Meteorological Service, Bamako). The River Niger floods once a year starting around May–June and reaching its maximum in late September and its minimum in March–April. The flood is thus a slow, continuous phenomenon rather than a quick and catastrophic event (Batzli Reference BATZLI1977). However, as the slope of the plain of the River Niger is generally gentle, vast areas are simultaneously exposed to flooding by changes in river level (Granjon et al. Reference GRANJON, COSSON, QUESSEVEUR and SICARD2005). During the study, there were four flooding events of variable intensity; the maximum water levels were 540 cm in 2000, 684 cm in 2001, 494 cm in 2002 and 606 cm in 2003 (data from the National Meteorological Service, Bamako).
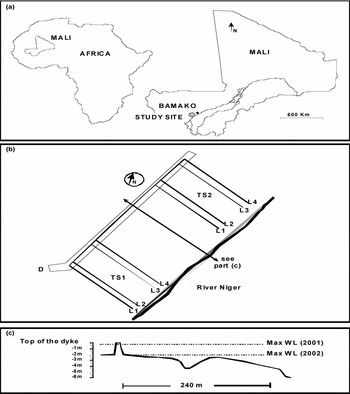
Djoliba is situated on the River Niger's alluvial plain. The study zone sloped gently from a dyke built to contain the floodwaters of the River Niger, but now largely eroded, down to the river bank. There were two main vegetation types in the study zone: a shrub savanna characterised by several tree species, e.g. Ficus gnaphalocarpa (Miq.) A. Rich., Guiera senegalensis J.F. Gmel., Acacia macrostachya Reichenb. and Combretum lecardii Engl. and a riverine forest dominated by Combretum lecardii associated with Dichrostachys glomerata (Forssk.) Chiov., Mitragyna inermis (Willd.) Kuntze, Piliostigma reticulatum (DC.) Hochst. and Guiera senegalensis. Vetiveria nigritana (Benth.) Stapf was the commonest grass species. There were many termite colonies throughout the study area. Traps were laid in a U-shaped pattern, each arm of the U (TS1 and TS2, about 250 m apart, Figure 1) being made up of two groups (80 m apart) of two trapping lines (20 m apart) of 25 traps (L1-L2 and L3-L4). An extra trapping line of 50 traps (D) joined both arms of the U and was actually set up over the dyke referred to above (about 250 m from the River Niger's main watercourse). All traps were 10 m apart and each trap position was recorded via a global positioning system (GPS, with a displayed maximum accuracy of 5 m). In the course of the study, 27 individuals were recorded travelling between the separate components (D, TS1 and TS2) of the trapping pattern; for this reason, all capture-recapture data were analysed together.
Trapping site. The study site was situated 40 km south-west of Bamako in the alluvial plain of the River Niger (Mali 8°12 W 12°32 N, see (a). The trapping design was formed of several sets of trapping lines, roughly perpendicular to the shore and connected by an extra trapping line set up on the dyke (see (b) and text for further details). There was a gentle slope from the dyke to the river (see (c)).

Trapping schedule
Twenty-one primary trapping sessions (PTSs) were carried out from July 2000 to January 2004. The average time between two consecutive PTSs was 64 d (range: 27–119). To deal with the unequal time intervals between PTSs, all survival and seniority probabilities were standardised to 7 d. Each PTS lasted from 4 to 7 d. Traps were baited with groundnut paste, set in the late afternoon and checked every morning. In this work, we focus on Mastomys erythroleucus (Temminck, 1853) which represented more than 90% of all captures but six other rodent species were also captured at the site: Taterillus gracilis (Thomas, 1892), Mus (Nannomys) musculoides Temminck, 1853, Cricetomys gambianus Waterhouse, 1840, Dasymys rufulus Miller, 1900, Rattus rattus (Linnaeus, 1758) and Arvicanthis ansorgei Thomas, 1910. Small mammals were treated in a humane manner, and in compliance with Malian Centre National de la Recherche Scientifique et Technique authorisations and guidelines of the American Society of Mammalogists (Animal Care and Use Committee 1998). Individuals were sexed, weighed and individually marked by toe-clipping before being released at their capture point. Unfortunately reproductive activity of individuals was not assessed from the first to the twelfth PTS included. Although we are aware that the relationship between age and body weight is not simple in many rodent species (Leirs Reference LEIRS1995), it was assumed, as a first approximation, that specimens weighing 20 g or less were young individuals (Granjon et al. Reference GRANJON, COSSON, QUESSEVEUR and SICARD2005). Duplantier (Reference DUPLANTIER1988), carrying out laboratory crosses, showed that a body weight of 20 g corresponds roughly to an age of 2 mo for both an insular and a continental population of M. erytholeucus. By identifying young individuals among the data, we were able to infer the dates of the breeding seasons for each year.
Capture-recapture modelling
Capture-recapture data were initially collected under a Pollock's robust design (Pollock Reference POLLOCK1982) but data were sparse for several trapping sessions. Sparseness of data is known to jeopardize the correct estimation of population size when using closed population models; in particular, with sparse data, the model selection routine in the CAPTURE program becomes unreliable (Hammond & Anthony Reference HAMMOND and ANTHONY2006, Menkins & Anderson Reference MENKINS and ANDERSON1988). We decided, then, to estimate population sizes at each trapping session without making a model selection. Our a priori expectation was that model Mh would provide a reasonable model for capture probability since Sluydts et al. (Reference SLUYDTS, CRESPIN, DAVIS, LIMA and LEIRS2007) have applied it successfully to a population of M. natalensis in Tanzania. We used the jack-knife estimator because it is robust to deviations from underlying models and has performed well in simulations (Boulanger & Krebs Reference BOULANGER and KREBS1996) as well as in many case studies (Hammond & Anthony Reference HAMMOND and ANTHONY2006, Karanth & Nichols Reference KARANTH and NICHOLS1998). Although we favour much the use of population-size estimates from closed-population models to estimate abundance, for comparative purposes we also calculated the Minimum Numbers Known Alive (MNKA, Krebs Reference KREBS1966) given that MNKA have been frequently used in the past in the small mammal literature. For the other demographic parameters (survival and seniority probability), we used an open model approach, focusing only on whether or not an animal had been captured at least once at each of the 21 PTSs (Nichols et al. Reference NICHOLS, HINES, LEBRETON and PRADEL2000). Statistical analyses were thus carried out following Lebreton et al. (Reference LEBRETON, BURNHAM, CLOBERT and ANDERSON1992) with the joint estimation of a demographic parameter, survival or seniority probability (denoted respectively φ and γ), and a detection probability (denoted respectively in survival and seniority analysis p and r). Specifically, seniority probabilities, which are demographic parameters inversely linked to recruitment, were estimated from reverse-time capture-recapture analysis as detailed in Nichols et al. (Reference NICHOLS, HINES, LEBRETON and PRADEL2000). For both demographic parameters, the fit of a general model was assessed and found satisfactory and then a model selection was carried out from this general model. Goodness-of-fit (GOF) tests were carried out using UCARE (programme freely downloadable at http://www.cefe.cnrs.fr/BIOM/logiciels.htm). We mainly considered two components of the tests provided by UCARE: test 2.CT and test 3.SR. Test 2.CT detects trap-dependence, i.e. whether or not the probability of recapture of an individual depends upon its previous capture history. Test 3.SR focuses on transience, i.e. the fact that some individuals will pass once through the sampling design and thus never be recaptured (Pradel et al. Reference PRADEL, GIMENEZ and LEBRETON2005). Because GOF tests revealed trap-happiness in the data, we used as a general model a model including trap-happiness with full-time variation in survival or seniority probability and in the two probabilities of recapture (Gimenez et al. Reference GIMENEZ, LEBRETON and CHOQUET2003). Because this kind of model, with full-time variation, is known to be beset by serious identifiability problems (Pradel Reference PRADEL, Lebreton and North1993), we attempted first to reduce the full-time variation in recapture probabilities either to simpler models with seasonal and annual variation or no temporal variation at all. In a second step, we ran four models of temporal variation in survival or seniority (a two-way interaction model between season and year, a model with additive seasonal and annual variation, a model with seasonal variation only and a model with annual variation only) crossed with five recapture models (same temporal variation as for survival probability plus an additive trap-happiness effect). To sum up, the set of candidate models had 28 models for each analysis and they are listed in Appendix 1. Following Burnham & Anderson (Reference BURNHAM and ANDERSON1998), all models were ranked by Akaike's Information Criterion corrected for small sample size (AICc): the better the model, the smaller the criterion. As recommended by Burnham & Anderson (Reference BURNHAM and ANDERSON1998), for each model we calculated the difference in AICc from the model with the lowest AICc score (noted ΔAICc), the Akaike weights (noted AICc weights) and considered all models with ΔAICc ≥ 10 as essentially not supported by the data. Further, as a rule of thumb, two models with ΔAICc < 2 are not distinguishable on statistical grounds. In this case, for the sake of parsimony, we considered best the model with the fewest parameters. We used analyses of deviance to test for the effects of external covariates (ANODEV, Skalski et al. Reference SKALSKI, HOFFMANN, SMITH, Lebreton and North1993). All models were fitted in Mark 4.2 (White & Burnham Reference WHITE and BURNHAM1999). All estimates of demographic parameters come with 95% confidence interval support limits between parentheses.
Biological covariates
Because we wanted to investigate the impact of the annual flood of the River Niger on the demography of M. erythroleucus, we considered the variable year as starting just around the maximum of the flood (usually in late September). Additionally, we divided the year into a dry season and a rainy season.
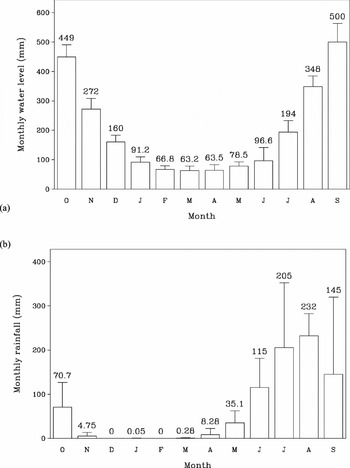
Two extrinsic covariates representing different hypotheses about the functioning of the Mastomys population were used. First, in arid and semi-arid environments, rainfall has typically been used as a surrogate measurement for primary production generally thought to be connected with both food and shelter availability for small mammals (Brown & Singleton Reference BROWN and SINGLETON1999, Holmgren et al. Reference HOLMGREN, STAPP, DICKMAN, GRACIA, GRAHAM, GUTIÉRREZ, HICE, JAKSIC, KELT, LETNIC, LIMA, LÓPEZ, MESERVE, MILSTEAD, POLIS, PREVITALI, RICHTER, SABATÉ and SAQUEO2006, Hubert Reference HUBERT1982). Rainfall is known to have a marked effect on Mastomys reproduction for several species and countries (Leirs Reference LEIRS1995, p. 73) and Julliard et al. (Reference JULLIARD, LEIRS, STENSETH, YOCCOZ, PREVOT-JULLIARD, VERHAGEN and VERHEYEN1999) have recently reported a close connection between survival and rainfall for M. natalensis in Tanzania. Thus we used the cumulative rainfall measured in a given time interval between two trapping sessions (cumr) to explain the temporal variation in both survival and seniority probabilities. We expected a positive relationship between survival and rainfall and a negative relationship between seniority and rainfall (the more rainfall, the greater recruitment). Monthly rainfall data were recorded at Bamako (40 km from our study site). Second, we used the daily water level of the River Niger (wl) recorded at Koulikoro (70 km downstream from our study site) averaged over time intervals separating two consecutive PTSs to assess the impact of the flood on demographic parameters (Figure 2). We expected an inverse relationship between survival and water level (higher water levels mean lower survival because of flooding) and a direct relationship between seniority and water level (higher water levels mean lower recruitment).
Variation of monthly water level (1999–2005) at Koulikoro (a) and rainfall at Bamako (2000–2003) (b). Numbers and bars on top of each bar display respectively the mean and the upper confidence limit at 95%.

Finally, given the importance of density-dependence relationships previously described in small mammals in general and Mastomys in particular, we used the estimates of abundance from closed-population models (abund) to explore the relationships between abundance and seniority or survival. We had no a priori expectations about the relationship between abundance and survival because both direct and inverse relationships have been reported in Mastomys, depending for instance on functional categories (Julliard et al. Reference JULLIARD, LEIRS, STENSETH, YOCCOZ, PREVOT-JULLIARD, VERHAGEN and VERHEYEN1999), but we expected rather a direct relationship in seniority as parameters linked to recruitment like maturation rates of females were indeed shown to decrease with density (Julliard et al. Reference JULLIARD, LEIRS, STENSETH, YOCCOZ, PREVOT-JULLIARD, VERHAGEN and VERHEYEN1999, Leirs Reference LEIRS1995, Sluydts et al. Reference SLUYDTS, CRESPIN, DAVIS, LIMA and LEIRS2007). We refrained from performing a test of delayed density dependence because unfortunately we could not come up with any clear working hypothesis in our system. All covariates were standardized to help convergence (White & Burnham Reference WHITE and BURNHAM1999).
RESULTS
Basics
Out of 915 individuals marked (496 males), 155 individuals were caught in at least two different PTSs (2 PTSs: 129, 3 PTSs: 20, 4 PTSs: 5 and 5 PTSs: 1). Fifty-three per cent of individuals were never recaptured (i.e. even within a given PTS). The effective sample size, i.e. the number of captures and recaptures minus the number of captures at the last PTS, was 873 in the data set used for the survival analysis and 1068 in the data set used for the seniority analysis.
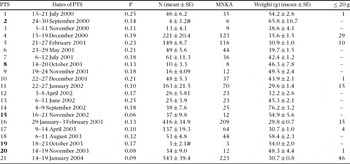
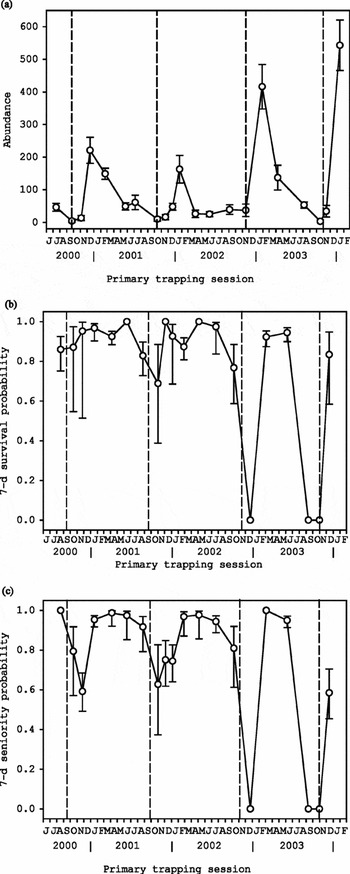
Even if average capture probabilities estimated from model Mh were relatively low (mean = 0.16, 95% CI = 0.13–0.19), estimates of population size were correct on the whole as shown by the reasonably small associated standard errors (Table 1, Figure 3). PTSs 2 and 19, where there was no recapture at all, are the two exceptions to this pattern. Population sizes varied greatly between years and within a given year (Figure 3). However, maximum numbers were generally reached in December–January (i.e. during the first part of the dry season) and minimum numbers in September–October (i.e. at the end of the rainy season). The average individual weight of the population displayed similar seasonal variations with a low around January and a high around September. Except for one individual captured in July 2000 and four individuals captured in April 2003, young individuals appeared only at trapping sessions from November to February, with most individuals found in January.
Trapping schedule and estimates of abundance at each primary trapping session. PTS = primary trapping session; # : no recapture at this PTS; p = probability of capture estimated from closed population models; N = population size estimated from closed population models (Mh with the jack-knife estimator) and the associated standard error; MNKA = Minimum Number Known Alive. Column labelled ‘Weight’ gives the average weight and associated standard error in grams of all individuals caught at the PTS. Column labelled ‘≤ 20 g’ gives the number of individuals whose weight was inferior or equal to 20 g at each PTS (− = means no capture of this kind of individual). The trapping session the closest to the maximum of the flooding is indicated in bold for each year.

Estimate of abundance (a), survival (b) and seniority probabilities (c) with their 95% confidence limits (ticks). Abundance was estimated from model Mh. Survival and seniority probability estimates are from the best models and standardized to 7 d. A few points are on the boundary of the parameter space (i.e. equal to 0 and 1) and consequently no confidence intervals are displayed since standard likelihood theory cannot provide sensible estimates of standard errors for parameter estimates lying on a boundary. Vertical dashed bars represent for each year the maximum intensity of the flooding events measured at Koulikoro, a site 70 km downstream from our study site.

GOF tests and the general model
For both survival and seniority analyses, test 2.CT was the only significant component, indicating trap-happiness: the probability of recapture was higher if the individual had already been captured at the previous trapping session than if it had not been (test 2.CT: z = −1.99, P = 0.046). Thus we used as a starting point for model selection a general model including trap-happiness (denoted φ(t) or γ(t) p(m × t), Appendix 1). The model fitted the data satisfactorily (χ2 = 9.5, df = 10, P = 0.48).
Model selection for capture-recapture data
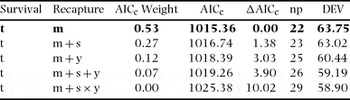
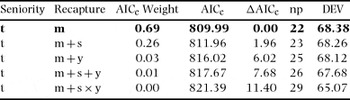
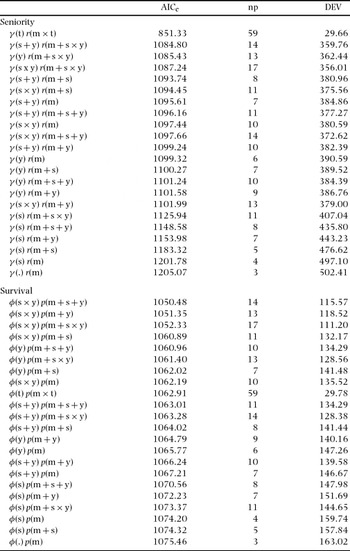
Model selection was similar for both survival and seniority probability, and three points are worth commenting on: (1) Reducing the full-time variation in recapture probabilities considerably improved the fit of the model (from the general model, AICc decreased by a minimum of 30 units, Appendix 1). However, there was some uncertainty about temporal variation in recapture probabilities as low-ranked models differed only slightly by their recapture modelling (Tables 2 and 3). (2) Models including trap-happiness reached significantly lower AICc values than other models without trap-happiness (ΔAICc = 2.2 and 5.5, for seniority and survival analysis, respectively). In the survival analysis, the probability of recapture for the individuals trapped at the previous primary session was 0.427 (0.299–0.565) vs. 0.164 (0.057–0.389) for those individuals not trapped at the previous primary session. In the seniority analysis, the probabilities of recapture were 0.560 (0.465–0.652) vs. 0.342 (0.166–0.574), respectively. (3) It was not possible to reduce the full-time variation in survival without altering the fit of the model significantly: the first model with reduced temporal variation, namely s × y, for survival as well as for seniority, differed by more than 32 units from the lowest AICc model. Thus both survival and seniority probabilities varied greatly over the study, offering a unique opportunity to test for the effect of covariates (Figure 3).
Models in survival probabilities ranked by AICc. Only the first five models run are displayed; however other models run were essentially not supported by the data (ΔAICc ≥ 10, Burnham & Anderson Reference BURNHAM and ANDERSON1998). Best model is shown in bold. AICc = Akaike's Information Criterion; ΔAICc = difference in AICc with the score of best model; AICc Weight = Akaike's weight; DEV = deviance; np = number of identifiable parameters; m = trap-happiness effect; t = full-time variation; s = seasonal variation; y = annual variation.

Models in seniority probabilities ranked by AICc. Only the first five models run are displayed; however other models run were essentially not supported by the data (ΔAICc ≥ 10, see Burnham & Anderson Reference BURNHAM and ANDERSON1998). Best model is shown in bold. AICc = Akaike's Information Criterion; ΔAICc = difference in AICc with the score of best model; AICc Weight = Akaike's weight; DEV = deviance; np = number of identifiable parameters; m = trap-happiness effect; t = full-time variation; s = seasonal variation; y = annual variation.

Season and water level explained 51% of the temporal variation in survival probabilities (F(2, 17) = 8.90, P = 0.0023). The slope of water level was negative, meaning that survival probabilities decreased when water level increased, as we expected (β(wl) = −0.72 (−1.00; −0.45). We interpret this inverse relationship in terms of the impact of the overall flooding of the area as it is hard to believe that day-to-day variation in water level can reduce local survival of rodents. Abundance was not confirmed as having a significant effect on survival probabilities (ANODEV P > 0.10). Conversely, 86% of the temporal variation in seniority probabilities was explained by a model with season, water level, abundance and their interaction (F(4, 15) = 22.5, P = 3.4 × 10⁻⁶). The interaction was negative and significant, meaning that the seniority probabilities varied with both water level and abundance values (β(abund) = 0.74 (−1.03; 2.52); β(wl) = −1.73 (−2.82; −0.64); β(abund.wl) = −2.56 (−4.86; −0.27). Lastly, the effect of cumulative rainfall was not confirmed in either the survival or the seniority probabilities (ANODEV all P > 0.10).
DISCUSSION
Recapture probability
Our results showed significant trap-happiness i.e. the probability of recapture varied with each individual's capture history (Pradel Reference PRADEL, Lebreton and North1993). In terms of behaviour, one might argue that, because previously caught individuals have learned that traps contain food, they will actively seek to enter the traps again so raising their probability of recapture compared with individuals not having experienced trapping. This hypothesis has been suggested for two Chilean populations of the leaf-eared mouse Phyllotis darwini, which inhabits semi-arid environments (Crespin & Lima Reference CRESPIN and LIMA2006, Lima et al. Reference LIMA, STENSETH, LEIRS and JAKSIC2003), and there is some evidence indeed that food availability impacts trapping in small mammals (Adler & Lambert Reference ADLER and LAMBERT1997). However, given that the time intervals between two consecutive PTSs can be several months long, a more extensive study is needed to confirm that this trap-happiness is the consequence of a behavioural shift of the individuals rather than a mere consequence of heterogeneity of capture (Kendall et al. Reference KENDALL, POLLOCK and BROWNIE1995, Pradel Reference PRADEL, Lebreton and North1993).
Survival and seniority probabilities
Although the trapping sessions were not regularly spaced in time in our study, our results indicate that the breeding season of M. erythroleucus generally starts at the end of the wet season and extends into the beginning of the dry season, which is consistent with other studies of murine rodents in Senegal (Granjon Reference GRANJON1987, Hubert Reference HUBERT1982). This seasonality has far-reaching consequences for M. erythroleucus population dynamics as shown by the fluctuations in abundance observed each year in our data (Figure 3). However, the model selection failed to retain seasonality: for seniority and survival probabilities alike, the best models were indeed full-time dependent models while seasonal models were not supported by the data. This may be because the data encompass only 4 y and because, with three estimates out of seven equal to zero for both seniority and survival probabilities, the last 2 y did not yield much information about seasonality. We believe that, with data for many more years, a model with only seasonal and annual variation would have proved the best model.
Although the best model did not include seasonality formally, it showed that, within a year, survival probabilities tended to be low after the flooding event and to rise thereafter. For instance, survival fell from 0.83 (0.73; 0.90) to 0.69 (0.39; 0.88) after the second flood, and then increased up to 1. Then, survival fell from 0.77 (0.59; 0.88) to 0 after the third flood and then rose to 0.94 (0.90; 0.97). Similarly, survival increased from 0 to 0.83 (0.58; 0.95) after the fourth flood. Given that (1) the survival probabilities estimated here were for local survival (i.e. that permanent emigration out of the study zone is equivalent to death), that (2) M. erytholeucus can swim a little (Duplantier & Bâ Reference DUPLANTIER, BÂ, Denys, Granjon and Poulet2001), that (3) the differences in survival, before and after the spate, were high, and that (4) local survival fell as a function of mean water level in our study, we believe that this drop in survival was mainly due to emigration out of the flooded areas. Even so, it is likely some rodents either drowned or starved to death (Anderson & Shapiro Reference ANDERSON and SHAPIRO1957, Batzli Reference BATZLI1977, Jacob Reference JACOB2003), particularly when all habitats were flooded for a relatively long time, which sometimes happened at our study site, e.g. in September 2001. Finally, it is likely that the individuals recolonizing new habitats when the flood abated were old as suggested by the relatively high average individual weight at the trapping sessions close to the spate; this observation is consistent with the results of Hubert (Reference HUBERT1982) who, using lens-weight data, described a Senegalese population of M. erythroleucus as old on average at the end of the rainy season. Thus it is logical that, in our survey, survival tended to decline after the spate compared with before. The subsequent increase in survival is associated with the production of the new generation, accompanying the vegetation growth triggered by rainfall (representing food and shelter for rodents).
There was no relationship between survival or seniority and rainfall, contrary to our expectations. However, we note that rainfall may have direct and delayed effects on survival in the same functional category of M. natalensis and further that these effects impact functional categories in a different way (Julliard et al. Reference JULLIARD, LEIRS, STENSETH, YOCCOZ, PREVOT-JULLIARD, VERHAGEN and VERHEYEN1999). Lima et al. (Reference LIMA, JULLIARD, STENSETH and JAKSIC2001) have shown that rainfall may produce opposing effects across different demographic parameters, e.g. maturation rate and recruitment rate of females for Phyllotis darwini, a small rodent inhabiting semi-arid environment in central Chile. Thus the occurrence of more complex relationships than the linear effect on pooled males and females we have tested may explain why we were unable to pick up a signal with rainfall in our 4-y study.
As for seniority probabilities, best model estimates displayed marked seasonal variation. Values of seniority probabilities reached a relatively brief low around November–December (in 2000 the low reached 0.59 (0.49; 0.68) and in 2001 0.63 (0.37; 0.83) as already noted by Hubert (Reference HUBERT1982) for same species in Senegal. Further, the temporal variation in seniority probabilities was largely explained by a model with season and a negative interaction between abundance and water level, suggesting, in terms of recruitment, that the number of new individuals in the rodent population (i.e. emigration + local reproduction) is indeed impacted by the River Niger but not directly as we first expected, but indirectly depending on both abundance and water-level values. Keeping in mind that water-level variation means that greater or lesser tracts of land are flooded, it is likely that the variation in recruitment in our study is mediated by intraspecific competition for food or refuge during the flood. Low recruitment values generally correspond to high abundance values and low water-level values (five cases out of seven with γ > 0.99) whereas high recruitment values are attained for low abundance values and moderate water-level values (three cases out of four with γ < 0.66). A simple interpretation of these features is that high abundances mean intense intraspecific competition (and so low recruitment) and that high water levels lead to a concentration of individuals on unflooded land (and so high recruitment). The negative interaction between abundance and water level is consistent with the recent work of Sluydts et al. (Reference SLUYDTS, CRESPIN, DAVIS, LIMA and LEIRS2007) which has shown that, in Tanzanian M. natalensis, female maturation, i.e. the recruitment of adults from the pool of subadult individuals, depends on negative interaction between abundance and rainfall. How can these similar density-dependent relationships be explained? Many authors have already reported that either recruitment or dispersal is impeded at high densities in small-mammal populations (Aars & Ims Reference AARS and IMS2002, Desy et al. Reference DESY, BATZLI and LIU1990, Ostfeld & Canham Reference OSTFELD and CANHAM1995). Further, Prevôt-Juliard et al. (Reference JULLIARD, LEIRS, STENSETH, YOCCOZ, PREVOT-JULLIARD, VERHAGEN and VERHEYEN1999), for a population of Finnish bank voles (Myodes glareolus), a species in which breeding females are known to defend a territory (Bondrup-Nielsen & Ims Reference BONDRUP-NIELSEN and IMS1986), have reported that recruitment of new breeding females is negatively correlated with the density of already established females and so is probably mediated by territorial competition among breeding females. However, as Mastomys does not seem territorial or even aggressive (Leirs Reference LEIRS1995 but see Granjon & Duplantier Reference GRANJON and DUPLANTIER1993), it is still not clear what the behavioural mechanisms are behind the density-dependence observed in Mastomys. An alternative explanation is that, when water levels are high, small mammals may be concentrated in a few areas that attract predators (the ‘pantry’ effect, Batzli Reference BATZLI1983, Meserve et al. Reference MESERVE, MILSTEAD and GUTIÉRREZ2001) and/or in which predators consume more individuals. The abundance of small mammals may thus be lowered much by predation, which may in turn favour a high recruitment of small mammals. Conversely, when water levels are moderate, rodents may have more space to escape from predators and so small mammals may be more abundant. Note that Julliard et al. (Reference JULLIARD, LEIRS, STENSETH, YOCCOZ, PREVOT-JULLIARD, VERHAGEN and VERHEYEN1999) reported a direct density-dependent relationship in survival of Mastomys natalensis that they interpreted as the outcome of predation. More generally, predation is thought to have a major impact on small-mammal population dynamics (Ims & Andreassen Reference IMS and ANDREASSEN2000, Lima et al. Reference LIMA, JULLIARD, STENSETH and JAKSIC2001, Madsen et al. Reference MADSEN, UJVARI, SHINE and OLSSON2006, Stenseth Reference STENSETH1999). More work, especially manipulations and/or experiments, is needed to understand the factors shaping density-dependence in Mastomys.
CONCLUSION
Our results showed that demography of M. erythroleucus is strongly impacted by the River Niger, i.e. an extrinsic factor, as both survival and seniority probabilities were affected by its floods. Seniority probabilities also varied with the number of individuals in the population, i.e. an intrinsic factor. More broadly, our results are consistent with the functioning of population described for other rodent species in semi-arid habitats, e.g. M. natalensis in Tanzania (Julliard et al. Reference JULLIARD, LEIRS, STENSETH, YOCCOZ, PREVOT-JULLIARD, VERHAGEN and VERHEYEN1999, Sluydts et al. Reference SLUYDTS, CRESPIN, DAVIS, LIMA and LEIRS2007) or Phyllotis darwini in Chile (Lima et al. Reference LIMA, JULLIARD, STENSETH and JAKSIC2001) with a strong impact on demographic rates of both intrinsic and extrinsic factors, such as rainfall and/or predation (owls). More work over a longer period of population monitoring is now needed to better understand the interplay between these different factors, in order to anticipate the potential population changes due to climatic forcing, mediated by the impact of the River Niger.
ACKNOWLEDGEMENTS
The authors want to thank S. Ag'Atteynine, E. Quesseveur and the students from IPR of Katibougou (C. Diop, M. Coulibaly, S. Traoré, I. Diarra, M. Camara) for assistance in the field. The authors are grateful to N. Muther, A. Dezetter and L. Ferry (IRD Bamako) for kindly providing the data about the water level of the River Niger and D. Y. Alexandre (IRD Bamako) for the vegetation analysis. Rob Klinger and two anonymous reviewers improved the manuscript with their comments.
Set of models run for the seniority (γ) and the survival (φ) analysis. This appendix displays only the models not presented in Tables 2 and 3. Models are ranked by the Akaike Information Criterion. For both the seniority and the survival analysis, all models had an Akaike's weight equalling zero. Detection probabilities for each analysis were respectively denoted as r and p. AICc = Akaike information criterion corrected for small sample sizes; np = number of identifiable parameters; DEV = deviance; m = trap-happiness effect; t = full-time variation; s = seasonal variation; y = annual variation;. = no variation (intercept-only model).