





1 Introduction
The fundamental understanding of vortex breakdown and jet interaction mechanisms in coaxial swirling flow is of high practical value in many engineering applications (Gupta, Lilley & Syred Reference Gupta, Lilley and Syred1984). Vortex breakdown is a common feature in swirling flows, which will occur if the ratio of azimuthal to axial velocity exceeds certain threshold limit (Benjamin Reference Benjamin1962; Hall Reference Hall1972). The type and mechanism of vortex breakdown in swirling flows are usually characterized by a non-dimensional parameter named the swirl number (
 $S$
), which theoretically represents the flux ratios between tangential and axial momentum. In general, swirl number
 $S\geqslant 0.6$
is interpreted as a strong swirling jet; the flow beyond this threshold is known to exhibit vortex breakdown (Benjamin Reference Benjamin1967).
Insights into the evolution of swirling flows at various spatio-temporal scales is extremely important in modern-day gas turbine combustors to optimize the design (Lefebvre Reference Lefebvre1998), suppress combustion instability and enable robust flame holding. In these combustors, fuel is injected continuously either in the form of a liquid spray or gaseous jet in the highly turbulent coaxial swirling flow. The high momentum associated with coaxial swirling flow results in significant energy transfer to the injected fuel jet (Rajamanickam, Roy & Basu Reference Rajamanickam, Roy and Basu2018) (also known as a secondary jet). During this momentum transfer process, the complex instability modes associated with swirl flows are also imposed over the secondary jets (Rajamanickam & Basu Reference Rajamanickam and Basu2017a ). The resultant jet–jet interaction mechanism is a key parameter in determining the spatio-temporal fluctuations in mixing, combustion efficiency and emission in combustors. Unlike coaxial round jets, in swirling flows, the presence/dominance of momentum in the azimuthal direction leads to a phenomenon called ‘vortex breakdown’. It is well known that the persistence of vortex breakdown induces several complicated instabilities (helical, centrifugal shear etc.) in the flow field (Cassidy & Falvey Reference Cassidy and Falvey1970; Gallaire & Chomaz Reference Gallaire and Chomaz2003a ). Several experimental and numerical works have been carried out to precisely represent the forms of vortex breakdown in such flows (Harvey Reference Harvey1962; Spall, Gatski & Grosch Reference Spall, Gatski and Grosch1987; Lopez Reference Lopez1990).
Although various types of vortex breakdown (single, double helical, axisymmetric bubble) have been reported, all exhibit a universal behaviour of stagnation point formation in the near field of the nozzle (Harvey Reference Harvey1962). Furthermore, this phenomenon gives rise to deceleration of injected flow which ultimately leads to flow reversal towards the burner exit. In addition, a special form of breakdown named the ‘conical sheet’ type breakdown is witnessed by Billant, Chomaz & Huerre (Reference Billant, Chomaz and Huerre1998) and Santhosh, Miglani & Basu (Reference Santhosh, Miglani and Basu2014) in their coaxial swirling jet experiments. Both authors have mentioned that the conical form of breakdown is highly unstable and appeared only over a very short range of swirl numbers. Billant et al. (Reference Billant, Chomaz and Huerre1998) also showed the hysteresis associated with conical breakdown pathways.
Among all types of vortex breakdown, the bubble type is found to be more relevant in gas turbine combustors (Gupta et al. Reference Gupta, Lilley and Syred1984; Escudier & Keller Reference Escudier and Keller1985; Lucca-Negro & O’doherty Reference Lucca-Negro and O’doherty2001). However, the bubble type of breakdown is accompanied by the formation of a precessing vortex core (PVC) which ultimately induces helical disturbances in the flow (Loiseleux, Chomaz & Huerre Reference Loiseleux, Chomaz and Huerre1998). Furthermore, PVC is known to greatly influence reactant mixing, flame propagation and ignition due to the time-varying nature of stagnation point in the near field (Stöhr, Arndt & Meier Reference Stöhr, Arndt and Meier2013, Reference Stöhr, Arndt and Meier2015). Wang et al. (Reference Wang, Rusak, Gong and Liu2016) showed that helical breakdown can even appear in bubble type breakdown due to global three-dimensional instability. The theoretical analysis proposed by Chakraborty, Balachandar & Adrian (Reference Chakraborty, Balachandar and Adrian2005) and Meliga, Gallaire & Chomaz (Reference Meliga, Gallaire and Chomaz2012) also reveals that the essential feature of bubble type vortex breakdown (VB) is manifested by the presence of helical structures. In addition, the counter-rotating vortices arising from bubble breakdown induces strong precessing of helical structures. This phenomenon results in the formation of three-dimensional complicated coherent structures (Cala et al. Reference Cala, Fernandes, Heitor and Shtork2006).
The identification and quantification of the dynamics associated with such coherent structures induced by VB are of ceaseless interest in swirling flows. Most of the earlier investigations adopt flow visualization techniques to delineate the VB mechanisms in swirl flows. For instance, Sarpkaya (Reference Sarpkaya1974) and Faler & Leibovich (Reference Faler and Leibovich1977) employed dye based flow visualization methods to qualitatively understand the spatially evolving structures in swirl flows as manifested by different VB modes. Though flow visualization techniques qualitatively addressed the spatial structures as a function of swirl strength, they fail to predict the temporal dynamics of VB modes. In late 1990s, the development of laser diagnostic techniques enabled researchers to gain more insights into hydrodynamic instabilities. Among these, particle tracking/image velocimetry (PTV/PIV) received greater attention because of their planar measurement capabilities. The advent of data reduction techniques such as POD (proper orthogonal decomposition), DMD (dynamic mode decomposition) offered powerful tools towards extracting the relevant dynamical features of the flows.
Oberleithner et al. (Reference Oberleithner, Sieber, Nayeri, Paschereit, Petz, Hege, Noack and Wygnanski2011) implemented POD techniques over instantaneous velocity fields to delineate energetic spatial structures. His results showed the occurrence of helical disturbances in the flow. Later, Markovich et al. (Reference Markovich, Abdurakipov, Chikishev, Dulin and Hanjalić2014) employed POD and DMD methods to identify the dominant structures in weak and strong swirling flames in a combustor. Tilted helical and co-winding helical vortices are identified as dominant coherent structures in the weak and strong swirling jet respectively. In addition, their temporal analysis showed that the flow is highly dominated by global helical disturbances with a frequency of
 ${\sim}233~\text{Hz}$
. Wilson, Mejia-Alvarez & Prestridge (Reference Wilson, Mejia-Alvarez and Prestridge2015) and Roy et al. (Reference Roy, Yi, Jiang, Gunaratne, Chterev, Emerson, Lieuwen, Caswell and Gord2017) have also attempted to use POD, DMD techniques to identify the mechanism likely to govern the flame dynamics in swirl flows. For instance, Roy et al. (Reference Roy, Yi, Jiang, Gunaratne, Chterev, Emerson, Lieuwen, Caswell and Gord2017) employed modal analysis on simultaneous time-resolved PIV/planar laser induced fluorescence (PLIF) data to identify the dynamics modes in highly turbulent swirling flames. Their analysis revealed a dominant PVC frequency around
 ${\sim}800~\text{Hz}$
. Subsequently, the spatial modes pertaining to this frequency were identified as helical modes.
1.1 Scope of the work
The literature survey briefly discussed in the previous section clearly shows a lack of understanding of the dynamics of vortex breakdown in swirling flows. In particular, conical breakdown, which is considered to be a highly unstable state in coaxial swirling flows, has not been explored in great details. This conical breakdown mode is significant since in real life combustors it can affect adversely the flame holding capacity leading to sudden blowoff events. Particularly for aeropropulsion, such blowoff events can be catastrophic.
Although globally vortex breakdown has been analysed by several classical works (Benjamin Reference Benjamin1962; Leibovich Reference Leibovich1978; Billant et al. Reference Billant, Chomaz and Huerre1998; Gallaire & Chomaz Reference Gallaire and Chomaz2003b ), the underlying mechanisms which governing the temporal dynamics are still not clear. In this study, an attempt has been made to understand the dynamics of various forms of vortex breakdown in coaxial swirl flows using high fidelity time-resolved laser diagnostics. Furthermore, in most of the studies, experiments are performed either only with swirl jets or coaxial jets with fixed swirl number (such as vane swirlers). To address this research gap, in the present study, the experimental set-up is designed in such a way as to vary co-annular jet and swirl jet in an independent manner. This arrangement ensures that a much wider parameter space can be easily studied. Lastly, the mechanism of conical breakdown and the precursor events leading to such events have been explored rigorously across a large experimental space.
The present investigation shown in this paper is structured as follows.
In § 2, we explain the experimental configuration, details of the optical diagnostic tools and their arrangement. In addition, the flow conditions and non-dimensional numbers are also shown. The global evolution of the time-averaged flow as a function of various swirl numbers
 $(S)$
for fixed co-annular Reynolds number is presented in § 3. This includes experiments carried out across
 $y{-}r$
and multiple
 $r{-}\unicode[STIX]{x1D703}$
planes. Subsequently, § 4 describes the POD analysis performed to extract the dominant spatial and temporal modes. The dominant spatial structure pertaining to each flow condition is delineated as a percentage of turbulent kinetic energy. It enables us to interpret the possible governing mechanisms associated with each VB mode. In particular, we focus our attention on the analysis of conical breakdown. In § 4.2, we discuss the dominant unstable modes perceived from frequency ranked DMD analysis. Here, comparative interpretation between POD and DMD modes is also presented. Finally, the hysteresis associated with conical breakdown across various co-annular flow Reynolds numbers are discussed in greater details in § 4.4.
In our previous studies (Santhosh, Miglani & Basu Reference Santhosh, Miglani and Basu2013; Santhosh et al.
Reference Santhosh, Miglani and Basu2014; Santhosh & Basu Reference Santhosh and Basu2015), the global evolution of the resultant flow structure across various swirl numbers has been reported in great detail. However, being a low-speed measurement (
 ${\sim}5~\text{frames}~\text{s}^{-1}$
), the dynamics pertaining to each flow mode is not addressed rigorously. Whereas, in the present study time-resolved PIV (
 ${\sim}1500~\text{frames}~\text{s}^{-1}$
) enables us to delineate the various VB modes in a more insightful manner. For example, we are able to answer questions such as what causes the flow to undergo conical breakdown from the bubble mode along with the precursor events? In addition, experiments have been carried out at higher Reynolds numbers to evaluate the hysteresis associated with various VB modes.
2 Experimental conditions and procedure
The schematic of the swirl stabilized burner utilized in this study is shown in figure 1. The set-up consists of coaxial annular and tangential air passages. In this study, the swirl is imparted to the air flow with the help of tangential inlets provided at the burner exit. Here, an even number of tangential slots (a total of 8) has been used to ensure uniform distribution of swirling flow. Further information pertaining to the geometrical details of the burner can be found in Santhosh et al. (Reference Santhosh, Miglani and Basu2013, Reference Santhosh, Miglani and Basu2014).
Schematic of experimental set-up.

Air flow rate across all the passages has been metered using a thermal mass flow controller (make: M/s. Alicat, Inc). Two layers of honeycombs are placed in the co-annular pipe to condition the flow before it reaches the burner exit.
2.1 Measurement methodology
Time-resolved PIV
It is well known that the inherent instabilities present in swirl flow lead to complex coherent structures. It is hence mandated to employ time-resolved measurements to understand the flow dynamics. In general, experimental techniques like hot-wire anemometry (HWA), laser Doppler velocimetry (LDV) are more powerful in terms of dynamic (temporal) response (usually
 ${\sim}20{-}50~\text{kHz}$
). However, being point measurement techniques, their usages are limited to local measurements. Hence, planar measurements like PIV are usually preferred to resolve the large spatial scales. In this study, time-resolved PIV is employed to meticulously analyse the spatio-temporal characteristics of the swirling flow field.
Schematic showing the optical arrangements of PIV system (a)
 $y{-}r$
plane; (b)
 $r{-}\unicode[STIX]{x1D703}$
plane; (c) out of plane motion in an
 $r{-}\unicode[STIX]{x1D703}$
plane; (d) optimal displacement of particles across two frames in an
 $r{-}\unicode[STIX]{x1D703}$
plane.

A high repetition rate (
 ${\sim}10~\text{kHz}$
; make: Photonics Inc.) dual pulsed Nd:YLF laser with a pulse energy of
 $30~\text{mJ}~\text{pulse}^{-1}$
is used as an illumination source. The cylindrical beam of the laser output is converted into a thin sheet (
 ${\sim}1~\text{mm}$
) using sheet making optics. This optics comprises two telescopic lenses and one cylindrical lens. The purpose of the telescopic lens is to adjust the beam diameter thereby the light sheet thickness. The aperture angle
 $(\unicode[STIX]{x1D6FC})$
of the sheet is controlled by the focal length (
 $f$
) of the cylindrical lens. In this study, ‘
 $f$
’ is chosen as 10 mm to ensure proper illumination of the required field of view.
The flow has been seeded with diethyl hexyl sebacate oil (DEHS) as tracer particles. The size of the particles is chosen as
 ${\sim}1{-}3~\unicode[STIX]{x03BC}\text{m}$
to maintain better tracing accuracy (i.e. Stokes number,
 $St\ll 1$
). The seeded flow is illuminated with the laser and the light scattered by the oil particles is recorded with a high-speed camera (make: Photonics Inc;
 $7000~\text{frames}~\text{s}^{-1}$
at the full resolution of
 $1024~\text{pixel}\times 1024~\text{pixel}$
). The laser pulse and camera shutter are synchronized using a programmable timing unit (PTU) to yield the time frozen snapshots. Furthermore, an optical bandpass filter of 527 nm is coupled with a camera lens to avoid noisy scattered signals from the ambient. The camera is operated in double frame mode with the optimal time delay ‘
 $\text{d}t$
’ between two frames.
In this study, PIV is done in the
 $y{-}r$
as well as the
 $r{-}\unicode[STIX]{x1D703}$
plane. For
 $y{-}r$
plane measurements the laser sheet is aligned with the longitudinal plane of the burner (see figure 2
a). The laser sheet is flipped to horizontal orientation and aligned parallel to the burner exit (figure 2
b). This facilitates measurements at different
 $y/d$
locations. In both cases, the camera is positioned orthogonal to the plane of illumination. During
 $r{-}\unicode[STIX]{x1D703}$
measurements, the plane of illumination is projected towards the overhead mirror which is oriented at
 ${\sim}45^{\circ }$
with respect to the vertical stand (see figure 2
b). A Scheimpflug adapter is coupled to the camera lens to enable fine adjustment between the image and lens planes without altering the camera position. Since the camera is viewing the plane in an oblique manner, it is necessary to correct for angular distortion. This is accomplished by employing a calibration plate with predefined spatial dots. The Scheimpflug adapter is finely adjusted to make sure all the dots in the calibration plate are clearly visible. It is common practice to select ‘
 $\text{d}t$
’ (pulse separation time in PIV) in such a way that the spatial displacement of the particle across the two frames should be less than
 $1/4$
of the interrogation window (IW) size. To evaluate the optimal ‘
 $\text{d}t$
’, experiments are started with zero displacement (i.e. a very low value say,
 ${\sim}6~\unicode[STIX]{x03BC}\text{s}$
), then
 $\text{d}t$
is slowly increased till
 ${\leqslant}1/4$
IW. In the present study, the final IW size is chosen to be
 $32~\text{pixel}\times 32~\text{pixel}$
for both
 $r{-}\unicode[STIX]{x1D703}$
and
 $y{-}r$
planes.
In particular, ‘
 $\text{d}t$
’ is chosen with special care for
 $r{-}\unicode[STIX]{x1D703}$
measurements, to ensure the detection of the same particle in the second frame since the strong axial velocity can lead to out of plane motion of the particles.
For instance, with
 $Re_{a}\sim 4896$
case, the maximum axial velocity
 $(U_{y})$
at the burner exit is found to be
 $1.7~\text{m}~\text{s}^{-1}$
. The maximum axial displacement of the particle for the chosen ‘
 $\text{d}t$
’ (i.e.
 $95~\unicode[STIX]{x03BC}\text{s}$
) is found to be
 ${\sim}0.095~\text{mm}$
(figure 2
c), which is much less than the laser sheet thickness
 ${\sim}1~\text{mm}$
. The corresponding values for
 $\mathit{Re}_{a}\sim 10\,545$
, 17 456 are found to be 0.11 mm, 0.19 mm respectively (all
 ${<}1~\text{mm}$
). In addition, the selected ‘
 $\text{d}t$
’ also satisfies the optimal displacement criteria (i.e.
 $\unicode[STIX]{x0394}r$
,
 $\unicode[STIX]{x0394}\unicode[STIX]{x1D703}<(1/4)IW$
;
 ${\sim}5~\text{pixel}$
; figure 2
d). The values of ‘
 $\text{d}t$
’ in the
 $r{-}\unicode[STIX]{x1D703}$
plane for
 $\mathit{Re}_{a}\sim 4896$
, 10 545, 17 546 are chosen as
 $95~\unicode[STIX]{x03BC}\text{s}$
,
 $50~\unicode[STIX]{x03BC}\text{s}$
,
 $25~\unicode[STIX]{x03BC}\text{s}$
respectively.
The same optimal pixel displacement criteria have been also extended to
 $y{-}r$
plane too (i.e.
 $\unicode[STIX]{x0394}r$
,
 $\unicode[STIX]{x0394}y<(1/4)IW$
). In the
 $y{-}r$
plane, the optimal ‘
 $\text{d}t$
’ for
 $Re_{a}\sim 4896$
, 10 545, 17 546 are chosen as
 $105~\unicode[STIX]{x03BC}\text{s}$
,
 $77~\unicode[STIX]{x03BC}\text{s}$
,
 $40~\unicode[STIX]{x03BC}\text{s}$
respectively.
Furthermore, the accuracy of the flow field perceived from PIV is greatly influenced by laser sheet thickness
 $(\unicode[STIX]{x1D6FF}_{t})$
, particle displacement across two frames
 $(ds)$
and number of particles (
 $N$
) per IW. The correctness of the above-mentioned parameters is validated by employing ‘correlation statistics’ method (Sciacchitano, Wieneke & Scarano Reference Sciacchitano, Wieneke and Scarano2013; Wieneke Reference Wieneke2015). This method attempts to evaluate the uncertainty in the measured velocity values
 $(u_{error})$
based on the positional disparity between the correlation peaks observed across the two frames. In the present study, the uncertainty in the measured velocity values is found to be
 ${\sim}\pm 1.3\,\%$
(
 $r{-}\unicode[STIX]{x1D703}$
) and 1 % (
 $y{-}r$
plane) of the local velocity values. More technical operational details involved in PIV like optimal seeding density,
 $\text{d}t$
, laser sheet thickness can found in Raffel et al. (Reference Raffel, Willert, Wereley and Kompenhans2013).
Further, we acknowledge that stereoscopic (three-dimensional) high-speed PIV may bring additional insights into the flow dynamics (especially in the
 $r{-}\unicode[STIX]{x1D703}$
plane). The three-dimensional (3-D) vector field can be confidently calculated only in the overlapped region of cameras 1 and 2 (Arroyo & Greated Reference Arroyo and Greated1991; Prasad & Adrian Reference Prasad and Adrian1993) using stereo or tomographic PIV. In the present work, the flow spread area is much higher (especially with conical breakdown) than the overlap area one can expect in stereo mode. Hence, we have not attempted stereoscopic PIV in this study due to equipment limitations. At the same time, the acquisition of all three component of velocities (
 $U_{r}$
,
 $U_{y}$
,
 $U_{\unicode[STIX]{x1D703}}$
) in simultaneous fashion improves the understanding of the problem. Since, the swirling flow is known to be highly three-dimensional flow, 3-D measurements may help to delineate the vortex breakdown mechanisms in a more insightful manner. In the present work, all three components of velocity have been acquired, but not in the same temporal space. In addition, 2-D PIV also ignores particles with strong out of plane motion leading to errors. The absence of tomographic PIV data is therefore considered a limitation in the present study. However, the same will be taken up in our future work. However, we have tried to keep the errors incurred due to 2-D PIV to a minimum (as explained previously).
Throughout the experiments, images are acquired at
 $1500~\text{frames}~\text{s}^{-1}$
with an acquisition time of 2 s (i.e. 3000 images are considered per each test case). For most of the
 $y{-}r$
measurements, the field of view (FOV) is chosen as
 $140~\text{mm}\times 140~\text{mm}$
with a spatial resolution of
 ${\sim}7.2~\text{pixels}~\text{mm}^{-1}$
. During
 $r{-}\unicode[STIX]{x1D703}$
measurements, the same is kept at
 ${\sim}280~\text{mm}\times 280~\text{mm}$
(
 ${\sim}3.65~\text{pixels}~\text{mm}^{-1}$
). It should be noted that for most of the near-field measurements (
 $y/R_{a}\leqslant 0.5$
), smaller field of view (
 ${\sim}180~\text{mm}\times 180~\text{mm}$
) is adapted to yield a high spatial resolution of
 ${\sim}5.68~\text{pixels}~\text{mm}^{-1}$
.
The acquired double frame PIV raw images are post-processed using Lavision 8.4 software to reconstruct the vector fields. For all the test cases, multipass interrogation windows (IW) with decreasing sizes are employed with initial and final window sizing being
 $48~\text{pixel}\times 48~\text{pixel}$
and
 $32~\text{pixel}\times 32~\text{pixel}$
respectively. In addition to this, adaptive PIV option is employed to enable auto calculation of window shape based on the gradient in the flow field.
2.2 Planar laser Mie scattering experiments (PLMS)
In addition to PIV measurements, a Nikon D7200 DSLR camera is used to perform a planar laser Mie scattering experiment. This experiment provides qualitative visualization of flow topologies at the burner exit across various operating conditions. Here, the optical arrangements are similar to the
 $y{-}r$
plane PIV measurements, except that the camera is operated in video grabbing mode. The flow is seeded with the same DEHS oil; the light scattered by the oil particles from the illuminated plane is recorded with the DSLR camera. It is important to note that a higher seeding density is employed to generate smoke-like flow visualization images. PLMS experiments are carried out only in the
 $y{-}r$
plane. Two macro lenses, 100 mm (make: Tokino) and 50 mm (make: Nikon), are used to image the near field and far field of the flow. With both lenses, videos are recorded at 30 f.p.s. (full HD 1080 p).
2.3 Flow conditions
The present study involves air flow across three different passages (A, B, C; see figure 1), hence it is necessary to define non-dimensional numbers to identify the parametric relationships among the different flow configurations. The experiment has been carried out at three sets of flow rates across annular (A) and central pipe (C) passages. At each set, the flow rate across tangential entry (B) is progressively varied to impart a different level of swirl intensity to the annular flow. The experimental test cases are globally characterized using three important non-dimensional numbers namely, the Reynolds number, momentum ratio and swirl number.
Reynolds number
 $(Re)$
can be defined as
 $$\begin{eqnarray}Re_{g}=\frac{\unicode[STIX]{x1D70C}_{a}U_{o}D_{eff}}{\unicode[STIX]{x1D707}_{a}},\end{eqnarray}$$
where,
 $\unicode[STIX]{x1D70C}_{a}$
,
 $\unicode[STIX]{x1D707}_{a}$
are air density (
 $\text{kg}~\text{m}^{-3}$
) and viscosity (Pa s),
 $D_{eff}$
is effective burner diameter (m);
 $U_{o}$
is bulk-averaged velocity of the fluid at burner exit (
 $\text{m}~\text{s}^{-1}$
):
 $$\begin{eqnarray}U_{o}\sim \frac{A_{c}U_{c}+A_{a}U_{a}+A_{t}U_{t}}{A_{c}+A_{a}+A_{t}}.\end{eqnarray}$$
Here,
 $A_{c},A_{a},A_{t}$
are cross-sectional areas available for the central, annular and swirl jet, respectively.
 $U_{c},U_{a},U_{t}$
are corresponding bulk average velocities computed based on the volumetric flow rate. Hence it should be noted that
 $Re_{g}$
is basically a bulk-averaged flow Reynolds number at the burner exit.
Further, only the annular flow (i.e. flow across A and B) Reynolds number
 $(Re_{a})$
is defined by neglecting the
 ${A_{t},U}_{t}$
terms in the expression (2.2).
In coaxial jets, it is customary to define the momentum ratio (MR) as a quick estimate to quantitatively understand the momentum transfer pathways among coaxial jets. In general, the jet whose flow rate is variable is defined in the numerator part and the jet with constant air flow rate is kept in the denominator. Since, in this study, for the given co-annular flow across A and C, the flow rate across the tangential port is progressively varied, the MR can be defined as follows,
 $$\begin{eqnarray}MR=\frac{\unicode[STIX]{x1D70C}_{a}U_{t}^{2}}{(\unicode[STIX]{x1D70C}_{a}U_{a}^{2}+\unicode[STIX]{x1D70C}_{c}U_{c}^{2})}.\end{eqnarray}$$
In single phase coaxial jets, since the density is same for all of the fluids, equation (2.3) becomes the velocity ratio
 $$\begin{eqnarray}MR=\frac{U_{t}^{2}}{(U_{a}^{2}+U_{c}^{2})}.\end{eqnarray}$$
Swirl number is quantified as a function of the axial flux of tangential momentum and axial flux of axial momentum:
 $$\begin{eqnarray}S=\frac{\displaystyle \int _{R_{h}}^{R_{o}}\unicode[STIX]{x1D70C}U_{y}U_{w}2\unicode[STIX]{x03C0}r^{2}\,\text{d}r}{\displaystyle \int _{R_{h}}^{R_{o}}\unicode[STIX]{x1D70C}U_{y}^{2}2\unicode[STIX]{x03C0}r\,\text{d}r}.\end{eqnarray}$$
However, Claypole & Syred (Reference Claypole and Syred1981) showed that the swirl number can be defined in terms of the burner geometry (2.6)
 $$\begin{eqnarray}S_{G}=\frac{\unicode[STIX]{x03C0}r_{o}r_{a}}{A_{t}}\left\{\frac{m_{t}}{m_{a}+m_{c}}\right\}^{2},\end{eqnarray}$$
where,
 $r_{o}$
is the radial distance between the burner central axis and the tangential port,
 $r_{a}$
is the inner radius of the annular pipe (A),
 $m_{a},m_{c},m_{t}$
are respectively the annular, central, tangential flow rates (in
 $\text{l}~\text{min}^{-1}$
). In common practice, geometric swirl number
 $S_{G}$
is related to
 $S$
in terms of
 $S\sim 0.25S_{G}$
.
In addition to the MR and the swirl number, the influence of inlet flow conditions on the final flow field structure can be delineated by a parameter named the Rossby number,
 $$\begin{eqnarray}Ro\sim |\unicode[STIX]{x0394}U_{y}|/U_{t},\end{eqnarray}$$
where,
 $$\begin{eqnarray}\unicode[STIX]{x0394}U_{y}\sim U_{c}-U_{a}.\end{eqnarray}$$
Here,
 $U_{c},U_{a}$
indicates the bulk average exit velocities, which are calculated based on the flow rate and exit diameter of the annular and central pipes, respectively.
Experimental test cases. PVB – pre-vortex breakdown; CB – conical breakdown; CTRZ – central toroidal recirculation zone.

Theoretically, the Rossby number
 $(Ro)$
represents the ratio of axial and radial pressure gradient. In swirling flows, it is well known that flow with a dominant radial pressure gradient undergoes vortex breakdown.
The experimental test cases are listed in table 1, it should be noted that the experimental runs are not only confined to the values shown here. For instance, while flow undergoing a transition from CTRZ to conical breakdown (CB) (figure 3), experiments are carried out for small variations in tangential mass flow rate (
 $\unicode[STIX]{x0394}m_{t}\sim 3{-}5~\text{l}~\text{min}^{-1}$
) to carefully identify the flow/vortex breakdown modes. The importance of employing small
 $\unicode[STIX]{x0394}m_{t}$
will be elucidated in greater detail in subsequent sections.
The main aim of this study is to elucidate the effect of swirl intensity on annular flows, in particular, for a given
 $Re_{a}$
, how the flow topologies vary with swirl number
 $S_{G}$
. During this process, it is observed that the flow undergoes different forms of topological variations (like PVB, CB, CTRZ etc. figure 3).
3 Global observations
This section outlines the global evolution of the flow field as a function of swirl number
 $(S_{G})$
for given
 $(Re_{a})$
. The time-averaged flow field acquired from time-resolved PIV measurements, for
 $Re_{a}=4896$
across different
 $S_{G}$
values are shown in figure 3. The time-averaged flow field is an average of 3000 instantaneous flow field images (i.e. 2 s of temporal data).
Time-averaged vector field superimposed with streamlines (A1–A8).

Here, the flow field pertaining to one complete cycle (i.e. non-vortex breakdown to CTRZ) of flow transitions is considered. The vector field shows dominant behaviour in the axial direction for non/weak swirling jets
 $(0\leqslant S_{G}\leqslant 0.58)$
; this is due to the weak momentum
 $(MR<1)$
of the swirl jet compared to the annular jets. In the present study, for
 $0\leqslant S_{G}\leqslant 0.58$
, the value of
 $Ro$
is found to be greater than 1, which signifies dominance of the axial velocity component and resistance towards the vortex breakdown phenomenon. Further increase in swirl number leads to dominance of the centrifugal force and favours vortex breakdown and conical breakdown (figures 3 and 4). Although the signature of the vortex breakdown i.e. counter-rotating eddies is observed at
 $S_{G}\sim 1.76$
, the presence of an axial central jet (C) prevents the formation of a recirculation zone. Hence, this state is named pre-vortex breakdown
 $(Ro\geqslant 1)$
. Furthermore, as evident from the time-averaged flow field observed in the
 $r{-}\unicode[STIX]{x1D703}$
plane, the radial expansion of the flow in the PVB case is constrained by the dominance of the axial jets (figure 5;
 $S_{G}\sim 1.76$
). Beyond this point
 $(S_{G}\geqslant 2.28)$
, the increased centrifugal momentum/pressure gradient
 $({\sim}\unicode[STIX]{x1D70C}U_{t}^{2})$
induced by swirl flow causes a pressure deficit along the jet axis, which ultimately results in the formation of a recirculation zone. The flow transition from PVB to CTRZ state is delineated as the first transition point and the corresponding flow conditions are marked as critical parameters, namely
 $(Re_{o})_{c1}$
,
 $MR_{c1}$
,
 $(S_{G})_{c1}$
. Beyond the transition condition
 $(MR\geqslant MR_{c1})$
, the central jet is completely entrained by the coaxial swirl flow with radially outward expansion (see figures 3 and 5;
 $S_{G}\sim 2.28$
). At this point, the flow exhibits shear layer instability in the axial as well as azimuthal direction.
The radial expansion of the flow field while undergoing a transition from the PVB to CTRZ state can be visualized in supplementary movie 2 available online at https://doi.org/10.1017/jfm.2018.549. The special form of vortex breakdown named ‘conical breakdown’ is witnessed for a further increase in swirl number from the CTRZ case. However, it should be noted that the CB state persists for a very short range of
 $S_{G}$
values (see movie 1). To precisely locate the conical breakdown state and elucidate the possible fluid dynamic routes, tests have been carried out for many flow conditions near the CB state (with an interval of
 $\unicode[STIX]{x0394}m_{t}\sim 3{-}5~\text{l}~\text{min}^{-1}$
). Furthermore, the flow conditions pertaining to CB is delineated as the second transition state (
 $(Re_{o})_{c2}$
,
 $MR_{c2}$
,
 $(S_{G})_{c2}$
).
Illustration of time-averaged flow field of conical breakdown at
 $Re_{a}\sim 4896$
acquired with a wide field of view lens.

Time-averaged flow field in an
 $r{-}\unicode[STIX]{x1D703}$
plane at
 $y/Ra=0.3$
.(
 $Re_{a}\sim 4896$
) (OSL – outer shear layer).

The detailed dynamics governing the formation of conical breakdown from the CTRZ mode will be elucidated in greater detail using the POD and DMD methods in later sections. In this section, only global observations made during the CB state are outlined. Two length scales namely, the distance between the vortex core centre of two counter-rotating eddies (
 $x/R_{a}$
) and the distance between the vortex core centre and the burner exit (
 $Y_{vcc}/R_{a}$
) have been employed. From the time-averaged flow field depicted in figure 3, it is clear that both length scales show an increasing trend on approaching the CB state. For instance, while
 $S_{G}$
increases from 2.28 to 2.40, significant fanning of the recirculation zone is observed. In addition, the vortex core centre (
 $Y_{vcc}/R_{a}$
) shifts upstream. Comparatively, the magnitude of
 $Y_{vcc}/R_{a}$
for pre-CB
 $(S_{G}\sim 2.4)$
is slightly larger than that of post-CB
 $(S_{G}\sim 2.67)$
. Similar pattern is also reported by Billant et al. (Reference Billant, Chomaz and Huerre1998). In the conical breakdown state (figure 3;
 $S_{G}\sim 2.53$
), the counter-rotating eddies do not exist with the flow completely fanning out in the radial direction (see figure 5;
 $S_{G}\sim 2.53$
). To cross-check the existence of counter-rotating vortices in CB, experiments have also been conducted in a large field of view (
 ${\sim}300~\text{mm}\times 300~\text{mm}$
) with the help of a 50 mm macro lens. However, counter-rotating vortices are not witnessed even with the large field of view (see figure 4).
The flow topology persists in the CB state only over a small range of swirl numbers (
 $2.53\leqslant S_{G}<2.67$
), i.e. it recovers back to the CTRZ state. The process of flow undergoing transition to the CB from the CTRZ mode and its recovery back to the CTRZ state can be visualized in movie 1 (acquired with the DSLR camera from the planar Mie scattering experiment). The flow recovery from the CB to CTRZ state is marked as the third critical point and demarcated as
 $(Re_{o})_{c3}$
,
 $MR_{c3}$
,
 $(S_{G})_{c3}$
. Furthermore, the CTRZ states attained before and after the CB mode are referred to as pre- and post-CTRZ.
In general, swirling flow always exhibits a certain degree of asymmetry (even for a time-averaged flow field) as a manifestation of strong PVC at higher swirling intensities (Syred Reference Syred2006; Steinberg et al.
Reference Steinberg, Boxx, Stöhr, Meier and Carter2012; Chterev et al.
Reference Chterev, Sundararajan, Emerson, Seitzman and Lieuwen2017). Lieuwen (Reference Lieuwen2012) clearly delineated how the asymmetries are induced in the swirling flow as a consequence of strong PVC. He also showed that it is the formation of helical waves, in addition to axial and azimuthal KH waves, which essentially drive asymmetry in the flow field. Computational studies carried out by Huang, Wang & Yang (Reference Huang, Wang and Yang2005) in the coaxial swirl injector also delineate the same feature. Markovich et al. (Reference Markovich, Dulin, Abdurakipov, Kozinkin, Tokarev and Hanjalić2016) showed the occurrence of an asymmetric flow structure (at higher swirl number) from the high-speed tomographic PIV (
 ${\sim}2~\text{kHz}$
) results. In addition, their three-dimensional flow field precisely showed how the evolution of the inner and outer helical vortices (IHV, OHV) leads to asymmetric structures.
The phenomenon of conical breakdown is reported only by a very few researchers (Sarpkaya Reference Sarpkaya1971a ; Billant et al. Reference Billant, Chomaz and Huerre1998). Lack of results and inherent technical complexities associated with CB leads to a poor understanding of the problem. For a coaxial flow, it is mandatory to identify the flow parameters which govern the conical breakdown. The above global observations as a function of flow parameters are schematically illustrated in figure 6.
Global flow regime map.

Here, flow conditions are globally divided into two regimes namely the tangential (II) and axial momentum (I) dominated regions. It is seen that the Rossby number for the flow conditions pertaining to conical breakdown is always found be
 ${<}1$
. In the conical breakdown state, any increase in flow which favours
 $Ro>1$
results in the disappearance of the CB state. This observation clearly indicates that conical breakdown occurs only when centrifugal momentum is dominant over axial momentum (i.e.
 $\unicode[STIX]{x1D70C}U_{\unicode[STIX]{x1D703}}^{2}>\unicode[STIX]{x1D70C}U_{y}^{2}$
;
 $Ro<1$
). The time-averaged flow field corresponding to higher Reynolds numbers
 $Re_{a}\sim 10\,545$
, 17 456 (i.e. B1–B7 and C1–C7) exhibits similar flow structures, as shown in figures 3 and 5. This may be due to the same swirl number value across all three
 $Re_{a}$
values. This phenomenon has been observed by several researchers, for instance, Fu et al. (Reference Fu, Cai, Jeng and Mongia2007) and Rajamanickam & Basu (Reference Rajamanickam and Basu2017b
). Hence, for brevity the flow field only pertaining to
 $Re_{a}\sim 4896$
is shown in this section.
Furthermore, it should be noted that, although the time-averaged topologies of the flow field are similar for the other
 $Re_{a}$
values, the dynamic behaviour is very different at higher Reynolds numbers (particularly
 $Re_{a}\sim 17\,000$
). For instance, at low flow rates
 $(Re_{a}\sim 4896)$
, the occurrence of conical breakdown (CB) is evidenced in both forward and backward pathways at the same air flow rates. However, the repeatability in the occurrence of CB does not follow the same path at the high air flow rates corresponding to
 $Re_{a}\sim 17\,000$
. The same will be explained in greater detail using POD and DMD analysis in forthcoming sections.
More detailed information concerning the global flow topologies (vorticity maps, TKE distribution) as functions of swirl number can be found in our previous work (Santhosh et al. Reference Santhosh, Miglani and Basu2013, Reference Santhosh, Miglani and Basu2014).
3.1 Evolution of shear layers in the flow field
The evolution of shear layer in the spatial domain of the flow field across the different flow modes is illustrated in figure 7. It is seen that multiple shear layers exist for flows which exhibit vortex breakdown (see figure 7
b–e). The PVB flow mode (figure 7
b) exhibits two inner shear layers (ISL 1, ISL 2) and one outer shear layer (OSL 1). This is due to the combined dominance of the axial and centrifugal momentum induced by co-annular and swirling jets. During the CTRZ mode, ISL 2 completely vanishes due to the resistance offered by the recirculated flow against the axial jet. However, as the flow approaches the CB from the CTRZ mode, the ISL starts to shift towards the radial direction and its extent in the axial direction is also significantly reduced. Furthermore, with the full open cone configuration, the ISL almost vanishes and persists only in the near burner exit zone. The shear layers observed from the
 $r{-}\unicode[STIX]{x1D703}$
measurements across various
 $S_{G}$
values are delineated in figure 5. Except for the CB case, the presence of the outer shear layer for all other flow modes is clearly witnessed. The outer shear layer does exist for the CB case, but it is far away from the burner central axis.
It should be noted that, excepting swirl number, parameters such as the momentum ratio (MR) and Rossby number (
 $R_{o}$
) have been used to classify the flow into two paradigms i.e. in the given coaxial jet, whether the tangential flow is dominant (
 $\boldsymbol{U}_{\unicode[STIX]{x1D73D}}>\boldsymbol{U}_{\boldsymbol{y}}$
– regime II) or the axial jets are dominant (
 $\boldsymbol{U}_{\unicode[STIX]{x1D73D}}<\boldsymbol{U}_{\boldsymbol{y}}$
– regime I). Furthermore, as discussed in the above section, the flow modes are distinguished into three distinct types, PVB, CTRZ, CB as a function of
 $S_{G}$
.
Hence, to avoid the confusion, instead of using all the non-dimensional numbers, thereafter only the flow modes (PVB, CTRZ, CB) and the corresponding swirl numbers are widely used in the forthcoming sections.
Evolution of shear layers across various
 $S_{G}$
values. (a)
 $S_{G}\sim 0$
; (b)
 $S_{G}\sim 1.78$
; (c)
 $S_{G}\sim 2.28$
; (d)
 $S_{G}\sim 2.4$
; (e)
 $S_{G}\sim 2.5$
; (f)
 $S_{G}\sim 2.53$
(OSL, ISL – outer, inner shear layer).

4 Vortex breakdown dynamics
The global observations presented in § 2 yield information on how the flow topology evolved as a function of the various swirl numbers. The results presented opened up several important questions. It is seen that conical breakdown occurs while the centrifugal pressure gradient is dominant. However, it is unclear why it persists only over a small range and recovers back to the CTRZ mode, although the flow is still centrifugally dominant. To understand this phenomenon, we have employed proper orthogonal and dynamic mode decomposition (POD, DMD) methods to identify dominant structures across different flow modes (PVB, CTRZ, CB).
4.1 Proper orthogonal decomposition
The essential role of the POD is to extract the most energetic structures from instantaneous flow field data. Additionally, POD enables us to quantify characteristic frequencies of the dominant modes from the temporal spectrum. In this study, we have implemented the ‘method of snapshots’ based POD algorithm (Sirovich Reference Sirovich1987; Berkooz, Holmes & Lumley Reference Berkooz, Holmes and Lumley1993) to decompose the flow field. The steps involved in the implementation of POD for given flow field data is shown in figure 8. Mathematically, this algorithm decomposes the instantaneous flow field data
 $(U^{\prime },V^{\prime })$
into corresponding spatial
 $\emptyset _{n}(x)$
and temporal
 $(j)$
modes. Further details on POD implementation for PIV data can be found in Rajamanickam & Basu (Reference Rajamanickam and Basu2017b
).
Steps involved in computing POD from the instantaneous flow field. Adapted from Rajamanickam & Basu (Reference Rajamanickam and Basu2017b ).

4.1.1 Temporal dynamics and spatial eigenmodes in the
 $y{-}r$
and
$r{-}\unicode[STIX]{x1D703}$
planes


In general, the snapshot algorithm yields a spatial eigenmode number that equals the number of instantaneous data sets. However, the resultant eigenmodes are numbered in descending order of turbulent kinetic energy (TKE) magnitude
 $(\unicode[STIX]{x1D706}_{n})$
. For brevity, POD is carried out for those flow conditions which exhibit the vortex breakdown phenomenon (i.e. only for PVB, CTRZ, CB;
 $S_{G}\geqslant 1.76$
). Additionally, POD analysis has been extended to the
 $r{-}\unicode[STIX]{x1D703}$
plane to meticulously understand the dynamics of vortex breakdown across different flow modes.
Illustration of spatial eigenmodes perceived from POD analysis in
 $y{-}r$
plane at
 $Re_{a}\sim 4896$
. (a)
 $S_{G}\sim 1.78-\text{PVB}$
; (b)
 $S_{G}\sim 2.28-\text{CTRZ}$
; (c)
 $S_{G}\sim 2.53-\text{CB}$
; (d) distribution of % TKE across various POD spatial modes.

POD analysis has been carried out at many locations (
 $r{-}\unicode[STIX]{x1D703}$
planes), although the results pertaining to only three axial locations are explicitly considered. These three positions are considered such that key locations such as downstream and upstream of the VCC (see figure 10
a) are covered. It is well known that frequency signatures perceived from fast Fourier transform (FFT) implemented over temporal modes yield more quantitative information on nature of the flow. Hence, for brevity, spatial eigenmodes are shown only for near-field locations (
 $y/R_{a}\sim 0.3$
) and temporal modes are shown for all the defined locations.
(a) Schematic illustration of spatial locations where POD analysis is carried out in an
 $r{-}\unicode[STIX]{x1D703}$
plane; (b–d) spatial eigenmodes of PVB, CTRZ, CB in near-field locations at
 $Re_{a}\sim 4896$
(
 $y/R_{a}\sim 0.3$
).

Dynamics of pre-vortex breakdown (PVB)
The POD spatial eigenmodes pertaining to PVB, CTRZ, CB of the
 $y{-}r$
plane are respectively shown in figure 9. Here vorticity maps are used to delineate the energetic modes. Since the cumulative energy of the first few modes contribute 90 % of the total energy, only those spatial modes are shown. In the PVB case, the most energetic mode (figure 9
a, M1) clearly shows the dominance of axial shear induced by KH vortices of the co-annular jets at ISL 2. PVB case exhibits strong counter-rotating eddies in the near field of the burner (see figure 3
 $S_{G}\sim 1.76$
), leading to vortex shedding in the outer shear layer (OSL 1). This phenomenon is not intensified in mode 1, whereas, the same is clearly visible in modes 2–4 (figure 9
a). More quantitative information on this observation can be perceived from the frequency signatures derived from the POD temporal modes. In general, it is known that shedding eddies in the flow lead to frequency harmonics. From figure 11(a), it is evident that modes 2–4 show the existence of harmonics in the frequency signatures. On the other hand, mode 1 shows one strong peak around
 ${\sim}20~\text{Hz}$
followed by higher-order frequencies with very small magnitude (this is due to the absence of shedding in mode 1; figure 9
a M1). Furthermore, the instantaneous flow field suggests that the activation of shedding mode in the PVB case may be due to unsteadiness induced by the interaction of the swirling and co-annular jets in the near field. This can be interpreted in a quantitative manner from the POD analysis implemented over the
 $r{-}\unicode[STIX]{x1D703}$
plane.
Schematic illustration of frequency signatures perceived from POD temporal modes in
 $y{-}r$
plane across various
 $S_{G}$
values. (
 $Re_{a}\sim 4896$
.)
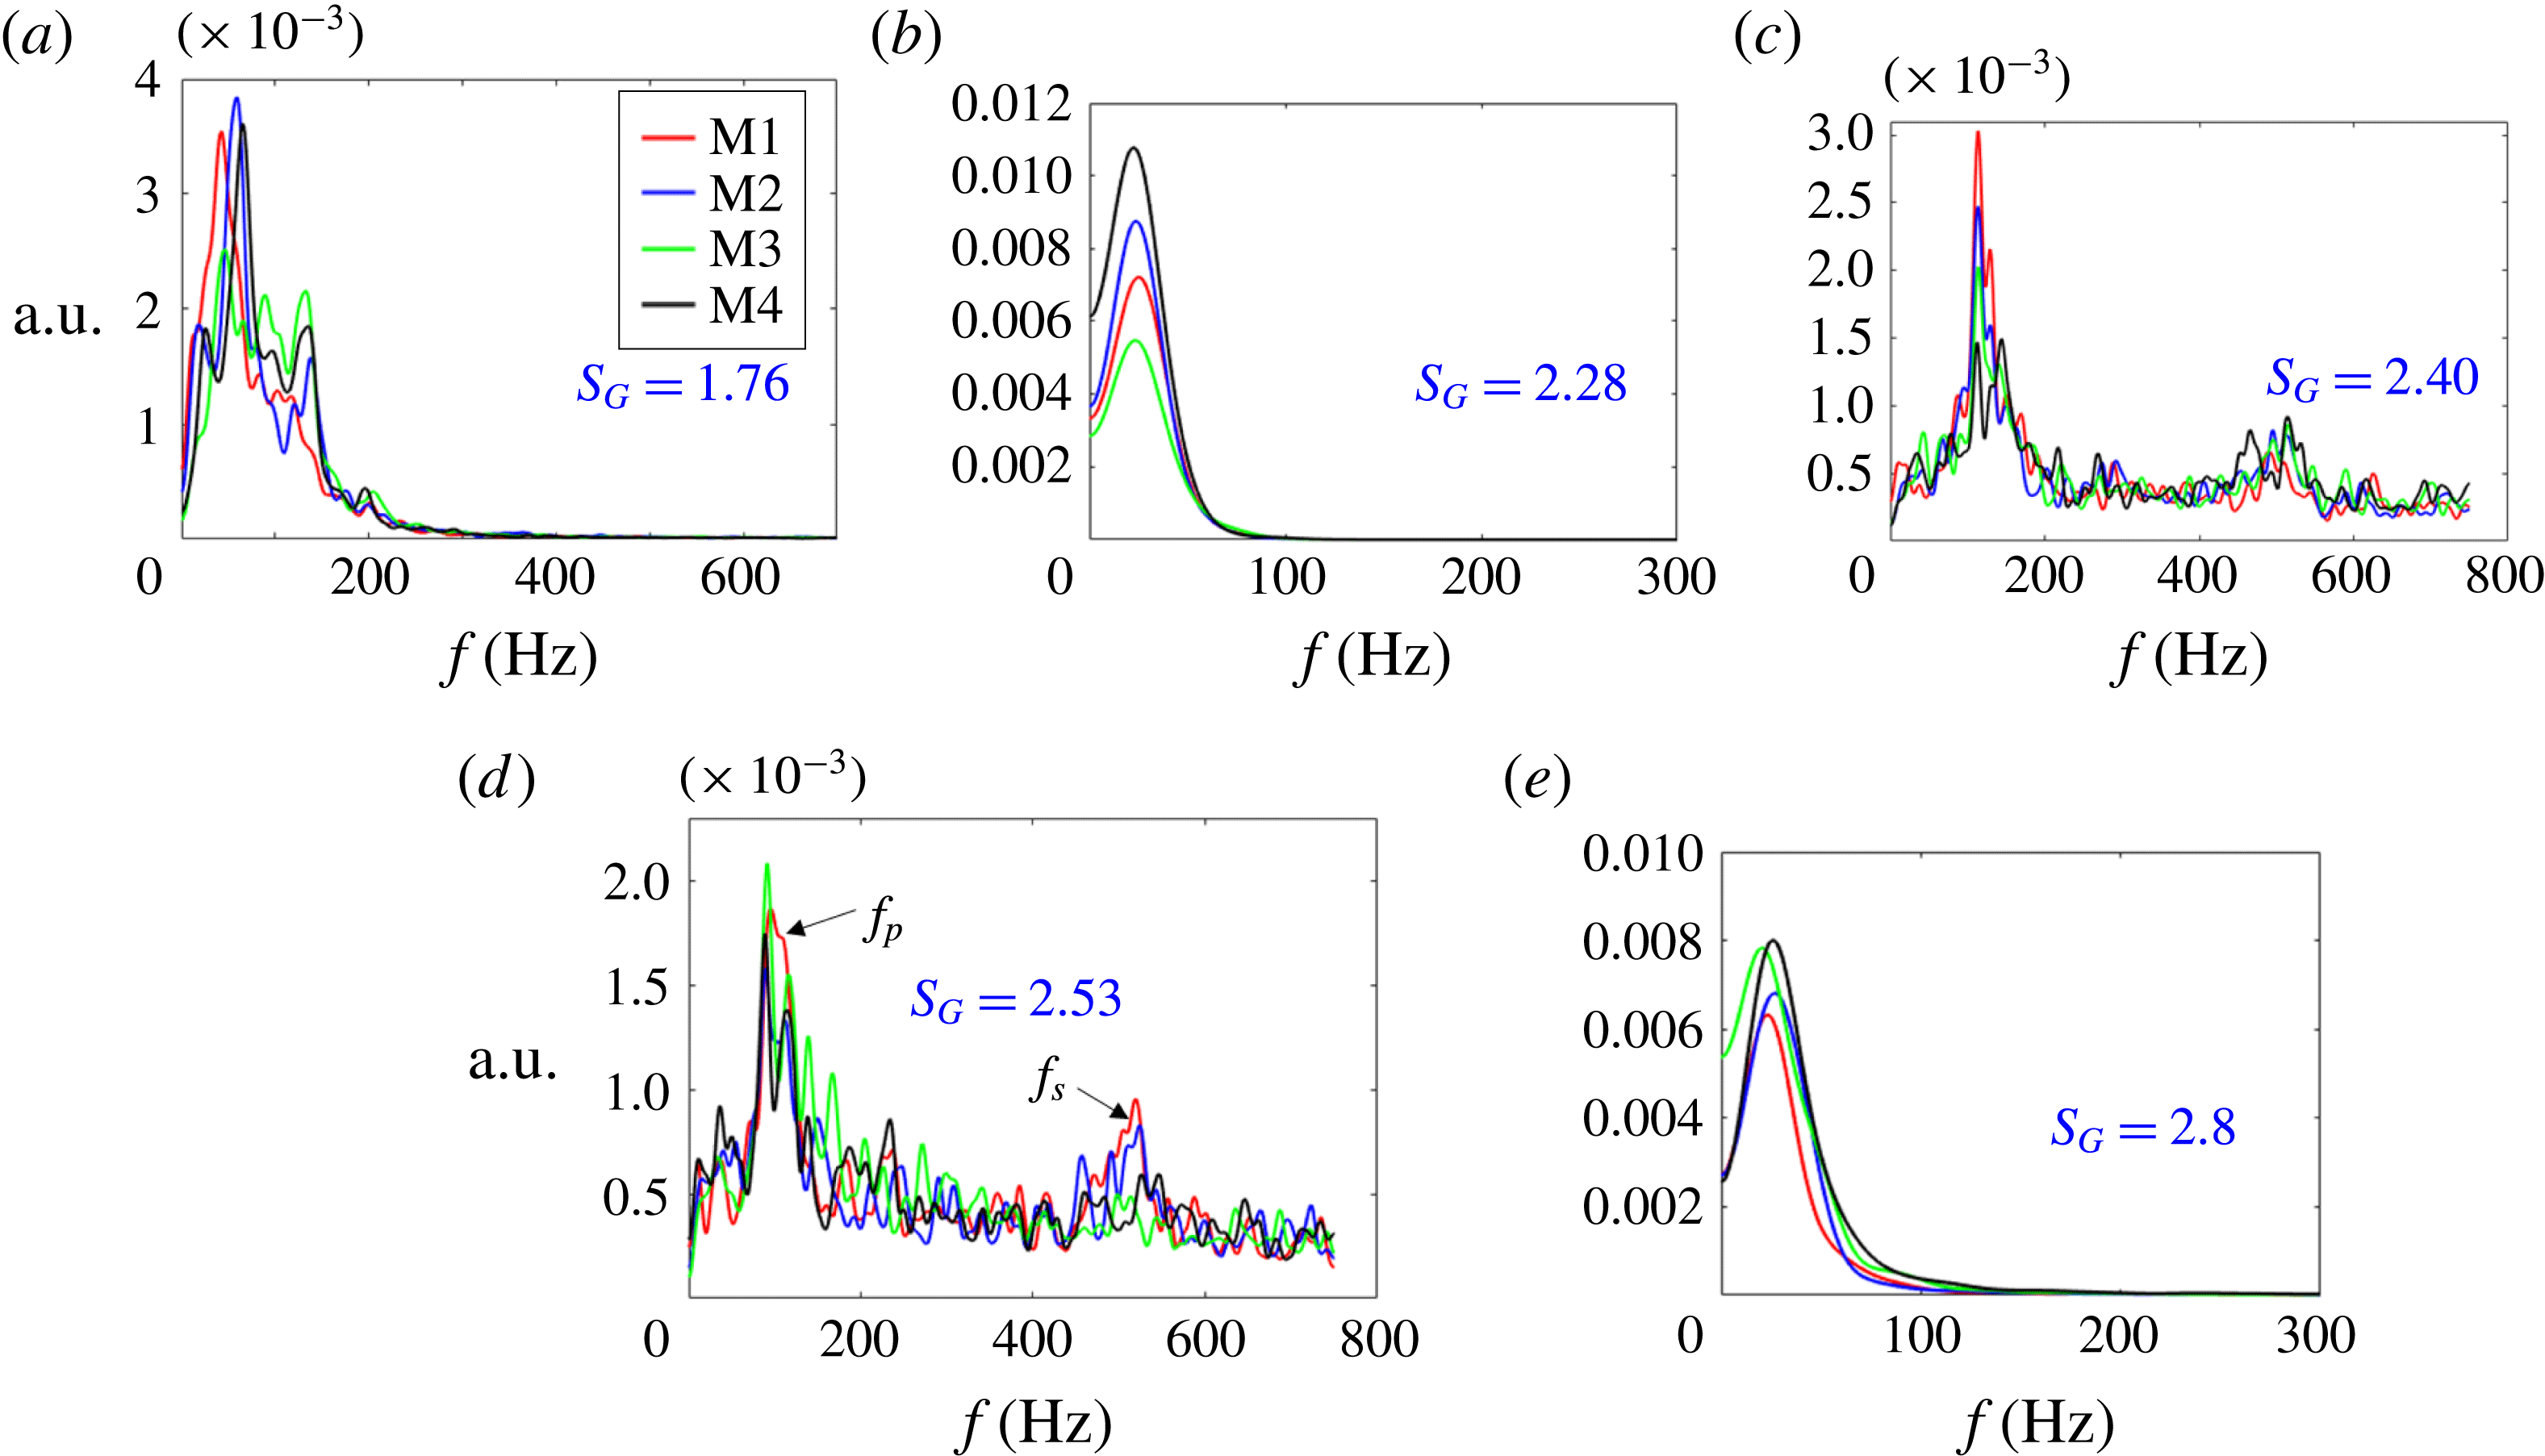
As mentioned earlier, the activation of shedding modes in the PVB case is more pronounced in the near field (figure 12
a;
 $y/R_{a}\sim 0.3$
, 1.5 and figure 10
b), due to the strong interaction of the two jets (i.e. co-annular and swirl jet). Particularly, this phenomenon induces intense oscillations in the outer shear layer (see figure 10
b, movie 3). In the far downstream position, after the vortex core centre (VCC), the deficiency in the momentum of two streams leads to a reduction in intensity of these oscillations. Frequency signatures derived from FFT (figure 12
a;
 $y/R_{a}\sim 3$
) are also in line with this argument.
Illustration of frequency signatures observed across various axial locations in the
 $r{-}\unicode[STIX]{x1D703}$
plane (
 $Re_{a}\sim 4896$
).

Dynamics of central toroidal recirculation zone (CTRZ)
For the CTRZ case, the dominant mode is identified as centrifugally unstable (see M1 in figure 9
b). This is due to the strong influence of the azimuthal shear induced by high swirl
 $(\unicode[STIX]{x1D70C}U_{\unicode[STIX]{x1D703}}^{2}>\unicode[STIX]{x1D70C}U_{y}^{2})$
. Rayleigh’s inviscid criterion and the theoretical work done by Coles (Reference Coles1965) state that the shear layer becomes unstable either due to a circulation intensity decrease in the radial direction or due to a stratification in angular momentum.
 $$\begin{eqnarray}\frac{\text{d}\unicode[STIX]{x1D6E4}}{\text{d}r}<0;\quad \unicode[STIX]{x1D714}_{z}\unicode[STIX]{x1D6FA}<0.\end{eqnarray}$$
Hence, the dominance of centrifugal effects in the CTRZ mode is evident from the negative vorticity zone in the central region (figure 9
b, M1). The second mode is anticipated as the axial shear mode, which may arise due to the interaction between the inner and outer shear layers (OSL, ISL) induced by vortex bubble breakdown (VBB). Unlike the PVB case, the shedding mode in CTRZ carries a much lower energy (figure 9
b, M4). As a result, harmonics are not observed with the shedding mode. All the modes exhibit frequency peaks concentrated around a very narrow band of
 ${\sim}10{-}20~\text{Hz}$
(figure 11
b). In general, the helical shear mode exhibits higher energy content for flows with weak swirl (i.e. prior to VBB). However, CTRZ exhibits strong vortex breakdown; hence the helical mode appears as the third mode (figure 9
b, M3).
Contrary to observations made for PVB in the
 $r{-}\unicode[STIX]{x1D703}$
plane, with the CTRZ flow mode, for all
 $y{-}R_{a}$
planes, activation of the shedding mode is not perceived. The frequency signatures of CTRZ pertaining to the VCC plane show dual peaks in mode 1 (figure 12
b,
 $y/R_{a}\sim 1.5$
). This may due to mild oscillations induced by the precessing vortex core (PVC). It is well known that PVC in strong swirling jets (the ones which exhibit VBB) induces oscillations in the flow (Syred Reference Syred2006; Oberleithner et al.
Reference Oberleithner, Stöhr, Im, Arndt and Steinberg2015). However, in a global sense, azimuthal and axial shear modes appeared to be the most energetic flow modes in the CTRZ conditions (see figures 9
b and10
c).
Dynamics of conical breakdown (CB)
The spatial eigenmodes pertaining to the conical breakdown case is shown in figure 9(c). Contrary to the PVB and CTRZ conditions, the CB case shows highly energetic shedding structures (see figure 9
c, M1). Here, almost all of the four modes show the dominance of shedding vortices. The dominance of shedding structures in CB results in the appearance of frequency harmonics across all of the modes (figure 11
c,d). In order to understand the underlying dynamics of CB, POD is implemented over two small intervals of
 $\unicode[STIX]{x0394}S_{G}$
(
 ${\sim}0.05$
). To achieve this, flow rates across the tangential ports are varied in small steps of
 ${\sim}4~1~\text{min}^{-1}$
. The corresponding frequency signature is shown in figure 11(c,d) (for eigenmodes figure 11
d shows a similar pattern and hence is not shown here). It is seen that in both cases, frequency peaks shifted towards the higher side
 ${\sim}50{-}100~\text{Hz}$
and exhibit harmonics. Further, it is very interesting to note that for the flow conditions which recover back to CTRZ from CB, the frequency values also shifted to the lower side and harmonics are not evident (figure 11
e).
For the CB case, since the breakdown occurs very close to the burner exit with rapid radially outward flow expansion (not in the axial direction), POD in the
 $r{-}\unicode[STIX]{x1D703}$
plane is computed only in the near-field plane close to
 $y/R_{a}\sim 0.3$
. The frequency signature at this location delineates the strong dominance of shedding across all modes. In the
 $y{-}r$
plane POD, it is mentioned that the sudden shift in frequencies towards the higher side may be the reason why the flow undergoes conical breakdown. The POD analysis carried out in an
 $r{-}\unicode[STIX]{x1D703}$
plane also shows similar behaviour.
The higher-order frequencies exhibited by the shedding vortices may be the energy source responsible for the conical breakdown. This argument will be further proved by DMD analysis in subsequent sections.
Sequence of PIV raw images illustrating the intense bubble bursting phenomenon in the conditions close to CB.

Furthermore, the Mie scattered raw images acquired during time-resolved measurements suggest intense bubble bursting in the central core region (figure 13
a–c). The bursting intensifies with an increase in swirl number, until the flow undergoes conical breakdown. At the transition state
 $(S_{G})_{c1}$
, although the bubble starts to burst, the flow is still attached to the rotating core (figure 13
a,b; see movie 4). However, at the conical breakdown state, the increased centrifugal momentum causes the flow to stay predominantly at the periphery (figure 13
c,f). The flow conditions prior/closer to CB are identified as precursor events. We can see severe intermittency in bubble bursts across the temporal space (figure 13
g). On account of the intermittency associated with bubble burst, these precursor events exhibit highly unstable behaviour with shear layer oscillations observed across longitudinal (
 $y{-}r$
) and azimuthal (
 $r{-}\unicode[STIX]{x1D703}$
) planes.
The above-mentioned observations are clearly delineated in movie 4 (
 $r{-}\unicode[STIX]{x1D703}$
plane) and movie 5 (
 $y{-}r$
plane).
4.1.2 Influence of sampling frequency
The frequency signatures perceived from the POD temporal modes corresponding to CB (figures 11
d; 12) exhibit a wide band of frequency oscillations in the range of
 ${\sim}100{-}600~\text{Hz}$
. To precisely probe the existence of any further frequencies beyond this range, experiments have been conducted at higher sampling rates (i.e.
 ${\sim}3.5~\text{kHz}$
; 5 kHz). For instance, the comparison made between the frequency signatures observed across three sampling rates (1.5 kHz, 3.5 kHz and 5 kHz) for
 $Re_{a}\sim 17\,456$
is graphically depicted in figure 14.
Comparison between frequency signatures observed at CB case for
 $Re_{a}\sim 17\,456$
. (a) 1.5 kHz; (b) 3.5 kHz; (c) 5 kHz. (d) Time-averaged flow field acquired as various sampling rates.

It is clear that in all the cases, the frequency signatures follow a similar trend. Interestingly, as seen from figure 14(c), even at higher sampling rates (i.e. 5 kHz), there are no significant higher-order frequencies. It should be noted that 5 kHz is the maximum attainable sampling frequency used in this study (equipment limitations). Since, the observed maximum frequencies are in the range of
 ${\leqslant}550~\text{Hz}$
, the dynamics extracted from the flow field using a sampling rate of 1.5–5 kHz is reasonable. However, minor shifts in peak frequencies (figure 14 without any loss of major physical insight) can also be partially attributed to the limitation in sampling rate. In addition, a lower sampling rate may cause undetected high frequency signatures (although this is unlikely in the current set of experiments) in swirling flows. Furthermore, it should be noted that we have observed a slight variation (
 ${\sim}10{-}15~\text{Hz}$
) in the dominant frequency even when the experiments are repeated for the CB case at the same sampling rate. However, these variations are very minimal/negligible for the CTRZ and PVB cases. Hence, the slight difference in frequency (noticed in figure 14
a–c) is attributed as an effect of unsteadiness associated with the CB mode itself. However this slight difference could also be partially due to the limited sampling rate. In particular, CB is always known to induce severe oscillations in the outer shear layer, which further induce multiple shedding vortices in the shear layer. This has been reported by Billant et al. (Reference Billant, Chomaz and Huerre1998) through smoke flow visualization experiments. Billant et al. (Reference Billant, Chomaz and Huerre1998) also showed the intermittency in the emptying and filling process of fluid inside the recirculation zone. In addition, their hysteresis analysis delineated the evolution to variations in the temporal dynamics of conical breakdown.
Owing to the low bulk velocity of the flow (
 $U_{o}\sim 1.23~\text{m}~\text{s}^{-1}$
,
 $2.497~\text{m}~\text{s}^{-1}$
,
 $4.01~\text{m}~\text{s}^{-1}$
respectively at
 $Re_{a}\sim 4896$
, 10 545, 17 546), we have found that temporally
 ${\sim}2~\text{s}$
of data are needed to achieve a proper temporal average of the flow field. This is particularity significant with the low
 $Re_{a}$
case. For instance, the time-averaged streamline plot of
 $Re_{a}\sim 4896$
sampled at 3.5 kHz (see figure 14
c) shows an erroneous temporal average mainly due to the reduction in the sampling time. The lowering of the sampling time occurs due to the limitation of the on board storage of the camera at 3.5 kHz sampling. Therefore, acquisition of images at 1.5 kHz becomes more of an optimum choice for the present study.
4.2 Identification of robust modes using dynamic mode decomposition
In the previous section, POD has been employed to elucidate the energetic structures present in each vortex breakdown mode. In general, POD is viewed as a modal reduction technique which quantifies the dominant structures that govern the flow field (Taira et al. Reference Taira, Brunton, Dawson, Rowley, Colonius, McKeon, Schmidt, Gordeyev, Theofilis and Ukeiley2017), or in simple terms, it is basically an ‘energy ranking method’. Several researchers have quoted that although POD precisely resolves the dominant spatial structures, it may be difficult to predict the contribution of each frequency in the flow field. For instance, M2 in figure 12(c), shows multiple frequency values. Likewise, other modes also show several frequency values. Hence, from POD analysis, it is too cumbersome to predict the contribution of a particular frequency value towards the dynamics/stability of the flow. Recently however, another modal analysis technique named dynamic mode decomposition (DMD) has received greater attention in the understanding of the dynamics of a given flow field. This technique was originally developed by Schmid (Reference Schmid2010) and later improved in several ways by many researchers (Williams, Kevrekidis & Rowley Reference Williams, Kevrekidis and Rowley2015; Proctor, Brunton & Kutz Reference Proctor, Brunton and Kutz2016). The essential role of DMD is to evaluate the contribution of each frequency found in the flow field. In essence, it attempts to predict whether a particular frequency forces the flow to become stable or unstable. More details on the strengths and weaknesses of modal analysis tools like POD, DMD, single value decomposition (SVD) etc. in interpreting fluid flows are elaborated with illustrative examples in Taira et al. (Reference Taira, Brunton, Dawson, Rowley, Colonius, McKeon, Schmidt, Gordeyev, Theofilis and Ukeiley2017).
4.2.1 Implementation of DMD
In the first step, the acquired set of instantaneous snapshots (i.e. velocity fields) needs to be converted into a matrix form. In particular, the velocity data set pertaining to each instant of time should be represented in a sequential way (i.e. over ‘
 $n$
’ time instants) in the form of a column matrix:
 $$\begin{eqnarray}\unicode[STIX]{x1D653}_{1}^{N}=\{v_{1},v_{2},v_{3},\ldots \ldots ,v_{N}\}.\end{eqnarray}$$
The matrix obtained using (4.2) from instantaneous data sets can be further treated as follows
 $$\begin{eqnarray}\displaystyle & \unicode[STIX]{x1D653}_{1}^{N-1}=\{v_{1},v_{2},v_{3},\ldots \ldots ,v_{N-1}\}, & \displaystyle\end{eqnarray}$$
 $$\begin{eqnarray}\displaystyle & \unicode[STIX]{x1D653}_{2}^{N}=\{v_{2},v_{3},v_{4},\ldots \ldots ,v_{N}\}. & \displaystyle\end{eqnarray}$$
Now, the constant linear mapping or dynamical propagator
 $Y$
needs to be defined to represent the velocity fields at each time instant
 $$\begin{eqnarray}\displaystyle & v_{k+1}=Yv_{k}, & \displaystyle\end{eqnarray}$$
 $$\begin{eqnarray}\displaystyle & \unicode[STIX]{x1D653}_{2}^{N}=Y\unicode[STIX]{x1D653}_{1}^{N-1}. & \displaystyle\end{eqnarray}$$
The single value decomposition of (4.2) yields,
 $$\begin{eqnarray}\displaystyle & \unicode[STIX]{x1D653}_{1}^{N-1}=\unicode[STIX]{x1D650}\unicode[STIX]{x1D64E}\unicode[STIX]{x1D651}^{J}, & \displaystyle\end{eqnarray}$$
 $$\begin{eqnarray}\displaystyle & \unicode[STIX]{x1D653}_{2}^{N}=\unicode[STIX]{x1D650}\unicode[STIX]{x1D64E}\unicode[STIX]{x1D651}^{J}\unicode[STIX]{x1D653}_{1}^{N-1}, & \displaystyle\end{eqnarray}$$
 $$\begin{eqnarray}\displaystyle & Y=\unicode[STIX]{x1D650}^{J}\unicode[STIX]{x1D653}_{2}^{N}\unicode[STIX]{x1D651}\bar{\unicode[STIX]{x1D64E}}. & \displaystyle\end{eqnarray}$$
Here,
 $\unicode[STIX]{x1D650}$
,
 $\unicode[STIX]{x1D651}$
are orthonormal matrices and
 $\unicode[STIX]{x1D64E},\bar{\unicode[STIX]{x1D64E}}$
represent the diagonal and pseudo-inverse of the diagonal matrix respectively.
Finally, the diagonal matrix with eigen values
 $(\unicode[STIX]{x1D707})$
is obtained. Further, these values are converted to Floquet values as follows
 $$\begin{eqnarray}\unicode[STIX]{x1D714}=\frac{\ln (\unicode[STIX]{x1D707})}{\unicode[STIX]{x0394}t},\end{eqnarray}$$
where,
 $\unicode[STIX]{x0394}t$
is the time separation between successive frames/snapshots.
The parameter
 $\unicode[STIX]{x1D714}$
is represented as a combination of real and imaginary parts
 $(\unicode[STIX]{x1D714}=\unicode[STIX]{x1D714}_{r}+\unicode[STIX]{x1D714}_{i})$
, from which frequency can be extracted as follows
 $$\begin{eqnarray}f=\frac{\unicode[STIX]{x1D714}_{i}}{2\unicode[STIX]{x03C0}}.\end{eqnarray}$$
The value and sign of
 $\unicode[STIX]{x1D714}$
is used as a criterion to analyse the dynamics of the flow. For instance, positive and negative values of
 $\unicode[STIX]{x1D714}$
denote unstable and stable modes respectively. In general practice, modes (modes
 $1,2,3,\ldots ,n$
) in the DMD are interpreted based on the magnitude of
 $\unicode[STIX]{x1D714}$
in descending order. Recently, ranking the DMD modes based on their amplitude coefficients (derived using the least squares method) has become popular. The mathematical procedure involved with sorting the DMD modes based on modal amplitude is illustrated with details in Rowley et al. (Reference Rowley, Mezić, Bagheri, Schlatter and Henningson2009) and Mohan, Gaitonde & Visbal (Reference Mohan, Gaitonde and Visbal2015). DMD usually assigns the highest growth rates to the flow with small-scale eddies originating from wakes, even though these eddies possess less energy. In applications where the objective is to find the dynamic nature of the frequency associated with energetic coherent structures, DMD modes ranked based on amplitude are highly preferred. To illustrate this phenomenon, comparison is made between the growth rate
 $(\unicode[STIX]{x1D714}_{r})$
and amplitude
 $(\unicode[STIX]{x1D709})$
based DMD modes (figure 15) for the CTRZ case at
 $Re_{a}=4896$
.
(a) Illustration of comparison between dynamic modes extracted using growth rate versus amplitude based algorithms: (i) DMD growth rate versus frequency; (ii) DMD growth rate (only unstable) versus frequency; (iii) DMD amplitude versus frequency. (b) Spatial modes corresponding to the frequencies marked with i, j, k in (a).

The DMD computed based on the growth rate algorithm shows a dominant value around
 ${\sim}400~\text{Hz}$
(marked as ‘
 $j$
’ in figure 15
a (ii)), whereas the amplitude versus frequency plot shows dominance around
 ${\sim}30~\text{Hz}$
. The spatial modes corresponding to the frequencies marked with
 $i$
,
 $j$
,
 $k$
in figure 15(a) (ii), (iii) respectively are shown in figure 15(b). The spatial modes clearly delineate that the higher-order frequencies shown by the growth rate algorithm are contributed by the outer shear layer shedding in the flow. On the contrary, the frequency values ranked based on the amplitude
 $(\unicode[STIX]{x1D709})$
show that the shear mode is dominant which is identified as a most energetic mode in the POD analysis. This clearly delineates the disclaimer associated with
 $(\unicode[STIX]{x1D714}_{r})$
and
 $(\unicode[STIX]{x1D709})$
in identifying the dominant modes in the given flow field.
Since, in this study, the main objective is to identify the fluid dynamic cause behind various transition and flow modes (which are believed to be mostly governed by dominant coherent structures in the flow field), we have computed DMD modes based on modal amplitudes
 $\unicode[STIX]{x1D709}$
.
The obtained DMD modes across various swirl numbers for
 $Re_{a}=4896$
are graphically illustrated in figure 16. It should be noted that the only first fifty modes (frequency) sorted based on amplitude
 $(\unicode[STIX]{x1D709})$
are shown. For brevity, the frequencies pertaining to the
 $y{-}r$
plane are shown in figure 16. However, the comparison between frequencies corresponding to
 $\unicode[STIX]{x1D709}_{max}$
observed across the
 $y{-}r$
and
 $r{-}\unicode[STIX]{x1D703}$
planes is graphically depicted in figure 18(a).
DMD amplitude ranked frequency signatures across various
 $S_{G}$
values in the
 $y{-}r$
plane (
 $Re_{a}\sim 4896$
).

4.2.2 Insights into the vortex breakdown dynamics using combined POD and DMD analysis
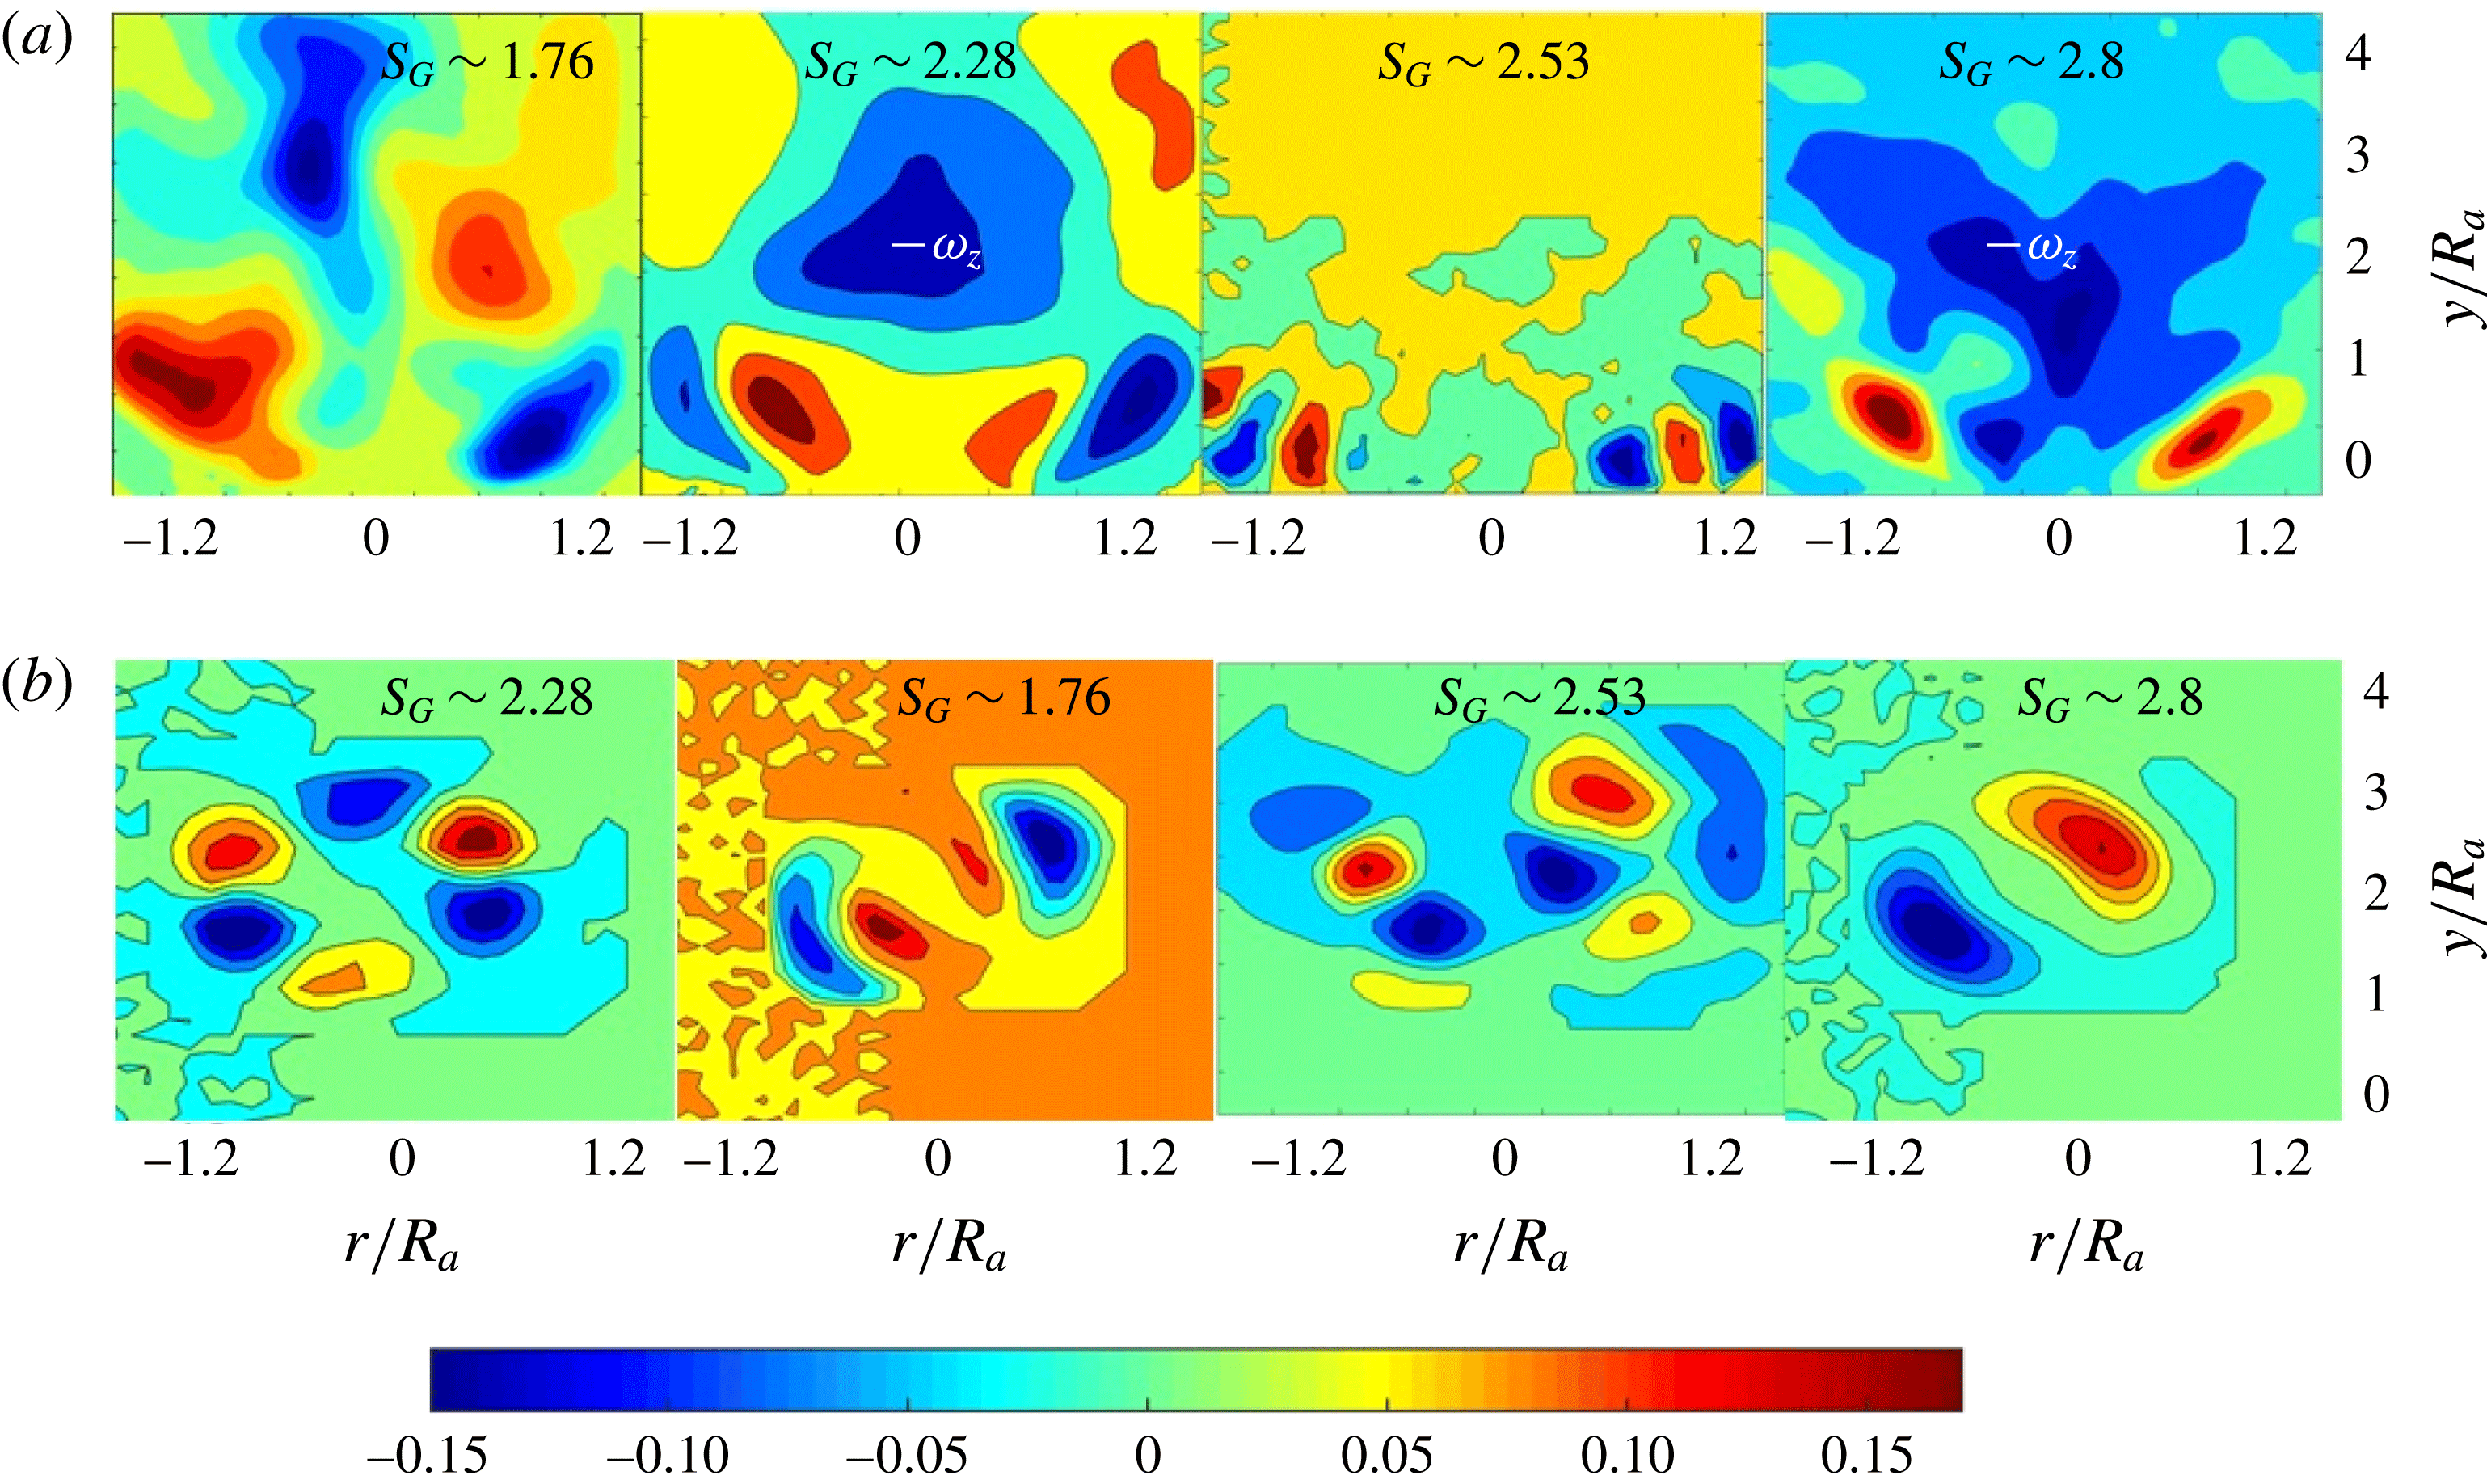
In general, DMD modes are compared with POD modes by extracting the spatial structure pertaining to each frequency obtained in the DMD spectrum. This is to corroborate whether the energy content of the spatial structure pertaining to the dominant frequency in the DMD plot is physically relevant or not. For instance, the spatial structure (shown in figure 17
a;
 $S_{G}\sim 2.28$
) corresponding to
 $f_{1}$
of
 $S_{G}\sim 2.28$
(figure 16) is similar to M1 in figure 9(b), can be interpreted as showing that the corresponding flow condition is dominated by the KH shear instability.
The frequency signature plotted against amplitude
 $(\unicode[STIX]{x1D709})$
delineates the rapid shift of
 $f_{1}$
towards higher values (300–50 Hz) when the flow approaches conical breakdown (see
 $S_{G}\sim 2.40,2.53$
in figure 16). However, for the other cases, it is clear that the dominant frequency
 $f_{1}$
concentrates around
 ${<}100~\text{Hz}$
(marked as zone A). Particularly for pre- and post-CTRZ cases,
 $f_{1}$
is observed around
 ${\sim}30~\text{Hz}$
. Though, all the cases show some frequencies in the range of 300–500 Hz, excepting the CB case, the same is not observed within the first 20 DMD modes.
As mentioned earlier, it is necessary to evaluate the spatial structure pertaining to
 $f_{1}$
to yield quantitative information on the dynamics governing each flow state (i.e. PVB, CTRZ, CB). The reconstructed spatial structures of
 $f_{1}$
resemble the most dominant (M1) spatial eigenmodes perceived from POD analysis (see M1 in figures 9
a–c and 10
a,b). The spatial structures of the higher-order frequencies observed with CTRZ, PVB predominantly show shedding which is identified as low energetic structures (% TKE
 ${\sim}$
15 %) in POD reconstruction. Hence, the contribution of higher-order frequencies with these flow conditions (i.e. CTRZ, PVB) is insignificant.
Robust dynamic modes observed across various vortex breakdown modes. (a)
 $y{-}r$
plane; (b)
 $r{-}\unicode[STIX]{x1D703}$
plane at
 $y/R_{a}\sim 0.3$
(
 $Re_{a}\sim 4896$
).
Furthermore, the energy ratio
 $(\unicode[STIX]{x1D713})$
between the shedding and shear modes is computed to quantitatively represent the contribution of spatial structures in the given flow conditions. The parameter
 $\unicode[STIX]{x1D713}$
can be defined as follows,
 $$\begin{eqnarray}\unicode[STIX]{x1D713}=\frac{(\%~\text{TKE})_{shedding}}{(\%~\text{TKE})_{shear}}.\end{eqnarray}$$
The energy ratio
 $(\unicode[STIX]{x1D713})$
calculated across various
 $S_{G}$
values are graphically illustrated in figure 18(b). Additionally, only peak frequencies (i.e.
 $f_{1}$
) obtained from the DMD plot are also shown in tandem (figure 18
a). The values clearly demarcate, that with the swirl number increasing from 1.5 to 3, the frequencies show a sudden rise in a very narrow band
 $(S_{G}\sim 2.45{-}2.55)$
. Correspondingly, the energy contribution of the shedding modes also shows a sharp peak in this zone. Hence, it is interpreted that the occurrence of the sudden rise in the higher-order frequencies together with the dominant nature of shedding mode causes the flow to undergo conical breakdown. Further, figure 18(a,b) is constructed in the form of a regime map from which states of various flow modes under the influence of
 $S_{G}$
can be identified.
(a) DMD-based amplitude ranked frequencies across various
 $S_{G}$
values; (b) energy-ranked VB modes derived from POD analysis (
 $Re_{a}\sim 4896$
).

The observations made with POD and DMD analysis can be summarized as follows
 $$\begin{eqnarray}\displaystyle & f_{1}\leqslant 100;\unicode[STIX]{x1D713}<1\rightarrow PVB,CTRZ, & \displaystyle\end{eqnarray}$$
 $$\begin{eqnarray}\displaystyle & f_{1}\geqslant 300;\unicode[STIX]{x1D713}\gg 1\rightarrow CB. & \displaystyle\end{eqnarray}$$
4.3 Conical breakdown mechanism
The understanding related to the occurrence of conical breakdown in swirling flows still remains hypothetical since the first report made by Billant et al. (Reference Billant, Chomaz and Huerre1998) and later by Santhosh et al. (Reference Santhosh, Miglani and Basu2013) although extensive works (Benjamin Reference Benjamin1962; Sarpkaya Reference Sarpkaya1971b
; Hall Reference Hall1972; Leibovich Reference Leibovich1978) have been reported on the vortex breakdown phenomenon in swirling flows, occurrence of CB is not understood clearly. Billant et al. (Reference Billant, Chomaz and Huerre1998) showed that flow undergoes CB if the pressure at the stagnation point and the ambient are identical. This essentially shows the absence of steady motion between the fluid in the stagnation zone and the ambient fluid. In general, when the flow is moving towards a higher swirl number, first helical vortices appear in the flow at moderate
 $S_{G}$
followed by bubble breakdown at higher
 $S_{G}$
. The transfer of energy from the azimuthal waves to the helical waves is viewed as a source for vortex bubble breakdown at higher
 $S_{G}$
values.
In the present study, the combined DMD and POD analyses carried out over the time-resolved PIV data acquired at various
 $y{-}r$
and
 $r{-}\unicode[STIX]{x1D703}$
planes reveal the dominance of shedding modes at the onset of conical breakdown. In general, although shedding is observed at the outer shear layer (OSL) across all flow conditions, its intensity may be reduced due to the presence of strong shear induced by two counter-rotating eddies in the near field (see figure 3). This can be viewed as a holder for OSL shedding, whereas in the CB case, the flow is not constrained by these two counter-rotating eddies (figure 3;
 $S_{G}\sim 2.53$
). The flow starts to shed from the burner exit itself. The vanishing nature of the counter-rotating eddies are clearly visible in the flow case close to CB (figure 3;
 $S_{G}\sim 2.4,2.67$
). Furthermore, this can also be interpreted from the DMD spectrum shown in figure 16, for instance, higher-order frequencies (say
 ${>}300~\text{Hz}$
) do appear for PVB, CTRZ but the strong shear (axial
 $+$
azimuthal) induced by counter-rotating vortices prevents the flow from undergoing conical breakdown.
The present and previous investigations clearly delineate that temporally, the CB state undergoes oscillations attributed to strong shear layer shedding. Previous studies (Chanaud Reference Chanaud1965; Spall et al.
Reference Spall, Gatski and Grosch1987) have proved that swirl flow undergoes vortex breakdown if and only if the magnitude of
 $R_{O}$
is less than 1. Although CB always appears in the azimuthal momentum dominant condition (i.e.
 $R_{O}<1$
), it happens over a very narrow band and quickly recovers back to CTRZ even when the flow rate is continuously increased, favouring azimuthal momentum. However, the issues which remain as hypotheses relate to why conical breakdown happens in the very narrow band and why it recovers back to the classical CTRZ mode.
The occurrence of conical breakdown in a narrow band can be hypothesized as follows.
In general, swirl flows exhibit instability waves in the azimuthal as well as axial direction. The classical CTRZ structure in swirl flow is an evolution resulting from helical waves occurring at low swirl number. Stability analysis performed with swirling jets clearly delineates the evolution of various forms of shear layer instability mechanisms as a function of
 $S_{G}$
(Afanasyev & Peltier Reference Afanasyev and Peltier1998; Gallaire & Chomaz Reference Gallaire and Chomaz2003a
). The results presented by Gallaire & Chomaz (Reference Gallaire and Chomaz2003a
) reveal the activation of centrifugal instabilities in addition to KH (axial
 $+$
azimuthal) instabilities even with the presence of axial plug flow.
Likewise, in the present study, an increase in
 $S_{G}$
from the CTRZ mode may predominantly pump energy into azimuthal waves rather than into axial KH waves
 $(\unicode[STIX]{x1D706}_{\unicode[STIX]{x1D703}}>\unicode[STIX]{x1D706}_{axial})$
. The highly energetic unstable waves induced in the azimuthal plane may cause the flow to fan out completely (see figure 20
a). At the instant of CB, the raw images clearly suggest that the axial jets are completely engulfed by the coaxial swirling jet. Moreover, the raw images pertaining to pre- and post-CB also suggests that the instability waves induced due to shear inside the jet (position where the swirl jet interacts with the axial jets) are not intensified (see figure 19
b). However, during CB, the waves are clearly visible at the inner and outer surface of the jet (figure 19
a). This may be due to the dominance of centrifugal instabilities as pointed out by Gallaire & Chomaz (Reference Gallaire and Chomaz2003a
) in their stability analysis. However, the resultant flow structure during the dominance of centrifugal instabilities is not shown in Billant et al. (Reference Billant, Chomaz and Huerre1998).
Schematic illustration of shear waves formed at inner and outer surfaces of the jets.

Hypothetical illustration of azimuthal and axial instability waves. (a) Conical breakdown; (b) CTRZ; (c) spatial evolution of vortices in swirling flow field.

The force induced by axial and azimuthal waves can be written as follows
 $$\begin{eqnarray}\displaystyle & F_{KH_{axial}}\sim \unicode[STIX]{x1D70C}U_{o}^{2}/\unicode[STIX]{x1D706}_{axial}, & \displaystyle\end{eqnarray}$$
 $$\begin{eqnarray}\displaystyle & F_{KH_{\unicode[STIX]{x1D703}}}\sim \unicode[STIX]{x1D70C}U_{o}^{2}/\unicode[STIX]{x1D706}_{\unicode[STIX]{x1D703}}. & \displaystyle\end{eqnarray}$$
Beyond CB, a perturbation caused to the flow in terms of increased
 $S_{G}$
might result in the damping of azimuthal waves (
 $\unicode[STIX]{x1D706}_{\unicode[STIX]{x1D703}}$
;
 $F_{KH_{axial}}>F_{KH_{\unicode[STIX]{x1D703}}}$
). The occurrence of this event in the small
 $S_{G}$
space clearly delineates CB as a highly unstable phenomenon. It should be noted however that the above discussed argument is purely a hypothesis. To precisely probe the mechanism of conical breakdown (particularly to answer why it occurs in a very narrow band), it is necessary to acquire the three-dimensional flow field data in a simultaneous fashion to check for the evolution of vortices in the spatial domain. In swirling flows, the momentum will be spread in the azimuthal as well as axial direction (figure 20
c). As a result, azimuthal and axial shear waves will be induced in the flow field. In addition, Garcia-Villalba, Frohlich & Rodi (Reference Garcia-Villalba, Frohlich and Rodi2005) and Komarek & Polifke (Reference Komarek and Polifke2010) have identified the ‘indirect mechanism’ by which axial vorticity is excited, which ultimately results in fluctuations in the waves. The influence of these waves as flow transits to CB from the CTRZ state can be identified only if these wavenumbers are identified in a quantitative fashion. However, these demand either three-dimensional flow field data or a rigorous three-dimensional stability analysis (Oberleithner et al.
Reference Oberleithner, Sieber, Nayeri, Paschereit, Petz, Hege, Noack and Wygnanski2011), which are not within the scope of this manuscript.
It should be noted that the present study is not aimed at a quantitative understanding of why conical breakdown occurs in a narrow band. Rather, we are more focused on how the flow dynamics evolves as the flow approaches and passes the conical breakdown states. Even with the limitations of time-resolved two-dimensional PIV measurements, we have precisely delineated the precursor events such as the activation of multiband oscillations when the flow approaches the CB state. This information provides more insights into dynamical features of CB rather than the mechanism which governs its formation. This feature has not documented in the literature to date.
Furthermore, while progressively inducing swirl in the axial jets, the flow exhibits strong helical waves followed by vortex breakdown at high swirl number. At the instant of CB, helical waves might vanish completely due to centrifugal effects and may result in the flow detaching from the vortex core. However, to validate this point, three-dimensional flow field data are required to visualize the evolution of helical waves while
 $S_{G}$
is progressively varied.
Moreover, CB is also observed with a similar type of test rig which discharges swirl flow through a vane swirler. Here also CB appears within a very narrow band when the flow across the swirler is progressively varied (see movie 6). This observation indicates that the occurrence of CB in coaxial swirling flow may be a universal phenomenon. Furthermore, it should be very interesting to note that in both the experiments, CB is witnessed only with the presence of co-annular axial jets. We have not observed any CB in the absence of axial jets, even when the swirl number is progressively varied in very small steps. This clearly indicates that the switching between various instability modes across coaxial jets may cause the flow to undergo conical breakdown.
In both cases, the cone undergoes a series of temporal oscillations in the azimuthal as well as axial direction, which ultimately leads to the dominance of the shedding mode. Previous studies attempted to distinguish CB from other forms of vortex breakdown based on the theoretical arguments deduced from pressure gradients in the flow (Billant et al. Reference Billant, Chomaz and Huerre1998; Santhosh et al. Reference Santhosh, Miglani and Basu2014). However, the time-resolved PIV measurements carried out in this study yield new insights into the dynamics of conical breakdown.
Hysteresis phenomenon associated with conical breakdown pathways. (a)
 $Re_{a}\sim 4896$
; (b)
 $Re_{a}\sim 10\,545$
; (c)
 $Re_{a}\sim 17\,456$
.

4.4 Hysteresis phenomenon in conical breakdown pathways
In the global observation section, it was stated that though the time-averaged flow field is similar across all
 $Re_{a}$
, the vortex breakdown pathways exhibit contradictory behaviour. Particular emphasis is placed on the repeatability associated with the conical breakdown state from CTRZ. To illustrate this phenomenon, experiments have been meticulously carried out in a forward (F) and backward (R) manner, i.e.
 $S_{G}$
values increased from 1.5 to 3 or decreased from 3 to 1.5 (this can also be interpreted as pre- and post-CTRZ).
Frequency spectrum observed for CTRZ case across various
 $Re_{a}$
values.

The observations are transformed into a three-dimensional map as illustrated in figure 21. Two parameters namely % TKE (from POD) and frequency pertaining to
 $\unicode[STIX]{x1D709}_{max}$
of DMD are considered across various
 $S_{G}$
. These experiments are carried out with very close variation in
 $\unicode[STIX]{x0394}S_{G}$
values (
 ${\sim}\pm 0.05$
).
From POD and DMD analyses, it is clear that the activation of the higher-order frequencies contributed by shedding eddies in the flow leads to the CB state. Hence, in figure 21, % TKE is considered for the shedding mode. The values of other modes are assigned as zero. For the
 $Re_{a}\sim 4896$
case, during the forward set of experiments, conical breakdown starts to appear at
 $S_{G}\sim 2.4$
and is observed until
 $S_{G}\sim 2.6$
(figure 21
a F1). Progressive decrease in
 $S_{G}$
from 3 to 1.5 follows the same path (figure 21
b R1) in terms of flow topology. Whereas, for
 $Re_{a}\sim 17\,456$
, the flow path to the CB state during the forward direction is completely different from the backward direction. In the forward condition, the flow undergoes CB around
 $S_{G}\sim 2.4{-}2.6$
and transits back to the CTRZ state, whereas during the backward case, there is no evidence of conical breakdown (figure 21
b R1, see blue circles). It should be noted that the activation of higher-order frequencies, which is believed to be a cause for CB, also does not appear with a decreasing value of
 $S_{G}$
. However, CB is observed (shown as pink dashed lines in figure 21
b) only for a sudden and large decrease in
 $S_{G}$
(i.e.
 $\unicode[STIX]{x0394}S_{G}\sim -0.5$
) for
 $Re_{a}\sim 10\,545$
. The hysteresis analysis performed by Billant et al. (Reference Billant, Chomaz and Huerre1998) reports that CB appears in forward as well as backward cases. This may be due to the low Reynolds number, as is the case for
 $Re_{a}\sim 4896$
. Their analysis also pointed out the upward and downward shift of stagnation points during forward and backward conditions respectively. It should be noted that upshift of the stagnation point during flow conditions near to CB was already elucidated in the global observation section (see figure 3).
Illustration of key governing mechanisms observed across various vortex breakdown (VB) modes.

The hysteresis observed at high
 $Re_{a}$
may be due to the insufficient residence time
 $(\unicode[STIX]{x1D70F}_{r})$
associated with the flow.
For instance, if the flow is provided with a higher residence time at
 $Re_{a}\sim 17\,456$
as compared to
 $Re_{a}\sim 4896$
, then CB is also possible in the backward path. Furthermore, it should be noted that, although the CTRZ mode exhibits a dominant frequency around
 ${\sim}24~\text{Hz}$
across all the
 $Re_{a}$
values, some secondary frequency peaks are observed at
 $Re_{a}\sim 17\,456$
(see figure 22). These may be attributed to the small-scale shedding eddies in the flow field, which are intensified due to the higher
 $Re_{a}$
.
5 Summary and conclusions
The new insights into the dynamics of the vortex breakdown mechanisms in coaxial swirling flows have been addressed with the help of high fidelity time-resolved laser diagnostic tools. In particular, for the first time, we have reported the fluid dynamic phenomenon governing the special form of breakdown named ‘conical breakdown’ in swirling flows. In this study, three co-annular flow Reynolds numbers
 $(Re_{a})$
are chosen, and for each
 $Re_{a}$
, the swirl number has been progressively varied independently. The global observation outlined in § 3 delineates the time mean transition of the flow field across various
 $S_{G}$
values. In addition, it also yields an understanding of momentum transfer pathways across three coaxial jets (A–C).
The summary of the detailed observations presented across various sections is pictorially depicted in figure 23. In a global sense, the flow field considered in this study can be viewed in two major categories i.e. centrifugal momentum dominant flow (I) and axial momentum dominant flow (II). In addition, the flow under region I can be subdivided into four major paradigms (pre-CTRZ, CB, post-CTRZ; figure 23
b). In region I, the deficiency of swirl momentum or the dominance of co-annular axial jets
 $(MR<MR_{c})$
results in complete engulfment of the swirl jet. On account of the weak swirl strength in this regime, the flow does not undergo vortex breakdown.
On the other hand, strong vortex breakdown is witnessed in regime II. Furthermore, the flow exhibits different forms of VB as a function of swirl number
 $S_{G}$
. In particular, a special form of breakdown named conical breakdown is observed while the swirl intensity
 $(S_{G})$
is progressively varied. Interestingly, CB persists only over a very short internal of
 $S_{G}$
values. Beyond this point, the flow recovers back to its previous VB mode (shown as post-CTRZ in figure 23). The global observations pertaining to each VB mode in regime I and II are detailed in § 2.
Subsequently, POD analysis is employed over instantaneous flow field data acquired from time-resolved PIV to extract the dominant spatial structures (in terms of % TKE) across each flow mode. In addition, the frequency signature pertaining to each dominant POD mode is also acquired using FFT methods. The analysis carried out over
 $y{-}r$
, as well as
 $R{-}\unicode[STIX]{x1D703}$
plane data,- yields a canonical understanding of the governing fluid dynamics phenomenon. For instance, the axial shear mode is identified as a predominant energetic structure in regime II (i.e. PVB), though the signature of shedding eddies is also seen albeit that its intensity is observed only in the near field (i.e. the position where all three jets interact). In addition to axial shear, strong azimuthal shear is also witnessed with the flows enlisted under regime I. This is due to the dominance of centrifugal momentum
 $(MR\geqslant MR_{c})$
. Like PVB, shedding modes appeared as low energetic modes (i.e. mode 4) in pre- and post-CTRZ flow conditions. On the contrary, shedding modes contribute towards much of the TKE (
 ${\sim}50{-}70\,\%$
) in the CB condition. As a result, harmonics are observed with frequency signatures derived from the temporal modes. Interestingly, the flow recovers back to the shear (axial
 $+$
azimuthal) dominant mode in the post-CTRZ case (similar to the pre-CTRZ case; see figure 23
b). The sudden transition in % TKE from shear to shedding modes with CB case is interpreted as a cause for the flow to undergo conical breakdown.
Next, the frequency ranked dominant flow structure identification method named DMD is implemented to quantitatively corroborate the frequency relevance of the energetic structures identified from the POD modes. Here, the frequencies pertaining to each flow condition are ranked based on amplitude
 $(\unicode[STIX]{x1D709})$
derived using the least squares method. The results revealed that, for pre-and post-CTRZ, PVB, frequencies with the maximum amplitude predominantly fall in the range of 30–100 Hz. Whereas, the flow conditions relevant to CB exhibit maximum amplitude for higher-order frequencies 330–600 Hz. Furthermore, the spatial structures pertaining to
 $\unicode[STIX]{x1D709}_{max}$
in the frequency spectrum match with the dominant structures obtained from the POD analysis. The interpretations gained from the DMD and POD analyses show that the activation of higher-order frequencies with significant TKE results in conical breakdown.
Finally, hysteresis analysis is performed to elucidate the repeatability of vortex breakdown modes across various
 $S_{G}$
values. In particular, these measurements are done to check whether CB persists in both forward and reverse directions. It is seen that except for low flow rate conditions
 $(Re_{a}\sim 4896)$
, the path followed by CB is different during the forward and reverse conditions. For instance, with higher air flow rates (
 $Re_{a}\sim 4896$
; 17 456) CB is observed when
 $S_{G}$
is progressively increased with an
 $\unicode[STIX]{x0394}S_{G}$
of 0.05. On the contrary, CB is not witnessed in the reverse direction with the same level of decrease in
 $\unicode[STIX]{x0394}S_{G}$
. CB appeared only for a larger reduction in
 $S_{G}$
values (
 ${\sim}0.5$
).
Acknowledgements
Financial support from DST under Swarnajayanti Fellowship (DST/SJF/ETA-02/2013-14) scheme and national centre for combustion research and development (NCCRD) is gratefully acknowledged. Authors also extend sincere thanks to Mr M. Jain and Ms Sumana for their assistance in data processing.
Supplementary movies
Supplementary movies are available at https://doi.org/10.1017/jfm.2018.549.



