INTRODUCTION
India is the third largest producer of rapeseed-mustard in the world (after China and Canada) with an annual production of 7.3 million tonnes from an area of 7.13 million hectares (USDA, 2014). Mustard is predominantly grown as a winter crop in the northern, north-western, central and eastern India under irrigated, limited irrigation and rain-fed conditions (Bhagat and Soni, Reference Bhagat and Soni2000; Kumar and Yadav, Reference Kumar and Yadav2007; Kumar et al., Reference Kumar, Verma, Singh and Singh2011). Its productivity depends on the availability of resources in particular region and the capacity of farmers. It varies from high input use (N, P, K, S; irrigation; plant protection etc.) in the northern and north-western Indo-Gangetic Plains (IGPs) to less or no input use with residual or marginal fertility and conserved soil moisture in the eastern IGPs, particularly in the State of West Bengal, where this study was conducted. Mustard yield in West Bengal (~1020 kg ha−1) is much lower (Economic review, 2012) than the national average yield (~1190 kg ha−1). Lower yield is mainly due to its cultivation in marginal and sub-marginal lands with limited or no usage of resources (water, nutrients). Proper irrigation schedule accompanied by optimum fertilizer prescription may help to increase its yield (Piri et al., Reference Piri, Nik, Tavassoli, Rastegaripour and Babaeian2011). Fertilizing mustard crop with N, P and K can increase yield substantially. But, S, being a constituent of amino acid methionine and the most important secondary nutrient for oil crops, including mustard, its application is equally important/imperative for improving the quality of mustard (Morris, Reference Morris2007; Singh and Pal, Reference Singh and Pal2011).
Recently, global warming is perceived as an important threat to agriculture. Agriculture collectively contributes to nearly 20% of the GHGs (CO2, CH4, N2O) emissions (Pathak and Wassman, Reference Pathak and Wassman2007). The estimation of GHGs emissions from crop fields has been carried out mostly in developed countries, which seldom reflects the emissions from developing countries. In 2007, the net GHGs emissions from India, including the emissions from land use, land use change and forestry (LULUCF) were 1727.71 million tonnes CO2 eq, of which emissions of CO2, CH4 and N2O were 1221.76, 20.56 and 0.24 million tonnes, respectively. In India, direct (during cultivation and harvesting) and indirect (through fertilizers, pesticides) emissions of GHGs from agriculture are estimated to be around 17% of the net CO2 eq emissions (Wood and Cowie, Reference Wood and Cowie2013). Identifying C-efficient alternatives through a better understanding of the emissions from different production practices (Lal, Reference Lal2004) may lead to mitigation of GHGs emissions in mustard. However, certain factors such as difference in the efficiency of plants, different mechanisms controlling emissions, raw materials used, and the variation in assumptions made by the analysts, contribute to variations in emission factors even for similar fertilizer products or cropping practices. For this, life cycle assessment (LCA), which is a tool for assessing both direct and indirect emissions from farm operations (Wood and Cowie, Reference Wood and Cowie2013) has been used in this study for absolute estimation of the emissions.
Mustard being predominantly grown under rain-fed or limited irrigation conditions without applying S in the eastern IGPs, the recommendation for S fertilization along with irrigation needs to be developed and tailored through research. Simultaneously, the studies on economics and GHGs emissions in the mustard production system assume relevance for better adoption of S fertilization and irrigation by the farmers. Therefore, this study was undertaken to optimize irrigation and S levels towards higher yield, profitability and lower GHG emissions in mustard; and, secondly, to estimate the effects of irrigation and S on mustard yield by using Cobb–Douglas production function/model.
MATERIALS AND METHODS
Experimental sites and treatments details
Field experiments were undertaken during the two winter cropping seasons in 2010–11 and 2011–12 at the Bidhan Chandra Krishi Viswavidyalaya, Mohanpur, West Bengal, India, located at 22°56′ N latitude and 88°32′ E longitude with an altitude of about 9.75 m above mean sea level. The soil was clayey loam with pH 6.21, EC 0.104 dsm−1, and oxidizable organic C 0.43%. The available N, P and K in soil were 393.5 kg N, 52.6 kg P2O5 and 154.0 kg K2O per ha, respectively. The available S was 14.3 mg kg−1.
The treatments comprising of three irrigation treatments at critical growth stages of mustard, viz., I30, one irrigation at flower initiation stage 30 DAS; I60, one irrigation at siliqua development stage 60 DAS; and I30/60, two irrigations at 30 and 60 DAS in main plots; and four S levels, S0, no S; S30, 30 kg S ha−1; S45, 45 kg S ha−1 and S60, 60 kg S ha−1 in the sub-plots were laid out in a split plot design with three replications. The sizes of main plots and sub-plots were 24 m by 3 m and 5 m by 3 m, respectively. A broad recommendation of S for mustard/oil crops is 20–50 kg S ha−1 (Morris, Reference Morris2007) across the northern, north-western and central India where mustard is grown under irrigated and limited irrigation situations (Bhagat and Soni, Reference Bhagat and Soni2000; Kumar and Yadav, Reference Kumar and Yadav2007; Kumar et al., Reference Kumar, Verma, Singh and Singh2011). A basal application of 40 kg S/ha through gypsum or elemental S to mustard has been recommended for enhancing seed oil by 2% and seed yield by 25% (DRMR, 2011: http://www.drmr.res.in/). In this study, these S recommendations were chosen with slight alteration since the eastern IGPs lacks S recommendation for mustard. We adopted 0, 30, 45 (50% above the 30 kg S/ha) and 60 kg S/ha (100% above the 30 kg S/ha) for optimization of the dose of S with due consideration of the medium status of S in the experimental field and the likely variable response to S at varying water regimes (one or two irrigations) adopted in this study. Similarly, irrigation level was required to be optimized as there was no uniform irrigation application, which varied from 1 to 3 irrigations, depending on the rainfall received during cropping cycle across locations and over the years. Hence, we adopted three irrigation regimes.
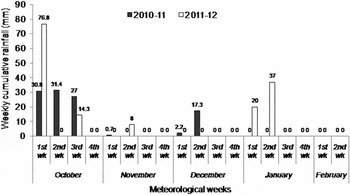
Depth of irrigation water applied at 30 and 60 DAS was 40 and 50 mm, respectively. Consumptive use of water was calculated as per Patel et al. (Reference Patel, Patel and Patel2008) following the relationship: [Consumptive use (mm) = profile soil moisture use (mm) + effective rainfall (mm) + groundwater contribution (mm)]. Ground water contribution was considered nil as the depth of water table was more than 30 m below the surface throughout the crop growing period. Rainfall received during sowing time (i.e. first week of October) was sufficient in both 2010–11 and 2011–12 (Figure 1). It was consistent up to the third week of October in both years except that there were no rains during the second week in second year.
Weekly cumulative rainfall (mm) during the years of experiments.

Indian mustard, ‘Varuna (T-59)’ was sown on 03 October in both years at 45 cm × 10 cm spacing with a seed rate of 7 kg ha−1. Plants absorb S in the form of sulphate. Elemental S becomes oxidized to SO4 2− in about 30 days. Therefore, bentonite clay as the source of elemental S was applied at 30 days before sowing of mustard to allow sufficient time for oxidation to SO4 2− in order to become available to plants. Nitrogen, P, and K per ha at 80 kg N, 40 kg P2O5 and 40 kg K2O, respectively (ICAR, 2010: http://www.icar.org.in) were applied through urea, diammonium phosphate and muriate of potash, respectively. Other agronomic practices were followed as recommended (DRMR, 2011: http://www.drmr.res.in/).
Estimation of economics
The common cost of mustard cultivation was calculated on the basis of prevailing market prices of the inputs required during the respective crop seasons. The total cost of cultivation of treatments included the common cost plus treatment cost. The gross returns were obtained from the mustard seed yield, multiplied by the prevailing market price. The net returns were worked out by deducting the total cost of cultivation from the gross returns. The net benefit:cost (net B:C) was calculated from the net returns divided by the total cost of cultivation.
Estimation of CO2 equivalents of GHGs
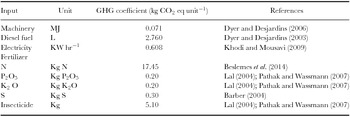
The GHGs emissions of different inputs [machinery/tractor, diesel, electricity, fertilizer (N, P2O5, K2O and S), insecticide] were estimated from the CO2 emission coefficients (Table 1) multiplied by the application rate of inputs (Barber, Reference Barber2004; Beslemes et al., Reference Beslemes, Tigka, Efthimiadis and Danalatos2014; Dyer and Desjardins, Reference Dyer and Desjardins2003; Reference Dyer and Desjardins2006; Khodi and Mousavi, Reference Khodi and Mousavi2009; Lal, Reference Lal2004; Pathak and Wassman, Reference Pathak and Wassman2007). For irrigation, the GHGs emissions were calculated by multiplying the electricity unit with GHG emissions coefficient (kg CO2 eq ha−1). GHGs emissions coefficient for N together from fertilizer production and fertilized soil was 17.45 kg CO2 equivalents per kg N of synthetic N fertilizer (Beslemes et al., Reference Beslemes, Tigka, Efthimiadis and Danalatos2014). The GHGs emissions due to seeds being negligible were not included in the analysis (Beslemes et al., Reference Beslemes, Tigka, Efthimiadis and Danalatos2014). Total emission coefficients of P, K, S and insecticides from the factory synthesis and field applications (excluding transportation) are hardly available in the literatures. Therefore, the CO2 emission coefficients mentioned in Table 1 have been used for partial GHGs emissions.
Greenhouse gas (GHG) emission coefficients of different inputs.

Determination of econometrics and sensitivity
To study the relationship and sensitivity between crop management inputs (irrigation and S) and mustard yield, Cobb–Douglas production function was applied (Hatirli et al., Reference Hatirli, Ozkan and Fert2005; Mohammadi and Omid, Reference Mohammadi and Omid2010) and expressed as follows:
 $$\begin{eqnarray}&&{\rm{Y}} = {\rm{f}}({\rm{x}}){\rm{exp}}({\rm{u}}).\end{eqnarray}$$
This can be expressed in the following equations:
 $$\begin{eqnarray}
{\rm{Y}} &=& {\rm{ax}}_1^{{{\rm{b}}_1}}x_2^{{{\rm{b}}_2}} \ldots \ldots \ldots \ldots \ldots {\rm{x}}_{\rm{n}}^{{{\rm{b}}_{\rm{n}}}}{\rm{e,}}
\end{eqnarray}$$
where x1, x2. . . . . . . . . . . . . . ..and xn are different inputs applied in the experiment; ‘a’ is constant (means the amount of output which can be achieved without application of any of the inputs); ‘e’ is the error term; b1, b2. . . . . . . . ...and bn are output elasticity of production factors/inputs), which measures the response of output to a change in the levels of any input. For example, if, b1 = 0.20, a 1% increase in input x1 would lead to approximately a 0.20% increase in output. Further, b1 + b2 +. . . . . . . . ...+ bn = Return to scale.
If, b1 + b2 +. . . . . . . . ...+ bn = 1, the production function has constant return to scale (CRTS). This means, if, x1, x2. . . . . . . . . . . . . . ..and xn are increased by 20%, the production will also increase by 20%.
But, if, b1 + b2 +. . . . . . . . ...+ bn < 1, there is decreasing return to scale (DRS), and, if, b1 + b2 +. . . . . . . . ...+ bn > 1, there is increasing return to scale (IRS).
The last equation can be expressed explicitly in the following form:
 $$\begin{eqnarray}
{\rm{In}}\,{{\rm{Y}}_{\rm{i}}} &=& {\rm{a}} + \sum\nolimits_{j = 1}^n {{{\rm{a}}_{\rm{j}}}{\rm{In}}} ({{\rm{X}}_{{\rm{ij}}}}) + {{\rm{e}}_{\rm{i}}} \cdot {\rm{i = 1,2,3}} \ldots \ldots \ldots \ldots .{\rm{n,}}
\end{eqnarray}$$
where ‘Yi’ denotes the yield of ith treatment combination, ‘Xij’ the vector of inputs used in the production process, ‘a’ is constant, ‘αj’ represent coefficients of inputs, which are estimated from the model and ‘ei’ is the error.
In case of energy output, if we do not apply an input energy, the output energy can be assumed to be zero (Singh et al., Reference Singh, Mishra, Nahar and Ranjan2003). In that case, it can be rewritten as
 $$\begin{eqnarray}
{\rm{In}}\,{{\rm{Y}}_{\rm{i}}} = \sum\nolimits_{j = 1}^n {{{\rm{a}}_{\rm{j}}}{\rm{In}}} ({{\rm{X}}_{{\rm{ij}}}}) + {{\rm{e}}_{\rm{i}}} \cdot {\rm{i = 1,2,3}} \ldots \ldots \ldots \ldots \ldots .{\rm{n}}{\rm{.}}
\end{eqnarray}$$
In this study, the common inputs for all treatments were same except the S and irrigation. For estimating relationship between two inputs (S and irrigation) and mustard yield, Cobb–Douglas production function was utilized in the following forms:
 $$\begin{eqnarray}
{\rm{In}}\,{{\rm{Y}}_{\rm{1}}} = {{\rm{\beta }}_{\rm{1}}}{\rm{In}}({{\rm{X}}_{\rm{1}}}) + {{\rm{\beta }}_{\rm{2}}}{\rm{In}}({{\rm{X}}_{\rm{2}}}) + {{\rm{e}}_{\rm{1}}}
\end{eqnarray}$$
 $$\begin{eqnarray}
{\rm{In}}\,{{\rm{Y}}_{\rm{2}}} = {\gamma _1}{\rm{In}}({{\rm{X}}_{\rm{1}}}) + {\gamma _2}{\rm{In}}({{\rm{X}}_{\rm{2}}}) + {{\rm{e}}_{\rm{1}}},
\end{eqnarray}$$
where Y1 and Y2 are energy output and mustard yield, respectively.
Sensitivity analysis was done by using the marginal physical productivity (MPP) technique (Pishgar et al., Reference Pishgar, Keyhani, Rafiee and Sefeedpary2011), which indicates the change in the output with a unit change in the input factor, while remaining all other factors constant at their geometric mean level (Ghahderijani et al., Reference Ghahderijani, Komleh, Keyhani and Sefeedpari2013). The MPP value was estimated by using the ‘αj’ of the various energy inputs as follows:
 $$\begin{eqnarray}
{\rm{MP}}{{\rm{P}}_{{\rm{xj}}}} &=& \frac{{{\rm{GM}}({\rm{P}})}}{{{\rm{GM}}({{\rm{E}}_{\rm{j}}})}} \times {{\rm{\alpha }}_{\rm{j}}} = \frac{{{\rm{GM}}({\rm{Y}})}}{{{\rm{GM}}({{\rm{E}}_{\rm{j}}})}} \times {{\rm{\alpha }}_{\rm{j}}},
\end{eqnarray}$$
where ‘MPPxj’ is marginal physical productivity of jth input, ‘αj’ the regression coefficient of jth input, GM(Y), geometric mean of yield or energy input and GM(Xj), geometric mean of jth input energy per hectare.
To examine the presence of auto-correlation in the residuals of regression analysis and to measure the likelihood of prediction of the future outcome by the model, Durbin–Watson statistics were used (Ghasemi et al., Reference Ghasemi, Keyhani, Mohammadi, Rafiee and Akram2010).
Statistical analysis
All calculations were carried out using Excel 2010 and SPSS 18 computer software. Mustard seed and stover yields were analysed statistically using the analysis of variance (ANOVA) technique for split plot design. The ANOVA of mustard yield across the years revealed a non-significant variation between the years, between the treatments and due to year × treatment interactions at p ≤ 0.05. Therefore, the mean yield data of two years have been presented. The significant difference between treatment means was tested by Tukey's Honest Significant Difference (HSD) test at p ≤ 0.05. Regression equations for mustard yields across the S doses in 2010–11, 2011–12, as well as for two-year mean yields have been determined using STATISTICA ver. 10 software. For this, mustard seed yield at the respective S dose was averaged over the yield values obtained in three irrigation levels and three replications (~9 observations) and regression lines were drawn.
RESULTS
Productivity and profitability of mustard
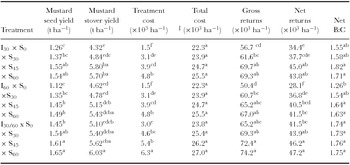
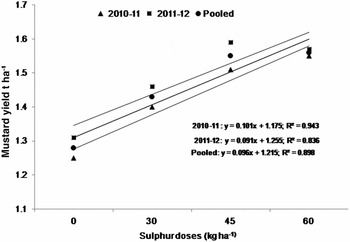
It was observed that irrigation at 30 DAS irrespective of the S levels applied (0 to 60 kg S ha−1) resulted in higher mustard seed yield, gross and net returns and net B:C than those obtained in irrigation at 60 DAS (Table 2). But, two irrigations at 30 and 60 DAS was more efficient, resulting in higher values of yield, gross and net returns and net B:C than those obtained in single irrigation at 30 or 60 DAS at the respective S levels. The two irrigations applied at 30 and 60 DAS when combined with 60 kg S ha−1 resulted in higher mustard yield and gross and net returns than those in all other combinations of treatments. The gross and net returns of this specific combination of treatments were 30.9 and 37.2% higher than that in single irrigation at 30 DAS with no S application, and 47.2 and 68.0% higher than that in single irrigation at 60 DAS with no S application, respectively. Mustard seed yield due to S application was increased up to 45 kg S ha−1 with single irrigation at 30 DAS, while up to 60 kg S ha−1 with single irrigation at 60 DAS or with irrigations applied at both 30 and 60 DAS, but yields for 45 and 60 kg S ha−1 were statistically similar. Mustard stover yield followed almost similar trend. Net B:C increased with increasing levels of S up to 45 kg ha−1 in almost all irrigation treatments. Regression analysis indicates that the application of S contributed significantly towards augmenting mustard yield (Figure 2). The R2 values (~0.943, 0.836 and 0.898, respectively) imply that about 94.3, 83.6 and 89.8% of mustard seed yield was explained by or attributed to S application in 2010–11, 2011–12 and for pooled yields, respectively.
Mustard productivity and economics as affected by levels of irrigation and sulphur (mean of two years).

I30 – one irrigation at 30 DAS; I60 – one irrigation at 60 DAS; I30/60 – two irrigations at 30 and 60 DAS; S0 – no sulphur; S30 – 30 kg S ha−1; S5 – 45 kg S ha−1; S60 – 60 kg S ha−1.
‡ Total cost = (common cost + treatment cost). Common cost of cultivation for all treatments was Rs. 20.77 × 10³ ha−1; 1 USD = Rs. 60.95. Means followed by a different letter are significantly different at p ≤ 0.05 by Tukey's HSD (honest significant difference) test.
Regression between sulphur doses and mustard seed yield [mean of 9 observations (3 three irrigation levels × 3 replications)].

Greenhouse gases (GHGs) emissions
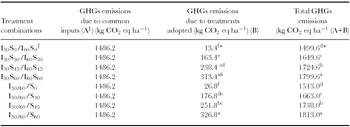
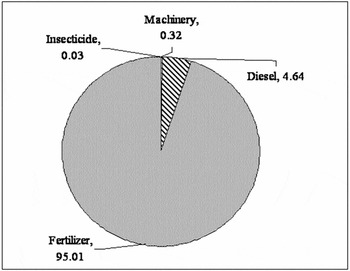
The results of LCA of mustard production (Table 3) showed that the estimated GHGs emissions from common inputs was same (1486.2 kg CO2 eq ha−1) for all treatments, but was increased with increasing levels of irrigation and S. Similarly, the estimated GHGs emissions were lower from single irrigation at 30 or 60 DAS than two irrigations at 30 and 60 DAS at all S levels. Assessment of per cent contribution of different inputs towards GHGs emissions (Figure 3) revealed that fertilizer alone contributed 1412 kg CO2 eq ha−1 (~95.01% of the total emission), followed by diesel (4.64%) used.
Estimated greenhouse gases (GHGs) emissions in mustard as affected by the levels of irrigation and sulphur application (mean of two years).

† GHG emissions from I30 × S0 and I60 × S0 were same; similarly, the emission values were same for I30 × S30 and I60 × S30; for I30 × S45 and I60 × S45; and for I30 × S60 and I60 × S60.
‡ Common inputs included machinery, diesel fuel, fertilizer (N, P2O5 and K2O) and insecticide.
* Means followed by a different letter are significantly different at p ≤ 0.05 by Tukey's HSD (honest significant difference) test.
GHGs emission from common inputs in mustard in I30/60 + S60.

Econometric model and sensitivity analysis
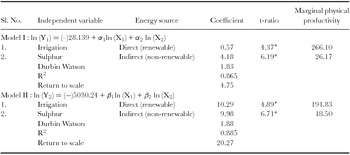
The relationship worked out for energy output and mustard yield in response to irrigation and S application revealed that the coefficient value (Table 4) was higher for irrigation in model II, but for S in model I. The t-ratio was significant at p ≤ 0.01 for both models. The MPP was higher for irrigation than for S in both the models.
Econometric estimation and sensitivity analysis of mustard production with respect to energy output (Model I) and seed yield (Model II).

* Significant at 1% level; for estimating the econometrics, sulphur and irrigation were considered for energy input, while output energy was calculated considering the economic produce, i.e. seed. For estimating the energy value, quantity of different inputs and output were converted to energy by multiplying the respective energy equivalents as per Mittal et al. (Reference Mittal, Mittal and Dhawan1985) (for mustard seed) and Jackson et al. (Reference Jackson, Hanjra, Khan and Hafeez2011) (for electricity, electric motor and S fertilizer).
DISCUSSION
Productivity and profitability of mustard
Mustard can tolerate moisture stress vis-à-vis respond well to irrigations and nutrients applications. Irrigations and nutrients interact significantly with each other (Das and Yaduraju, Reference Das and Yaduraju1999). One or two irrigations at the critical stages can cause a significant increase in mustard yield (Ehsanullah et al., Reference Ehsanullah, Prasad and Prasad1991; Bharati et al., Reference Bharati, Prasad and Singh2003). This study corroborated this. Mustard crop responded well to irrigation as well as to S fertilization in this study (Table 2). Irrespective of S levels, early irrigation at 30 DAS was more beneficial to mustard yield than late irrigation at 60 DAS. Mustard was sown in the first week of October and there was enough rainfall in the first to third week of October (Figure 1) in both the years. Besides, irrigation for 30 DAS was applied in the first week of November. This supplied ample moisture initially up to 40–45 DAS, which boosted up mustard seedling growth and caused an increase in mustard yield. Besides, the early irrigation at 30 DAS facilitated better roots growth, reaching deeper in soil that tolerated/mitigated moisture stress later. On the contrary, under late irrigation at 60 DAS treatment, mustard plants might have experienced moisture stress during 30–60 DAS period. Irrigation applied at 30 and 60 DAS, however, eliminated the stress effects during 30–60 DAS period and later, and provided higher yield, gross and net returns and net B:C than those in single irrigation at 30 or 60 DAS. The status of N, P and K being medium in the experimental field, the applications of these nutrients played roles towards higher vegetative and reproductive growth and influenced the response of mustard crop to S, albeit these effects remained uniform at all the doses of S. The interactions of S with N, P and K could not be evaluated in this study, but seemingly played roles.
The time and frequency of irrigation further influenced the response of mustard to S. Mustard, with respect to seed yield and gross and net returns responded up to 45 kg S ha−1 when irrigation applied at 30 DAS, but the response was up to 60 kg S ha−1 when irrigation was applied at 60 DAS or at both 30 and 60 DAS (Table 2). Both the 45 and 60 kg S ha−1 at respective irrigation level (i.e. at I30, I60 or I30/60), however, were statistically similar on mustard yields. The increase in mustard yield irrespective of S levels was more with I30/60 than at I30 and I60. This clearly reflected the beneficial effects of two irrigations at the critical flower initiation and siliqua development stages of mustard compared with single irrigation at either stage. The increase in seed yield resulted in increased gross and net returns and net B:C. Thus, the economics was governed, mainly, by seed yield, and the seed yield was influenced by irrigation x S interaction. Two irrigations at 30 and 60 DAS with 60 kg S ha−1 gave higher gross returns by 30.9% and net returns by 37.2% over single irrigation at 30 DAS without S application. Similarly, the corresponding values for increase in gross and net returns were 47.2 and 68.0% compared to single irrigation at 60 DAS without S application. Several workers (Bhagat and Soni, Reference Bhagat and Soni2000; Piri et al., Reference Piri, Nik, Tavassoli, Rastegaripour and Babaeian2011) have reported similar results. The increase in seed yield could be due to an increase in the level of S application and irrigation regime. Contrary to no rainfall received in second year, a little rainfall of 0.7 and 2.2 mm coincided with the first (at 30 DAS) and second irrigation (at 60 DAS), respectively in first year (Figure 1), had negligible or no effects on the irrigated mustard crop. Similarly, in the month of January, rainfall (20 and 37 mm during first and second week, respectively) received in second year or no rains in the first year had hardly any effect on mustard yield across the irrigation regimes as the mustard crop reached to almost maturity by that period.
Greenhouse gases emissions
Fertilizer (N, P, K and S) was major contributor of GHGs (mainly, CO2, N2O) emissions (95%) in this study (Figure 3). Applying fertilizers, particularly N fertilizers more than what crop plant needs, results in more GHGs emission (Ghahderijani et al., Reference Ghahderijani, Komleh, Keyhani and Sefeedpari2013). The use of diesel that incurs higher energy and contributes to GHGs emissions should be substantially reduced by using energy-efficient tractor/machinery, and not using worn-out tractors (Pishgar et al., Reference Pishgar, Keyhani, Rafiee and Sefeedpary2011); and adopting conservation agriculture with zero/minimal tillage. Zero/minimal till mustard has been successfully demonstrated (Personal communication: Dr. T. K. Das, Indian Agricultural Research Institute, New Delhi). Irrigation using groundwater and pressurized systems is a C-intensive process, contributing to GHGs emission. Electricity (in place of diesel) can also significantly and positively contribute to GHGs emission (Jackson et al., Reference Jackson, Hanjra, Khan and Hafeez2011). Heterotrophic fungi and bacteria capable of oxidizing elemental S represent 3–37% of the total heterotrophic populations in soils. These microorganisms also respire by emitting CO2. Therefore, it is obvious that oxidation of elemental S to SO4 2− is a C-intensive process, which might be the reason for increased GHGs emissions from soil with increasing S doses. Therefore, application of elemental S may be compared with that of equivalent amount of ZnSO4 or CaSO4 application in terms of balances on economics, energy and GHGs emissions in mustard.
Econometric model and sensitivity analysis
The Cobb–Douglas production function was used to determine the relationship of energy inputs (i.e. irrigation and S) with energy output and mustard yield. It predicted that 1% growth in using irrigation and S for mustard production would lead to 0.57 and 4.18% increase in output energy (through model I), and 10.29 and 9.98% increase in mustard yield (through model II), respectively (Table 4). Through regression analysis, the value of variance of dependent variable is explained on the basis of independent variable called explained variance or R2 (Shabani et al., Reference Shabani, Rafiee and Mobli2012). The R2 values (0.865 and 0.885) indicated that 86.5% changes of energy output (through model I) and 88.5% changes of mustard yield (through model II) were dependent on energy inputs (mainly, irrigation, S along with machinery, fuel and human). Auto-correlation was studied through heteroscedasticity test. The Durbin–Watson values, 1.83 and 1.88, respectively for model I and model II indicated that there was no auto-correlation in these two models.
The sum of output elasticity of production inputs were greater than 1, which implied that there was IRS for the models. If energy inputs were increased to the tune of 4.75 (model I) and 20.27% (model II), the output energy and mustard yield would be increased up to 4.75 and 20.27%, respectively. The MPP values for irrigation and S were 266.10 and 26.17 in model I, whereas 191.83 and 18.50 in model II. It specified that 1 MJ further use of energy inputs like irrigation and S would increase 266.10 and 26.17 MJ of energy output, respectively and 191.83 and 18.50 kg ha−1 of mustard yield, respectively.
CONCLUSION
Results show that two irrigations applied at 30 and 60 DAS with 60 kg S ha−1 resulted in highest mustard seed yield, resulting in higher gross and net returns and net B:C in mustard. This irrigation and S levels would also have more GHGs emissions in mustard, estimated in this study. In fact, greater share of the non-renewable energy sources [~fertilizers (NPKS), diesel/ machinery, insecticides] would lead to more GHGs emissions. Their use should be judiciously reduced using alternative energy sources and agronomic/cropping practice such as conservation (zero or minimal) tillage with residue retention. The use-efficiencies of these inputs need to be enhanced as well. The energy output and mustard yield predicted through Model I and II were greatly influenced by different energy inputs.
Acknowledgement
The authors are grateful to Bidhan Chandra Krishi Viswavidyalaya, West Bengal, India for providing necessary technical and financial support during the course of investigation.