Introduction
In ruminants, herbage and faecal alkanes are used to estimate intake and diet composition (Mayes et al., Reference Mayes, Lamb and Colgrove1986; Dove and Mayes, Reference Dove and Mayes1991). Alkanes are not fully recovered in faeces, and faecal recovery increases in a curvilinear fashion with chain length. Resultingly, alkane concentrations in faeces have to be corrected for their faecal recovery before such data can be used to estimate diet composition (Dove and Mayes, Reference Dove and Mayes1991; Brosh et al., Reference Brosh, Henkin, Rothman, Aharoni, Orlov and Arieli2003).
There are few direct comparisons of the faecal alkane recovery of plant wax alkanes from various roughage species. In cattle, slight differences between roughage species were observed (Ohajuruka and Palmquist, Reference Ohajuruka and Palmquist1991; Hendricksen et al., Reference Hendricksen, Reich, Roberton, Reid, Gazzola, Rideout and Hill2002; Moshtagi Nia and Wittenberg, Reference Moshtagi Nia and Wittenberg2002), and in sheep, Lin et al. (Reference Lin, Luo, Zhang and Shu2007) found an effect of herbage species on faecal alkane recovery. Although Elwert et al. (Reference Elwert, Dove and Rodehutscord2006) reported numerical differences in faecal alkane recovery between various roughages in sheep, these were not statistically significant due to large between-animal variation. Dove and Oliván (Reference Dove and Oliván1998) found that the introduction of a beeswax-labelled supplement to a roughage-only diet did not affect alkane recoveries. By contrast, Elwert and Dove (Reference Elwert and Dove2005) reported that labelled supplement significantly reduced the faecal recovery of alkanes. They assumed this effect to be due to the beeswax and not due to the supplement itself. This was supported by the observations of Elwert et al. (Reference Elwert, Kluth and Rodehutscord2004), who had found similar faecal alkane recoveries in diets with varying proportions of supplement but equal amounts of beeswax.
As suggested by Mayes and Duncan (1999), diet composition studies can yield estimates of intake if the intake of at least one of the components is known. Estimates of diet composition require (i) alkane profiles for all potential dietary components, (ii) faecal alkane concentrations and (iii) estimates of faecal alkane recoveries (Dove and Mayes, Reference Dove and Mayes1991; Brosh et al., Reference Brosh, Henkin, Rothman, Aharoni, Orlov and Arieli2003). Most commonly, the component of known intake is a supplement, which can be labelled with alkanes (for instance, beeswax) if it does not contain sufficient natural alkanes (Dove and Oliván, Reference Dove and Oliván1998). This approach of estimating roughage intake by feeding a known amount of labelled supplement has been validated for diets containing a single roughage component (Dove et al., Reference Dove, Scharch, Oliván and Mayes2002b; Elwert et al., Reference Elwert, Kluth and Rodehutscord2004; Elwert and Dove, Reference Elwert and Dove2005) as well as for diets containing up to four roughage components (Dove et al., Reference Dove, Charmley and Kleven2003; Charmley and Dove, Reference Charmley and Dove2007).
An experiment was conducted with sheep to study the effect of diet composition (several roughages in single or mixed diets with or without beeswax-labelled supplement) on faecal alkane recoveries. Subsequently, the effect of faecal alkane recovery on the estimate of diet composition as a possible basis for estimating intake was investigated.
Material and methods
Animals and diets
The experiment was carried out at the Research Centre for Animal Sciences, Merbitz, University of Halle-Wittenberg, Germany, from October to December 2002. It was approved by the University’s Animal Welfare Committee and conducted in accordance with current legislation.
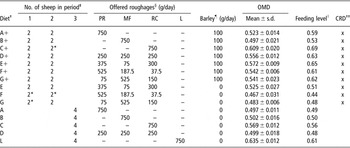
Twenty adult wethers of the Rauhwolliges Pommersches Landschaf breed (mean ± standard deviation (s.d.) initial live weight 69.5 ± 4.0 kg) were kept individually in balance crates for three consecutive experimental periods. The sheep were fed once daily at 0900 h and had unrestricted access to water. The sheep were randomly assigned to one of 10 diets in the first two experimental periods (two sheep per diet per period), and in the third period of the study the sheep were allocated to another five diets (four sheep per treatment).
Diets on offer consisted of a total amount of 750 g air-dry roughage and, where applicable, additionally 100 g of supplement. Lolium perenne (perennial ryegrass – PR), Festuca pratensis (meadow fescue – MF) and Trifolium pratense (red clover – RC) were fed either as single roughage components or in four mixes of varying proportions of all three species (g/day PR : MF : RC 250 : 250 : 250, 375 : 75 : 300, 525 : 187.5 : 37.5, 75 : 525 : 150; see Table 1). MF and PR were straws from seed production and therefore had low nutritive values (6.9 and 7.4 MJ metabolisable energy (ME) per kg dry matter (DM); Deutsche Landwirtschafts-Gesellschaft (DLG), 1997). The straw was chaffed, during which a separation of straw and extremely fine particles (‘dusty material’) could not be avoided. The RC was an undersown crop in barley; the first RC cut was harvested, dried in a grass drier and pelleted. The pellets contained a small proportion of barley stubble but the whole batch of pellets was homogeneous in its composition and was regarded as the legume component of the diet. Each of the seven roughage treatments was fed both without and with a supplement of 100 g (air-dry) rolled barley. The resulting diets were encoded A to G and A+ to G+, respectively (Table 1). To widen the range of available data on faecal alkane recoveries from single-species diets (e.g. Elwert et al., Reference Elwert, Dove and Rodehutscord2006), pelleted Medicago sativa (lucerne – L) was included as a fourth single-species diet. Data for lucerne are discussed only in relation to faecal alkane recovery and are not included in any further analysis.
Diet composition (air-dry matter), organic matter digestibility (OMD) and level of feeding, as well as administration of controlled release devices (CRD)

† The letter indicates the composition of the roughage component of the diet, ‘+’ indicates the inclusion of barley.
‡ An asterisk indicates one sheep to be excluded from the data set (mostly due to excessive refusals).
§ PR = perennial ryegrass; MF = meadow fescue; RC = red clover; L = lucerne.
¶ Rolled barley, beeswax-labelled.
∥Level of feeding: 1 = maintenance (9.8 MJ ME per day for sheep of 65 kg live weight calculated according to DLG, 1997).
††CRD administered in the experimental periods 1 and 2.
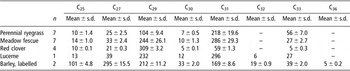
Because the rolled barley contained only low concentrations of alkanes (2.3, 6.0 and 4.0 mg/kg organic matter (OM) for C27, C29 and C31, respectively), it was labelled with beeswax (12 g beeswax per kg barley). The beeswax was melted and diluted with heptane and sprayed under continuous mixing onto the barley using a compressed-air paint sprayer (Elwert et al., Reference Elwert, Kluth and Rodehutscord2004). Labelling the barley with beeswax yielded very similar alkane concentrations to those obtained by Elwert et al. (Reference Elwert, Kluth and Rodehutscord2004) with labelled wheat. Alkane concentrations of all dietary components (PR, MF, RC, barley) were very distinct from each other (Table 2), which was confirmed by a principal component analysis. Dietary components differed significantly in the alkane profile, in both the first (P < 0.01) and the second (P < 0.05) principal components. Overall, differences between components accounted for 87% of the total variance in alkane concentration.
Average alkane patterns of dietary components (mg/kg organic matter)

Diets fed in the first two experimental periods were single roughage species (PR, MF, RC) supplemented with barley, roughage mixes with barley supplement, and the latter three mixes without barley (Table 1). At the end of the 1st week of the adjustment period of periods 1 and 2, all sheep were dosed with an intra-ruminal alkane controlled-release devices (CRD; Captec Nufarm Health and Sciences, Auckland, New Zealand) in order to determine the faecal recovery of synthetic dosed alkanes as compared with native roughage and beeswax alkanes. The CRD contained a total of 973 and 983 mg of C32 and C36, respectively, and had suggested delivery period of approximately 20 days. The daily release rate of the two alkanes was calculated from the manufacturer-stated content and the lifetime of the CRD of 20 days, which was experimentally confirmed by spot-sampling faeces from four randomly selected sheep until day 25 after CRD insertion. Thus, CRD release rates were 48.65 and 49.15 mg/day for alkanes C32 and C36, respectively. No CRD were used in the last experimental period, since the empty CRD usually remain in the rumen, and it was decided to administer a maximum number of two CRD capsules per animal. Therefore, diets tested in the third collection period were single-species PR, MF, RC (diets A, B, C), the 1 : 1 : 1 mix of the three species (diet D) and lucerne pellets (diet L).
Sampling procedures, sample preparation and alkane analysis
The animals were fed the experimental diets for an adjustment period of 12 days. The daily roughage allowance of every diet was weighed out into plastic bags for several days in advance. When diets were weighed out for the collection period, samples of each component were taken. Due to the large amount of feed processed, several separate samples of each component were taken. Similarly, samples of the labelled barley were taken at the time of weighing out. DM was determined by drying at 65°C for 48 h. Refusals were collected daily, dried (65°C for 48 h) and bulked for each sheep and collection period until further processing. Refusal recording started and ended 1 day before faeces collection started and ended, respectively.
On day 11, faeces collection bags were fitted to each animal to allow total faeces collection. On day 12, at 0700 h, the faeces bags were emptied, the faeces discarded and the collection period started. From day 13 for a period of 6 days consecutively, the faeces bags were emptied at 0700 h. The weight of the faeces was recorded, and, after thorough mixing, representative samples of 10% were taken in duplicate and dried (65°C for 48 h). After determination of DM, samples of each individual animal were bulked for the 6-day collection period.
Samples of dietary components, refusals and faeces were ground to pass a 1-mm sieve and stored at room temperature until alkane analysis.
The extraction of alkanes, gas chromatography analysis and the calculation of alkane concentrations was carried out using the procedures described in detail by Elwert et al. (Reference Elwert, Kluth and Rodehutscord2004). In the present study, the barley was labelled with beeswax, which contained considerable amounts of C24 and C34, the internal standards used in alkane analysis. The concentration of C24 and C34 in the labelled barley was as high as 27 and 11 mg/kg OM, respectively. Although only a small proportion of beeswax-labelled supplement was introduced to the diet, not only the barley samples but also all faeces samples of animals that had received a diet containing barley were corrected for the contributions of C24 and C34 alkanes from the beeswax. The correction was based upon the proportions of native C24 and C34 relative to C27 in beeswax-labelled barley and the proportion of barley in the diet. From this information and the peak area of C27, the peak areas of C24 and C34 caused by the beeswax-labelled barley were determined and subtracted from the total peak areas for C24 and C34. The remaining areas were then attributed to the internal standard. Details of this arithmetical correction were given by Elwert et al. (Reference Elwert, Kluth and Rodehutscord2004).
Calculations and statistical analysis
Faecal alkane recoveries
Faecal alkane recoveries were calculated as the proportion of ingested alkane, which was recovered in faeces. Herbage samples were considered separately for each collection period and for individual diets.
Faecal alkane recoveries from single-species diets A, B, C and L were compared and tested for equality using a generalised linear model of analysis of variance (ANOVA) taking account of the fixed effect of ‘dietary treatment’ only.
Further analysis of faecal alkane recoveries focussed on the effects of the composition of the dietary roughage component and barley inclusion on alkane recovery, therefore data for the pure lucerne (diet L) were not considered any further.
In order to ensure similar daily intakes and to avoid excessive feed refusals, the sheep were fed at sub-maintenance levels (0.44 to 0.69 × maintenance). Therefore, and because the animals were allowed to adjust to the diets for 12 days, no carry-over effect from the diet of the previous experimental period was expected in periods 2 and 3. This was confirmed by a preliminary statistical analysis. Therefore, the generalised linear model took into account the fixed effects of ‘roughage composition’ and ‘barley inclusion’, and their interaction.
The faecal recovery of dosed alkanes C32 and C36 was statistically analysed using a one-factorial ANOVA taking into account the fixed effect of ‘dietary treatment’ only. A consideration of ‘roughage composition’ and ‘barley inclusion’ was not possible, since diets A to D had to be excluded from that analysis because of the lack of the respective alkanes in faeces (no CRD administered).
Estimate of diet composition
Diet composition was estimated using a non-negative least squares procedure in the software ‘EatWhat’ (Dove and Moore, Reference Dove and Moore1995) and was based upon the natural alkanes C25, C27, C29, C30, C31 and C33. Faecal alkane concentrations were corrected for their incomplete recovery. For each alkane in the present study, this correction was based either upon the general mean across all diets or upon dietary means. The variation of alkane concentration in repeated samples of the dietary components (Table 2) was considered a simulation of varying composition of dietary components (for instance, varying leaf–stem ratio). Therefore, the estimate of diet composition was based either upon the mean across all samples of a roughage or upon that roughage sample, which was linked to the respective diet at the stage of the calculation of faecal alkane recoveries. Thus, two methods of estimation were compared, which differed in the quality of their information:
LO – low level of specific information; general faecal alkane recovery across diets, mean of all samples of the respective roughage
HI – higher level of specific information; dietary faecal alkane recovery, individual roughage samples as for calculation of faecal alkane recovery
Approach LO represents the current situation in grazing experiments, where it is difficult to determine alkane recoveries in individual animals. Information processed in approach HI is more laborious and complicated to obtain under grazing conditions, whereas it is commonly available in feeding studies with individually penned animals.
The accuracy of the estimate of diet composition was assessed from linear regression analysis of estimated proportions over actual proportions of the individual component across diets.
When total intake is estimated from estimates of diet composition and a knowledge of the amount of supplement fed, an accurate estimate of the proportion of supplement is necessary. Therefore, diets that contained barley were investigated further. Statistically, a t-test for paired comparisons of actual and estimated proportion of barley in the diet was applied. However, to determine the magnitude of the estimation error and its practical implications, the accuracy of estimated proportion of barley was compared with actual proportions using absolute and relative differences (mean difference (MD) and mean relative difference (MRD)) and prediction errors (mean prediction error (MPE) and mean relative prediction error (MRPE)), which were calculated as outlined in detail by Elwert and Dove (Reference Elwert and Dove2005). Mean absolute and relative prediction errors are equivalent to the mean discrepancies as calculated by Dillon (1993).
In an attempt to assess the accuracy of the estimate of diet composition as a whole, the parameter distance (see Elwert and Rodehutscord, Reference Elwert and Rodehutscord2005a and Reference Elwert and Rodehutscord2005b) was applied. The distance between estimated and actual diet composition was calculated as the square root of the sum of the squared differences between estimated and actual proportion of each component. The smaller the value, the higher is the degree of similarity of estimated and actual diet composition.
All statistical analyses were performed using the software package of the Statistical Analysis Systems Institute (2001). All tests were based upon the differences of LSMeans or modelled using the ESTIMATE statement. Adjustments for multiple comparisons were made using either Tukey (balanced data), Tukey–Kramer (unbalanced data) or Bonferroni (estimated differences) to accommodate a type I experimentwise error rate of P ⩽ 0.05.
Results
Faecal alkane recoveries
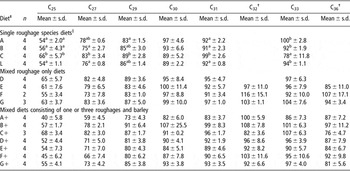
Faecal alkane recoveries for each dietary treatment are presented in Table 3 and results of the statistical analysis are given in Table 4. Alkane recoveries increased with increasing chain length. For single-species diets, no significant difference (P > 0.05) could be detected between diets A (PR), B (MF) and L (lucerne). Diet C (RC) had significantly (P ⩽ 0.05) higher faecal recoveries than all other single-species diets for alkanes C25 and C31. RC also showed a significantly (P ⩽ 0.05) higher faecal recovery for alkane C27 in comparison to diets B and L, and for alkane C29 in comparison to diet A. By contrast, the RC had the lowest recovery rate of C33 (P ⩽ 0.05); no difference could be detected for C30.
Faecal recoveries (mean ± s.d.) of native dietary alkanes (including alkanes from beeswax-labelled barley) and synthetic alkanes originating from the controlled release devicesFootnote †

† Intra-ruminal controlled release devises, releasing alkanes C32 and C36. Release rates (mg/day) calculated from manufacturer-stated amount of alkanes contained in the controlled release devices and experimentally determined lifetime.
‡ Diets A, B, C and L encode perennial ryegrass (PR, chaffed straw), meadow fescue (MF, chaffed straw), red clover (RC, pelleted) and lucerne (pelleted), respectively. Diets D, E, F and G were mixes of PR, MF and RC in the proportions of 250 : 250 : 250, 375 : 75 : 300, 525 : 187.5 : 37.5, 75 : 525 : 150, respectively. A ‘+’ indicates the inclusion of a fixed amount of beeswax-labelled barley into the diet.
§ Different superscript letters within a column indicate statistically (P ⩽ 0.05) different faecal recoveries between single roughage diets.
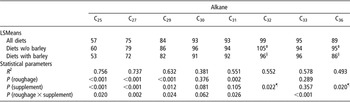
Faecal recoveries (%) of native and dosed alkanes averagedFootnote † for the whole experiment and for groups with and without beeswax-labelled barley in the diet as well as results of analysis of variance

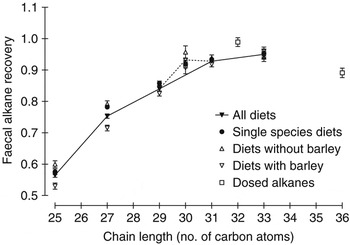
Analysing the 14 diets consisting of PR, MF, RC and barley, faecal recoveries averaged 0.56, 0.75, 0.84, 0.93, 0.93 and 0.95 (standard error 0.007, 0.007, 0.006, 0.014, 0.006 and 0.010) for naturally occurring alkanes C25, C27, C29, C30, C31 and C33, respectively (Figure 1). The composition of the roughage component of the 14 diets proved highly significant for all alkanes but C30 and C33. The effect of beeswax-labelled barley supplementation on whole-diet faecal alkane recovery was significant (P ⩽ 0.012) for C25, C27 and C29 but only approached significance (P = 0.081) for C30; it was not significant for C31 and C33 (P > 0.1; see Table 4). However, across all alkanes, the interaction between roughage composition and barley supplementation was significant or close to significance. As can be seen in Table 3, the faecal alkane recovery varied considerably between diets. When pairs of diets were compared which were equal in their roughage composition (seven comparisons per alkane), diets A and A+ differed significantly (P ⩽ 0.006) in the recoveries of all alkanes but C30, diets C and C+ differed in C33 (P ⩽ 0.001) and diets D and D+ differed in C25 and C27 (P ⩽ 0.003). Also, a tendency was observed for diets G and G+ in C27.
Faecal recovery (mean ± standard error) of natural and dosed alkanes in relation to alkane chain length.

Synthetic alkanes C32 and C36 originating from the CRD averaged faecal recoveries of 0.99 and 0.89, respectively (Table 4). When means of diets with and without barley supplementation (E+, F+, G+, and E, F, G, respectively; see Table 1 for diet composition) were compared, significant differences were detected for both alkanes (P ⩽ 0.02).
Estimate of diet composition
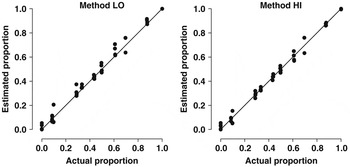
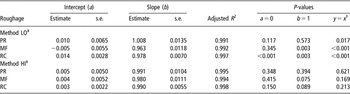
In Figure 2, the linear regressions of estimated on actual PR proportion across all 14 diets under LO and HI calculation methods are shown as an example for all roughages. Table 5 lists the respective linear regression parameters for each of the three roughages separately for the two methods of estimation. As indicated by the high R 2 across all six regressions, the data points are very close to a straight line. Also, the slopes are very close to 1.0, the deviations ranging from −0.037 to 0.008 for method LO and from −0.009 to −0.020 for method HI. The supremacy of the higher accuracy of information (method HI: dietary information) on the results of estimating diet composition as compared with lower accuracy information (method LO: overall average values) can be seen when testing the linear regression parameters against y = x. None of the three regressions in method HI differed from the line of equality (simultaneous test of intercept = 0 and slope = 1; Table 5), whereas in method LO all three regressions did differ from equality despite the fact that, when tested separately, in some cases either the intercept (MF) or the intercept and the slope (PR) did not differ from 0 and 1, respectively.
Linear regressions of estimated v. actual proportions of perennial ryegrass across all 14 diets. Individual values are shown for estimation approaches LO and HI (see text for definitions) and the line of equality (x = y).

Linear regression parameters across all 14 diets for prediction of estimates from actual roughage proportions separately for perennial ryegrass (PR), meadow fescue (MF) and red clover (RC) for each of the two estimation methods

† Test for y = x is the simultaneous test for a = 0 and b = 1.
‡ Methods LO and HI represent low and high levels of available information, respectively, based upon alkane faecal recovery and diet component alkane concentrations (LO = overall mean; HI = dietary means).
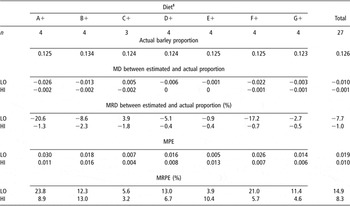
In Table 6, the differences between actual and estimated proportion of barley in the diet as well as the respective prediction errors are shown for all diets that contained barley. The t-test for paired comparisons revealed, that the proportion of barley estimated with method LO differed from the actual proportion (P = 0.004), whereas results from method HI did not differ from actual values (P = 0.59). In general, there was a tendency for underestimation of the barley proportion, which was higher in approach LO (mean −0.010, range −0.026 to 0.005) than for approach HI (mean −0.001, range −0.002 to 0.0). In relative terms, LO and HI underestimated known barley proportion by an average of −7.7% and −1.0%, respectively. For approach LO, relative differences in individual diets were in some cases as high as −17.2% and −20.6% (diets F+ and A+, respectively), whereas for approach HI relative differences ranged from −2.3% to −0.4%. MRPE was only about half as high in approach HI as it was in LO. However, there were large variations between diets (Table 6).
Accuracy of the estimates of the proportion of barley in the diet (based upon organic matter)Footnote †

† Abbreviations are: MD = mean difference; MRD = mean relative difference; MPE = mean prediction error; MRPE = mean relative prediction error.
‡ See Table 1 for diet composition.
Methods LO and HI represent low and high levels of available information, respectively, based upon alkane faecal recovery and diet component alkane concentrations (LO = overall mean, HI = dietary means).
When estimated and actual compositions of the 14 diets were compared using the parameter distance, a large variation between diets was observed. Mean distances for the two approaches LO and HI were 0.042 and 0.032, respectively, with the difference of 0.01 being significant (P = 0.03). There was no difference between diets containing barley and those not containing barley.
Discussion
Faecal alkane recoveries
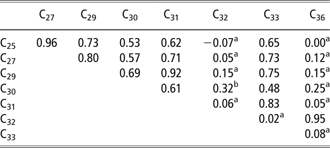
In agreement with previous studies in sheep (e.g., Mayes et al., Reference Mayes, Lamb and Colgrove1986 and 1988; Dove and Oliván, Reference Dove and Oliván1998; Dove et al., Reference Dove, Mayes, Lamb and Ellis2002a), in the present experiment the faecal recovery of alkanes increased with increasing chain length in a curvilinear pattern (Figure 1). In general, diets containing beeswax-labelled barley had lower faecal alkane recoveries than roughage-only diets (Table 3, Figure 1), although with longer-chained natural alkanes (⩾30 carbon atoms) this difference was not significant. This observation might be explained by the lower faecal recovery of beeswax alkanes, as was reported by Elwert and Dove (Reference Elwert and Dove2005), due to the weaker bond between barley and the beeswax alkanes as compared with the stronger bond between roughages and their native cuticular alkanes. Nevertheless, faecal recovery of dosed CRD alkanes was also about 10% lower in barley-supplemented diets than in roughage-only diets. Since the beeswax-labelled barley contributed almost no C36, there must have been an effect of barley supplementation on the synthetic alkanes. Herd et al. (Reference Herd, Williams, Woodgate, Ellis and Oddy1996) reported the daily release rate of CRD in cattle to depend upon diet composition which affects mainly the lifetime of a CRD and thus daily release rate. Our data do not allow an assessment of whether there was an effect on the release rate or actual absorption. However, the correlation coefficients between faecal recoveries seem to indicate that dosed alkanes behaved differently from natural alkanes in the digestive tract (Table 7). Correlation between faecal recoveries of the two dosed alkanes was as high as 0.95, whereas any correlation between a dosed and a natural alkane was <0.35. For comparison, the lowest correlation between faecal recoveries of any natural alkanes was 0.48 (C30 to C33). This low correlation between natural and dosed alkanes would cause a larger between-animal variation in intake estimates based upon the alkane double-marker technique (Mayes et al., Reference Mayes, Lamb and Colgrove1986) than what would be expected from a high correlation coefficient. However, the mean intake of a group of animals might still be estimated accurately.
Matrix for correlation coefficients of faecal recoveries of natural and dosed alkanes
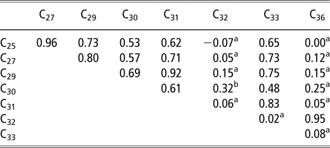
Superscript letters indicate correlation coefficient not significantly different from 0 at aP ⩽ 0.05 and bP ⩽ 0.1.
In single-roughage diets, the alkanes of PR, MF and lucerne had similar faecal recoveries. RC, however, had significantly higher faecal recoveries than one or more of the other roughages for alkanes C25, C27, C29 and C31. This observation cannot be easily explained. It did not seem to be related to the roughage type (legume) or the processing (force-dried and pelleted) as the same applied to the lucerne. Also, it is doubtful that the variation in faecal recovery between the various roughages was mainly caused by technical errors, for instance unrepresentative forage samples. The heterogeneity of PR and ML chaff was accounted for by taking more samples (n = 7) than for the pelleted (and therefore much more homogeneous) RC (n = 4). The reason for the higher faecal recovery of alkanes in RC might lie within the characteristics of cuticular waxes, which not only consist of an epicuticular wax layer (Jeffree, Reference Jeffree1986) but also of an intracuticular component that has a very close bond to the cutin matrix (Jetter et al., Reference Jetter, Schaeffer and Riederer2000). If in RC a large proportion of the alkanes are found within the intracuticular wax, then alkanes could either be incompletely extracted from roughage samples during the extraction process or, more likely, absorption of those alkanes in the gastro-intestinal tract is restricted due to the close link with the cutin matrix. The significantly lower faecal recovery of RC for alkane C33 than all other single-species diets might be caused by analytical errors arising from the very low herbage concentration (Brosh et al., Reference Brosh, Henkin, Rothman, Aharoni, Orlov and Arieli2003; Valiente et al., Reference Valiente, Delgado, De Vega and Guada2003). If the data for RC were not included, the mean faecal recovery of C33 across single-species diets was 0.95. Low herbage C30 concentrations might also have been the reason for the indifference of faecal C30 recovery from single roughage species.
Ferreira et al. (Reference Ferreira, Oliván, Garcia, Rodrigues and Osoro2005) found that there is a negative correlation between diet digestibility and faecal alkane recovery. This finding helped to explain some of the between-roughage species differences in faecal alkane recovery in sheep, reported by Charmley and Dove (Reference Charmley and Dove2007). In the present data set, diet digestibility did explain some of the variation of faecal alkane recovery between diets but also between animals within a given diet. However, although significant, this effect was of a small magnitude only (3.6% and 7.2% of the total variance for faecal recovery of C29 and C31 were explained by organic matter digestibility (OMD)). In agreement with the results of Ferreira et al. (Reference Ferreira, Oliván, Garcia, Rodrigues and Osoro2005), increasing digestibility decreased faecal recovery of alkanes.
The dosed alkane C32 was recovered in faeces in a higher proportion than natural C31 or C33, whereas the recovery of C36 was markedly lower than expected. A number of previous studies with sheep (Mayes et al., 1988; Dove et al., 1989) and cattle (Dillon and Stakelum, 1988; Dicker et al., Reference Dicker, Herd and Oddy1996; Unal and Garnsworthy, Reference Unal and Garnsworthy1999) reported a higher faecal recovery of C32 than would be expected from the extrapolation of the recoveries of other alkanes; however, in most cases the animals were dosed once or twice daily. By contrast, there are a number of reports of low faecal recoveries for dosed C36 (Unal and Garnsworthy, Reference Unal and Garnsworthy1999), and in one study (Molina et al., Reference Molina, Matamoros and Pell2004) faeces samples completely lacked C36 although it had been administered together with C32. Dove and Oliván (Reference Dove and Oliván1998) recovered natural C36 almost completely in the faeces of sheep but observed a very low recovery for dosed C38, a finding confirmed by Elwert and Dove (Reference Elwert and Dove2005).
Estimate of diet composition
As mentioned earlier, both PR as well as MF consisted of straw and extremely fine particles, the proportions of which varied between animals and days. Elwert (2004) had analysed all PR and MF samples taken and found varying proportions of particle sizes between the samples of each roughage species. This effect was more pronounced for MF than for PR. In a sense, for the purpose of the study (simulating a grazing situation with selective intake), varying proportions between straw and fine particles could be regarded as simulating a varying composition (proportions of leaf, stem, flower head/seeds) of the respective roughage ingested by individual animals. Under grazing conditions, different animals might select differently even within individual roughage species (leaf/stem) and, additionally, the selection patterns can change over days. However, investigators must usually assume one roughage sample to be representative for a whole group of animals. On this basis, the dietary proportions of roughage species is estimated with a higher accuracy when using HI than LO method (Table 5, Figure 2). For all the three roughages, a clearly linear relationship between estimated and actual proportions was evident. Some slight improvement on the accuracy of linear regression could be achieved when diet composition estimates were based upon method HI as compared with method LO.
Estimating intake from diet composition estimates
The proportion of barley in the diet was estimated more accurately using approach HI than approach LO (Table 6). As was explained by Elwert and Dove (Reference Elwert and Dove2005), MRD and MRPE are parameters to assess the accuracy of the estimation on a group level and at the level of individual animals, respectively. For groups of animals, estimated proportion of barley was close to actual proportion with the exception of diets A+ and F+ in approach LO. However, in many cases MRPE was quite high, indicating large discrepancies for individual animals. Although average MPEs of 0.019 and 0.010 (approaches LO and HI, respectively; see Table 6) seemed comparatively small on an absolute basis, if restated in relation to the actual proportion of 0.125 of barley in the diet, those errors scale to about 15% and 8%, respectively. Elwert and Dove (Reference Elwert and Dove2005) found a better agreement between estimated and known supplement proportions in a 1 : 1 roughage : supplement diet, which was probably caused by a more successful/homogeneous labelling of the supplement.
The diet composition data obtained in the present study can be used to estimate roughage intake, using the following equation:

where I and p represent intake and proportion of barley and total roughages, respectively.
Any error in the estimate of the proportion of barley in the diet thus results in an equal (in absolute terms) error in the proportion of total roughage (p roughages = 1 − p barley). Therefore, errors in the estimated proportion of barley can have a large effect on the estimated roughage intake.
From Table 6 it can be deduced that on a group basis total roughage intake would be estimated fairly well for all diets in approach HI and for more than half the diets of approach LO (diets C+, D+, E+, G+). However, the accuracy of the estimated barley proportion was expected to be better than what was observed. In order to obtain reliable results on an individual animal basis much care must be exercised when labelling the supplement.
Conclusions
Faecal recovery of alkanes might differ between individual roughages. In mixes of varying proportions of these roughages, such differences become smaller and statistically insignificant.
Daily intake can be successfully estimated from estimates of diet composition if one component (e.g. concentrate) is fed at a known daily amount.
The higher the accuracy of information available on diet component samples and faecal recovery values, the higher is the accuracy of diet composition and intake estimates. For studies focussing on groups of animals a single set of faecal alkane recovery values seemed sufficient for the estimation of diet composition across a range of mixed diets consisting of the same roughages in varying proportions.
Acknowledgements
The authors would like to thank O. Hödel and D. Barth for their skilled technical help during the animal experiments.