Implications
The degree of tear staining (TS) in pigs seems to increase with both age and growth of the pigs. Reasons for this could be: development of the secretory glands, hormonal changes, a larger body size thus filling up the pen, spending more time in a stressful environment with time or experiencing the environment as more stressful when having a higher growth rate. Both age and growth of the pigs are important to take into consideration if using TS as a welfare assessment measure in the pig.
Introduction
Tear staining (TS), that is, the accumulation of a characteristic dark red-brown stain in the medio-ventral corner of the eye, is used as an indicator of distress and compromised welfare of the laboratory rat (Baumans, Reference Baumans2004) and can be easily assessed without handling the animals. In recent years, it has been hypothesised that because the pig also displays TS, it might be a similarly useful tool for assessing pig welfare in farm conditions (DeBoer et al., Reference DeBoer, Garner, McCain, Lay, Eicher and Marchant-Forde2015; Telkänranta et al., Reference Telkänranta, Marchant-Forde and Valros2016). In the pig, TS has so far been correlated to low social rank (Marchant-Forde and Marchant-Forde, Reference Marchant-Forde and Marchant-Forde2014), to a longer latency to approach a novel object (Telkänranta et al., Reference Telkänranta, Marchant-Forde and Valros2016), to social isolation and a barren environment (DeBoer et al., Reference DeBoer, Garner, McCain, Lay, Eicher and Marchant-Forde2015), to individual tail and ear damage scores (Telkänranta et al., Reference Telkänranta, Marchant-Forde and Valros2016) and to measures of hypothalamic-pituitary-adrenal and sympathetic-adrenal-medullary axis activation (DeBoer and Marchant-Forde, Reference DeBoer and Marchant-Forde2013; Schmitt et al., Reference Schmitt, Baxter, Boyle and O’Driscoll2018); all indicating that TS in the pig could be related to the experience of stressors.
In pigs, TS arises from secretions of the lacrimal gland, the superficial gland of the third eyelid and the Harderian gland (HG). Tear staining (also termed chromodacryorrhoea or red tears in rodents) arises from the secretions of the HG, and the red colour is created by porphyrins in the secretion (McCafferty and Pinkstaff, Reference McCafferty and Pinkstaff1970; Payne, Reference Payne1994). The function of fluid secretion from the HG still remains largely hypothetical, and suggestions include a lubrication of the eye, an immune response, a photo protection and reception, and social signalling through pheromone production (Payne, Reference Payne1994). The anatomy of the HG has been described in detail in the newborn piglet (Munkeby et al., Reference Munkeby, Smith, Winther‐Larssen, Bjørnerud and Bjerkås2006), but the postnatal development of the HG in pigs has so far not been described. However, studies on other species suggest that the HG goes through several morphological changes after its immature structure at birth (López et al., Reference López, Tolivia and Alvarez‐Uría1992; Elgayar et al., Reference Elgayar, Abou-Elghait and Sayed2015) and that the production of porphyrin increases with age (Chieffi et al., Reference Chieffi, Baccari, Di Matteo, d’Istria, Minucci and Varriale1996). If the development of the participating glands in pigs affects the production of TS, this is important information to consider if TS should be used for welfare assessment on farm.
Furthermore, studies on other species have shown sexual dimorphism in the HG (McCafferty and Pinkstaff, Reference McCafferty and Pinkstaff1970; Buzzell, Reference Buzzell1996; Hussein et al., Reference Hussein, Elgamal and Elgayar2015) probably resulting in TS differences between males and females. Studies on the pig have found differences between left and right eye TS, with left eye TS relating more to the assumed stressors (Marchant-Forde and Marchant-Forde, Reference Marchant-Forde and Marchant-Forde2014; DeBoer et al., Reference DeBoer, Garner, McCain, Lay, Eicher and Marchant-Forde2015; Telkänranta et al., Reference Telkänranta, Marchant-Forde and Valros2016).
The overall goal of the current study was to increase the knowledge on TS as a potential indicator of stress by assessing whether pig and environmental factors influence TS in pigs. The more specific aims were: (1) to investigate the development in pen level TS over the finisher production period, (2) to investigate whether pig level TS is sex-dependent and whether it relates to the growth of the pig, (3) to investigate whether pen level TS is affected by a set of environmental conditions representing potential pen level stressors, (4) to investigate whether pen level TS develops differently for pens scored with tail damage and pens not scored with tail damage to assess whether TS has the potential to be an early detector of tail biting.
Material and methods
The present study was conducted from 2015 to 2016 in accordance with a protocol approved by the Danish Animal Experiments Inspectorate (Journal no. 2015-15-0201-00593). Further information about the study can be found in Larsen et al. (Reference Larsen, Andersen and Pedersen2018).
Animal, housing and management
The study was conducted in the experimental stables at Department of Animal Science, Aarhus University, Denmark, including two finisher sections with 16 identical pens in each. The study included 80 finisher pens divided between three batches (batch 1, 3: 32 pens each; batch 2: 16 pens) and with a total of 1160 finisher pigs. At assignment, the pigs weighed on average 31.9±6.6 kg and included 595 females and 565 castrated males. Each pen included both males and females with an average sex ratio within pens of 1.08 (number of males divided by number of females).
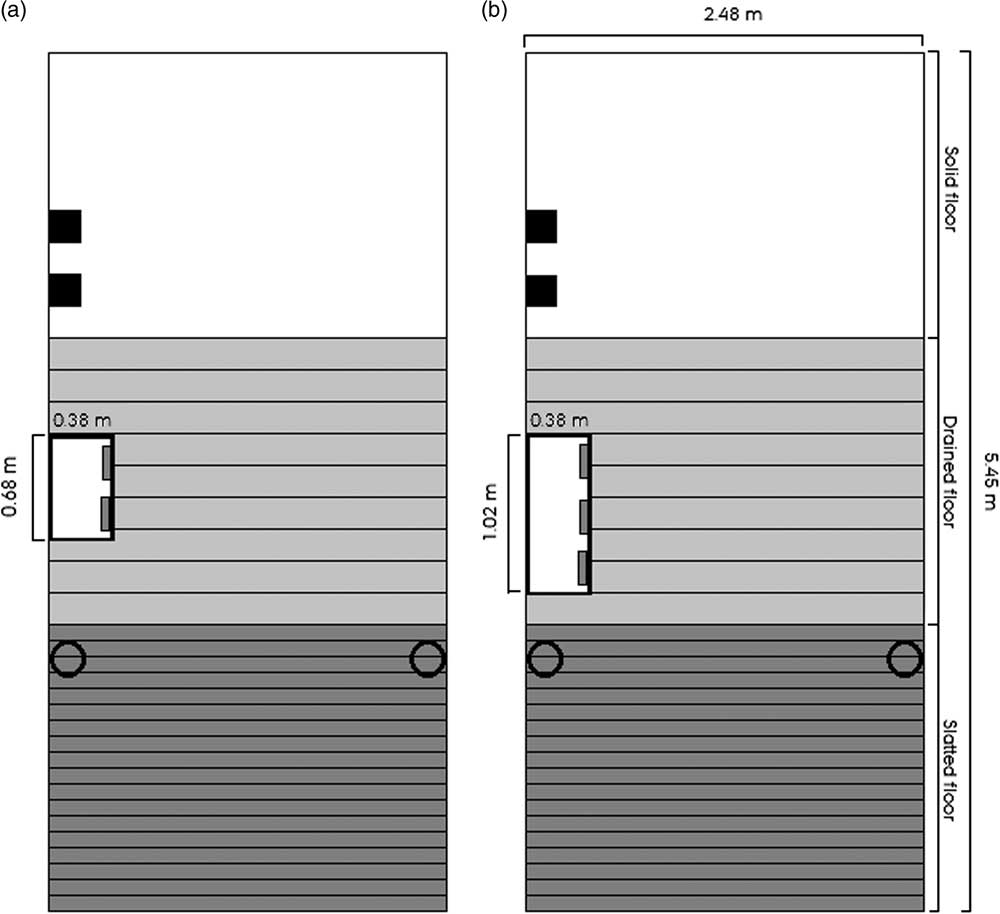
The design and dimensions of the pens can be seen in Figure 1. As part of a larger study design (Larsen et al., Reference Larsen, Andersen and Pedersen2018) and to test whether TS in pigs depends on different potential environmental pen level stressors, the pens were randomly divided within each batch between one level of each of three factors in a 2×2×2 factorial design: (1) TAIL: pigs with undocked (n=36) or docked tails (n=44), (2) STRAW: not provided with straw (n=40) or provided with 150 g of straw per pig per day on the solid floor (n=40) and (3) STOCK: stocking density of 0.73 m2/pig (n=40, 18 pigs per pen, high) or 1.21 m2/pig (n=40, 11 pigs per pen, low). Fewer pens with undocked pigs compared to pens with docked pigs were included due to many of the undocked pigs arriving from a private herd shortly after weaning with bleeding tails in batch 2 and thus not included in the study. Pigs were tail docked according to Danish legislation to half of the tail’s original length within the first 4 days after birth. Also, the amount of feeding space per pig was kept approximately equal between the two stocking densities.
Drawing of pen dimension and design for (a) pens with a stocking density of 1.21 m²/pig (11 pigs) and (b) pens with a stocking density of 0.73 m²/pig (18 pigs). The white rectangle represents the feeder, the hollow black circles represent drinking cups and the solid black squares represent two wooden beams in separate vertical racks. All pens had the same dimensions.

The pigs were fed ad libitum with a commercial dry feed, and the feeders were filled three times per day at 03:00, 10:00 and 18:30 hours. The room temperature was gradually decreased from 21°C to 17°C over the 9 weeks of the finisher period (SKOV A/S, Roslev, DK). Furthermore, each pen included a room-level, automatically controlled shower system (SKOV A/S) above the slatted floor. This was intended for cooling and was activated during all batches from 08:00 to 20:00 hours except if the outdoor temperature fell below 5°C. The system followed a linear curve going from 1% at a 0.5°C increase from the temperature curve to 100% at a 4°C increase. At 1%, the sprinklers were turned on with 45-min intervals for 1 min and at 100% with 20-min intervals for 3 min. In the current study, the minimum was 14%.
Scoring of tear staining
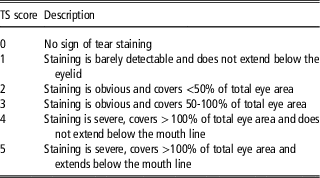
Tear staining was scored every Monday, Wednesday and Friday each week of the study period (9 weeks). During scoring, the observers entered the pen and looked at each individual pig’s eyes. Tear staining was scored on a scale from 0 to 5, as presented in Table 1, and for both the left and right eye of each pig. As seen in the description of the scoring protocol in Table 1, the different TS scores accounted for the size of the pig by comparing the TS area to the total eye area. Two observers per day performed the scoring. Batch 1 included five different observers who were all trained according to a scoring protocol with pictures and text, both by group-discussions and practical scorings in the stable. Batch 2 included four observers, all of whom were also included in batch 1. Batch 3 included five observers of whom one was new and trained by the others. Unfortunately, neither inter- nor intra-observer reliability was calculated.
The protocol used for scoring of tear staining (TS; DeBoer-Marchant-Forde Scale) in the finisher pigs

Recording of tail damage pens
Tail damage was recorded by scoring each individual tail simultaneously with the TS scoring. However, tail damage was also recorded on all other days of the week from outside the pen by the stock personnel. If at least one pig in the pen was scored with a bleeding tail wound, then this pen would be characterised as a tail damage pen, and hereafter this day was termed day0 for the respective pen. Afterwards, the pen was no longer included in the study and was not scored for either TS or tail damage. In the current study, the tail scoring data were merely used to identify tail damage pens.
Statistical analysis
Before analysis, the data were investigated descriptively. First, the data only included 332 TS score 0 and 131 TS score 5 out of the 26 814 individual TS score observations. Thus, TS score 0 was combined with TS score 1 and TS score 5 with TS score 4, referred to as TS score 1 and TS score 4. Second, it was noted that the individual TS scores could on one observation day drop from a high TS score to a low TS and on the next observation day increase to a high TS score again. This may be explained by the TS being washed off a pig due to the activation of the shower system, due to the pigs rubbing themselves against pen mates or inventory or due to an observer difference. Thus, data were aggregated to only include the maximum individual TS score within each week of the study (except for the tail damage data). Third, to study each TS score separately from the other scores, the TS scores were transformed to binomial variables either occurring or not for the single pig in each week of the study.
All statistical analyses were performed in R Version 3.4.3 (R Core Team, 2017) using the package ‘lme4’ (Bates et al., Reference Bates, Maechler, Bolker and Walker2015) for generalised linear mixed models. All models were logistic regression using the function ‘glmer’ with family set to binomial and were reduced according to a 5% significance level (P<0.05). Results are presented as the probability of each TS score and differences as odds ratios (OR) with connected 95% confidence intervals (CI).
Effect of week, eye, TAIL, STRAW and STOCK
To test the effect of week (1 to 9, continuous), eye (left v. right), TAIL (docked v. undocked), STRAW (yes v. no) and STOCK (low v. high) on the probability of each TS score, the data presented above were further aggregated to pen level by taking the sum of the number of pigs having each TS score as their maximum within each week. Also, only the pens that were never scored as tail damage pens were included to have data where all pens were represented in all weeks of the study. Thus, these data included 315 observations of each TS score for both the left and right eye (35 pens×9 weeks). Divided between the three factors, the data included observations from 10 pens with undocked pigs, 25 pens with docked pigs, 11 pens with no straw provided, 24 pens with straw provided, 15 pens with the high stocking density and 20 pens with the low stocking density. Each observation in the data contained information on the total number of pigs in the pen and the number of pigs with each TS score as their maximum within each week. Four models were created, one for each TS score, and the response was the proportion of pigs within a pen having the TS score as their maximum within each week. All models included the same main effects: week, eye, TAIL, STRAW and STOCK and the interactions between week and the other main effects. Further, the model specified a random intercept and slope (for the main effects week and eye) for each pen nested within batch number (1 to 3).
Effect of sex and average daily gain
To test the effect of sex and average daily gain (ADG) from assignment to the end of the study on the probability of each TS score, the data on pig level were further aggregated to include only one observation per individual pig for the entire study period. Again, only the pens that were never scored as a tail damage pen were included to have data where all pens were represented in all weeks of the study. These data included 490 observations of each TS score for both the left and right eye: 490 pigs (252 females and 238 males) divided between the 35 pens. Each observation included the number of weeks for each TS score where it was the pig’s maximum score within the week. The models were created separately for the left and right eye. In total, eight models were created, all including the main effects sex and ADG, the interaction between the two and the individual assignment weight as a covariate (average: 31.79 kg; range: 15.45 to 54.25 kg). Further, the model specified a random intercept for each pen nested within batch number (1 to 3).
Changes in tear staining scores before tail damage
To test whether the probability of each TS score changed before the scoring of tail damage on day0, and whether this was different for pens not scored with tail damage, each tail damage pen (n=21) was paired with control pens (n=28) from the same batch with the same treatment level of TAIL, STRAW and STOCK and which were never scored as tail damage pens throughout the study period. The initial data were aggregated to only include the last three observation days (1 week) before day0 for each respective pair of tail damage and control pens. In this process, a day category variable relative to day0 with three levels were created: day1 to 3, day4 to 5 and day6 to 7. These data included 192 observations of each TS score for both the left and right eye. The models were created separately for the left and right eye. All models included the main effects pen type (tail damage v. control), day category (day1 to day3 v. day4 to day5 v. day6 to day7) and period (1: week 1 to 3; 2: week 4 to 6; 3: week 7 to 9) and the interactions between pen type and the remaining main effects. Further, the model specified a random intercept for each pen nested within pair number (1 to 21) and batch number (1 to 3). The model on TS score 1 further included the main effect TAIL and the interaction between pen type and TAIL, as TAIL was shown in a previous model (results presented in a later section) to affect the probability of TS score 1.
Results
Descriptive development and variation
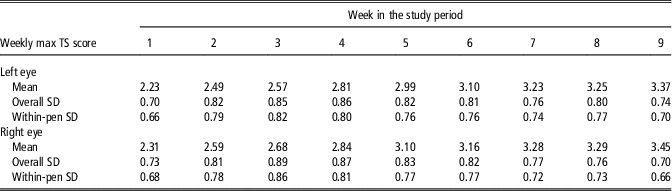
The individual max TS scores ranged from 1 to 4 in all weeks of the study period. The means of the individual max TS scores for each week seemed to increase with weeks during the study period for both the left and right eye. However, the deviation in the mean TS scores seemed rather stable, both overall and within-pen. Detailed results can be seen in Table 2.
The descriptive development and deviation in the weekly max individual tear staining (TS) score (pen averages) over the 9 weeks study period divided between the left and right eye of the finisher pigs. Tear staining was scored on a scale from 1 to 4 (see Table 1)

Effect of week, eye, TAIL, STRAW and STOCK
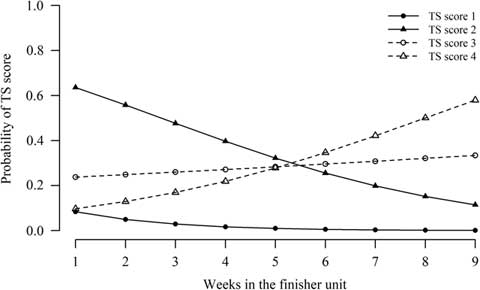
The probability of TS score 1 (P<0.01) and 2 (P<0.001) decreased with weeks into the study period, whereas the probability of TS score 4 increased (P<0.01); TS score 3 neither decreased nor increased with weeks into the study period. The results are illustrated in Figure 2. A higher probability of TS score 2 was found on the left eye compared to the right eye (OR=1.14, 95% CI (1.04, 1.26); P<0.05), whereas a higher probability of TS score 4 was found on the right eye compared to the left eye (OR=1.22, 95% CI (1.09, 1.35); P<0.05); no difference was found between the left and right eye for TS scores 1 and 3. A higher probability of TS score 1 was found in pens with docked pigs compared to pens with undocked pigs (OR=1.79, 95% CI (1.02, 3.12); P<0.05), whereas this was not found for the other TS scores. No effect of STRAW or STOCK was found for any of the TS scores.
The development in probability of the four tear staining (TS) scores (see Table 1) in finisher pigs with weeks into the study period.

Effect of sex and average daily gain
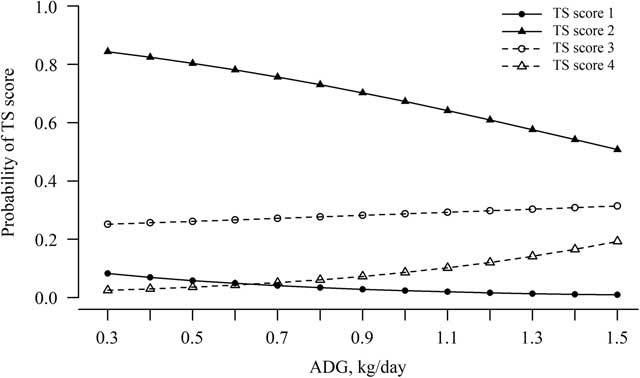
No differences were found between males and females in the probability of the TS scores. The probability of TS scores 1 (P<0.001) and 2 (P<0.001) decreased with an increase in ADG, whereas the probability of TS score 4 increased (P<0.001); no relationship was found between TS score 3 and ADG. The results for the left eye are illustrated in Figure 3.
The development in probability of the four tear staining (TS) scores (see Table 1) on the left eye in finisher pigs with increasing ADG (kg/day).

Changes in tear staining scores before tail damage
Of the 80 pens included in the study, 42 of these were scored as tail damage pens of which 62% were scored within the first 3 weeks of the study. The probability of TS score 1 was lower in the tail damage pens compared to the control pens (OR=0.56, 95% CI (0.41, 0.75); P<0.01) on day1 to day3 compared to day4 to day5 (OR=0.70, 95% CI (0.52, 0.94)) and day6 to day7 (OR=0.65, 95% CI (0.48, 0.87); P<0.01), indicating a decrease before day0. The probability of TS score 4 was lower on day6 to day7 compared to day4 to day5 (OR=0.72, 95% CI (0.53, 0.99); P<0.01) and day1 to day3 (OR=0.64, 95% CI (0.45, 0.89); P<0.05), indicating an increase before day0; however, this was only found on the left eye. No effect of pen type or day category was found for either TS scores 2 or 3.
Discussion
The relation to age
The degree of TS increased with weeks in the study period with a decrease in the probability of the lower scores and an increase in the probability of the higher scores as well as a numerical increase in the mean TS. For all weeks, the within-pen deviation in mean TS scores was almost similar to the overall deviation for all pens. This agrees with the results of Telkänranta et al. (Reference Telkänranta, Marchant-Forde and Valros2016), who also found almost equal overall and within-pen deviations across production systems, and indicates that individual differences might be as important as pen-level environmental factors for the development of TS. In the current study, one possible source of individual variation in stress level might be of social nature caused by the rather competitive feeding system. Also a previous study linked TS to differences in social rank (Marchant-Forde and Marchant-Forde, Reference Marchant-Forde and Marchant-Forde2014; Telkänranta et al., Reference Telkänranta, Marchant-Forde and Valros2016). However, it could also be a result of the within-pen variation in growth rate as supported by the current results.
The positive relationship found between the degree of TS and age of the pigs fits well with the findings of Telkänranta et al. (Reference Telkänranta, Marchant-Forde and Valros2016) with low TS scores in suckling piglets and an increase with age when compared to scores from finishers and breeder gilts in the same study. This relationship may occur due to the HG getting larger as the pigs grow, resulting in a greater relative secretion, or due to an accumulation effect over time where the older secretions do not wear off, thus the appearance seems more severe. The postnatal development of the HG in the pig remains to be described. However, studies on rats, mice, guinea pigs and Syrian hamsters found that the HG went through several changes after birth (López et al., Reference López, Tolivia and Alvarez‐Uría1992; Chieffi et al., Reference Chieffi, Baccari, Di Matteo, d’Istria, Minucci and Varriale1996; Elgayar et al., Reference Elgayar, Abou-Elghait and Sayed2015). As the HG structure of a newborn pig is typical among mammals (Munkeby et al., Reference Munkeby, Smith, Winther‐Larssen, Bjørnerud and Bjerkås2006), the HG of the pig may go through similar morphological and secretory changes. Whether this HG development still occurs as late as in the finisher period remains unknown. However, finishers are relatively immature and may not have reached puberty before being slaughtered. Thus, the HG, and perhaps also other glands involved in the TS secretion in pigs, could still be undergoing such developmental changes.
The relation to pen-level stressors
Another explanation for the relation found between TS and age of the pigs could be that the pigs, with proceeding weeks into the study period, spent more and more time in a possibly constantly stressful environment, causing an accumulation of stress over time. If so, this could suggest that TS increases in response to stress experienced by the pig as also suggested by other studies (Marchant-Forde and Marchant-Forde, Reference Marchant-Forde and Marchant-Forde2014; DeBoer et al., Reference DeBoer, Garner, McCain, Lay, Eicher and Marchant-Forde2015; Telkänranta et al., Reference Telkänranta, Marchant-Forde and Valros2016). However, this explanation could not be confirmed by the pen-level stressors induced experimentally in the current study. It could be expected that the high stocking density would become more stressful as the pigs grow older, but no difference in development of the TS scores was seen between the two stocking density treatments. Telkänranta et al. (Reference Telkänranta, Marchant-Forde and Valros2016) found lower TS scores when the pigs were provided with more interesting or different enrichment, and DeBoer et al. (Reference DeBoer, Garner, McCain, Lay, Eicher and Marchant-Forde2015) found a tendency for a smaller TS area on pigs housed with enrichment compared to in a barren environment. Thus, it could also be expected that pens with straw provided in the current study would have a lower degree of TS. Perhaps the variation in the induced stressors was not large enough relative to the overall stress level in the pens to show an effect on TS, although they did increase the risk of tail damage (Larsen et al., Reference Larsen, Andersen and Pedersen2018). On the other hand, both provision of straw and a higher stocking density may affect the dirtiness of the pen and pigs, especially towards the end of the finisher period (Larsen et al., Reference Larsen, Bertelsen and Pedersen2017). This could decrease the reliability of the TS scoring, as was a concern of the observers during the study, which may have hidden the effect of the stressors on TS in the current study. A higher stocking density may also increase accidental ‘grooming’ in the pigs, which has been related to a decrease in TS in the rat (Baumans, Reference Baumans2004) or lead to an increased risk of heat stress and thereby more wallowing-type behaviour, also decreasing the amount of TS. The experimentally induced stressors could also have been overridden by other stressors common to all pens in the study such as the air quality (Drummond et al., Reference Drummond, Curtis, Simon and Norton1980) or competition at the feeder, which was a rather competitive one in the current study.
The relation to growth
The degree of TS also increased with increasing ADG, again with a decrease in the probability of the lower scores and an increase in the probability of the higher scores. This relation could confirm the positive relationship between TS and development of the HG. It could also cause the relationship between TS and stress to be less obvious, as there is a negative relation between growth rate and stress (e.g., Hyun et al., Reference Hyun, Ellis and Johnson1998; Sutherland et al., Reference Sutherland, Niekamp, Rodriguez-Zas and Salak-Johnson2006). However, pigs with a higher ADG may experience stressors such a metabolic stress or higher competition at the feeder due to a higher motivation to feed. The growth of pigs is not only controlled by growth hormones but also by the thyroid hormones (Cabello and Wrutniak, Reference Cabello and Wrutniak1989), and it has been shown in the rat and the hamster that changes in the level of the thyroid hormones may change TS as well (Hoffman et al., Reference Hoffman, Habeeb and Buzzell1990; Baccari et al., Reference Baccari, Monteforte, de Lange, Raucci, Farina and Lanni2004; Monteforte et al., Reference Monteforte, Santillo, Lanni, D’Aniello and Baccari2008). Thus, the positive relation between ADG and TS may simply be found due to a hormonal difference between pigs with different growth rates. This is an important relation to consider if using TS scores as a welfare indicator of pigs in the future.
The effect of sex
In the current study, no differences were found between barrows and females. In some species, such as the guinea pig, Syrian hamster and miniature pig, the HG has been found to exhibit sexual dimorphism (McCafferty and Pinkstaff, Reference McCafferty and Pinkstaff1970; Buzzell, Reference Buzzell1996; Hussein et al., Reference Hussein, Elgamal and Elgayar2015). This in turn suggests that the gland, at least in some species, is regulated by sex steroid hormones. Thus, it was expected to also find a difference in TS scores between sexes in the current study. Why this was not seen could possibly be explained by the fact that all male pigs were castrated shortly after birth. This was also suggested by Buzzell (Reference Buzzell1996) who found a feminisation in relation to TS when castrating Syrian male hamsters.
Tear staining as an early detector of tail biting
Tail biting in pigs is considered an animal welfare problem as well as an economical problem for the farmer. One negative consequence of tail biting is the development of serious damage on the tail of the pigs that has been related to the experience of pain (Di Giminiani et al., Reference Di Giminiani, Edwards, Malcolm, Leach, Herskin and Sandercock2017) and an increased risk of infections in the pig (e.g., Valros et al., Reference Valros, Ahlström, Rintala, Häkkinen and Saloniemi2004). One strategy to prevent tail biting and the resulting tail damage could be the early detection strategy. The purpose of this strategy is to detect when pigs are going through a period of increased stress. This increased stress could potentially lead to tail biting, resulting in tail damage, and thus it may be possible to detect pens in risk of future tail damage before tail damage occurs. The first step in this strategy is to identify possible early detectors. As both tail biting and TS may be related to stress in the pig, it was hypothesised that TS may also work as an early detector of tail biting.
To work as an early detector of tail biting, the TS score needed to either decrease or increase before day0. In the current study, TS score 1 decreased and TS score 4 increased before day0. However, this was seen for both the pens scored with and not scored with tail damage on day0. Thus, TS does not seem a promising early detector of tail biting, at least not when defined as relatively mild as in the current study. However, through changes in TS it may be possible to detect the initiation of an unknown stressor on room or farm level, perhaps leading to tail damage in pigs or pens not able to cope with this stressor. It is well-known that tail biting occurs sporadically (D’Eath et al., Reference D’Eath, Arnott, Turner, Jensen, Lahrmann, Busch, Niemi, Lawrence and Sandøe2014) and unevenly between individuals and pens, even when these are exposed to the same environment (Zonderland et al., Reference Zonderland, Kemp, Bracke, den Hartog and Spoolder2011). This might be due to tail biting being influenced by both internal (such as genetics and health of the pigs) and environmental factors (for a review, see Valros, Reference Valros2018). Again, this relates TS to stress in the pig. Day0 was observed in all weeks of the study period, and mostly in the first 3 weeks. Thus, this relation is not confounded with pig age or weight. Further, the relation between TS and tail damage was only found on the left eye, which fits well with other studies on the relation between TS and stress in the pig (Marchant-Forde and Marchant-Forde, Reference Marchant-Forde and Marchant-Forde2014; DeBoer et al., Reference DeBoer, Garner, McCain, Lay, Eicher and Marchant-Forde2015; Telkänranta et al., Reference Telkänranta, Marchant-Forde and Valros2016). This may be due to cerebral lateralisation, as it has been found that the right hemisphere, which is connected to the left eye, dominates in the processing of negatively correlated emotions (Leliveld et al., Reference Leliveld, Langbein and Puppe2013). Other challenges with the scoring system were also identified in the current study. First, TS scores of the single pig were seen to change from high to low and back to high values within a week. Second, TS scores 2 and 4 and TS scores 1 and 3 seem to be each other’s complement. Third, some TS scores seem to depend on whether it being scored on the left or right eye of the pig. Thus, the TS scoring system seems to still need investigation and validation in on-farm situations.
Conclusion
Overall, the degree of TS increased with weeks into the study, suggesting a relationship between TS and age of the pigs. This could be due to morphological changes in the participating glands with age or a prolonged experience of a stressful environment. Tear staining was also positively related to the growth rate of the pigs, arguing for both of the above suggested hypotheses but which could also be due to hormonal differences. Lastly, TS did not seem promising as an early detector of tail biting on pen level, and also the application of the scoring system in on-farm situations needs further validation.
Acknowledgements
This study was supported by the Green Development and Demonstration Programme under the Ministry of Food, Agriculture and Fisheries, Denmark (project IntactTails j.nr. 34009-13-0743). The authors thank Betty Skou, Carsten Kjærulff Christensen, Birthe Houbak, John Misa Obidah, Johanne Jespersen, Louise Bendixen and Maja Bertelsen for priceless help with scoring of the pigs’ ears and tails. Also, thanks to the stock personnel for their high level of collaboration.
Declaration of interest
The authors declare no conflict of interest.
Ethics statement
The present study was conducted from 2015 to 2016 in accordance with a protocol approved by the Danish Animal Experiments Inspectorate (Journal no. 2015-15-0201-00593).
Software and data repository resources
Data and models are not deposited in an official repository.