I. INTRODUCTION
In the recent years, advances in the biomechanical and aerospace industries have motivated researchers to work on new micro- and nanostructures of materials with specific properties. In this context, the carbon nanotube (CNT)-reinforced polymer composites have emerged as an advanced material showing several attractive characteristics in mechanical, thermal, chemical, electrical and optical properties.Reference Abdalla, Dean, Adibempe, Nyairo, Robinson and Thompson1, Reference Grady2
Many thermoplastic polymers and epoxy resins have been used for producing polymer/CNT composite materials, which exhibit targeted improvement of their properties. However, few studies involving phenolic resin have been reported. Nowadays, phenolic resins are indeed irreplaceable materials for many specific high-technology applications, offering high reliability under severe operating conditions. Their excellent ablative properties, structural integrity, thermal stability and solvent resistance make phenolic resins widely utilized, especially in thermal insulation materials, molding compounds, coatings and composite materials.Reference Mathur, Singh, Dhami, Kalra, Lal, Rao and Rao3–Reference Tai, Yeh and Liu5
In the last decade, several research groups have presented many experimental results predicting the mechanical properties of the CNT-reinforced polymer composites. It is already known that the structure, dispersion characteristics and diameter of the CNT are important parameters for determination of the effective properties of the CNT/polymer composites.Reference Yeh, Tai and Lin6 Because of their extremely small dimensions, CNTs are expected to be the ultimate material utilized as mechanical filler in composites.Reference Stamatin, Morozan, Dumitru, Ciupina, Prodan, Niewolski and Figiel7 Its density is in the range of 1.3–1.4 g/cm3 and its Young’s modulus values are higher than those values found for carbon fibers, as can be seen in some types of CNTs with values of their strength exceeding 1 TPa.Reference Stamatin, Morozan, Dumitru, Ciupina, Prodan, Niewolski and Figiel7, Reference Bal and Samal8 Their strength is what really sets the CNTs apart, with the highest measured strength for a CNT being 63 GPa.Reference Stamatin, Morozan, Dumitru, Ciupina, Prodan, Niewolski and Figiel7, Reference Tai, Yeh and Peng9 This is an order of magnitude higher than any carbon fiber’s strength. It is really noteworthy that even CNT with some improper parameters, can exhibit strength values of several GPa.Reference Stamatin, Morozan, Dumitru, Ciupina, Prodan, Niewolski and Figiel7, Reference Tao, Yang, Grunlon, Kim, Dang, Deng, Thomas, Wilson and Wei10
Most of the articles found in the literature report an increase in the strength of composites with the addition of a small amount of CNTs. However, the increase in the neat resin mechanical properties is by far smaller than the expected values.Reference Amanuel and Malhotra11–Reference Yip and Wu16 For an effective reinforcement it is necessary to have a good dispersion, alignment, and good interfacial stress transfer between the reinforcement and matrix. The dispersion of individual CNTs in a matrix is probably the fundamental issue because it is desirable for efficient load transfer between the CNT network and the host matrix.Reference Ye, Gong, Lu and Liang15
Many research efforts have been done for producing CNT/polymer composites for structural applications. However, even after a decade of research, the application of CNTs as reinforcement has been severely limited mainly caused by the difficulties associated with dispersion of the entangled CNTs during the processing and also poor interfacial interaction between CNTs and polymer matrix. The contributing factor for the dispersion problem in respect of CNTs is quite different from that for the conventional fillers such as spherical particles and carbon fibers as the CNTs are very small in diameter, in nanometer scale, and have high aspect ratio (>1000) thus extremely large surface area.Reference Huang, Ahir and Terentjev17–Reference Szleifer and Yerushalmi-Rozen19 During the last decade, two of the processes that have been used with success for promoting good dispersion of CNTs in polymer matrix are: ultrasonication and calendering processes.
Ultrasonication is an effective method for dispersing CNTs in liquids having a low viscosity, such as water, organic solvents and low viscosity resins.Reference Szleifer and Yerushalmi-Rozen19
The use of calender technique for dispersing the CNTs in a polymeric matrix has become a very promising approach to achieve a relatively good CNT dispersion according to some recent articles.Reference Szleifer and Yerushalmi-Rozen19–Reference Bekyarova, Zhao, Sen, Itkis and Haddon22 High shear stress needs to be applied for disentangling the CNT bundles and for distributing the dispersed CNTs into the polymeric matrix, whereas a short residence time probably will limit the breakage of the individual nanotubes. However, in this process the minimum gap between the rollers is about 1–5 μm, which is comparable to the CNTs length, and is large by far compared with the individual CNT’s diameter.Reference Szleifer and Yerushalmi-Rozen19
In this article, CNTs were dispersed into phenolic resin utilizing two different processes: ultrasonication and three-roll calender device (TRC). After this, the phenolic resin/CNT specimens were cured in autoclave and the mechanical properties (tensile strength, impact strength, flexural strength and tribological properties) were evaluated. The morphologies of the surfaces and rheological behavior of the phenolic resin/CNT composites were also evaluated and discussed.
II. METHODOLOGY
A. Chemicals and materials
The CNTs (Baytubes) used in this investigation were supplied by Bayer Company (Darmstadt, Germany). In this work we used, specifically, Baytubes C 150 P with an average diameter of 13–16 nm, average length of 25 μm, number of walls of 3–15 and bulk density of 140–160 kg/m3. The manufacturer indicates that the CNTs contain less than 5% impurities, including residual catalyst.
The dispersion of the CNT into phenolic resin was achieved using chemical and mechanical processing. In the chemical processing was used poly (sodium 4-styrene sulfonate) (PSSS) surfactant from Sigma-Aldrich (Munich, Germany), for guaranteeing the dispersion of the CNTs in water.
Phenolic resin (SC 1008P) was supplied by Hexion Company (Stuttgart, Germany) with the following characteristics: solid content about 66 wt% and gel time approximately 18 min at 130 °C.
B. Dispersion of CNTs into phenolic resin
The dispersion of the CNTs into phenolic resin was carried out using two methodologies: (i) with water, surfactants and ultrasonic probe; (ii) using TRC.
In the first methodology, the CNTs were placed into the water with surfactant and then the system was dispersed using a high-intensity ultrasonic horn (20 kHz, Branson PG), which was immersed into the liquid particle-resin-mixture. The vessel of the mixture was cooled down utilizing an ice water bath. The unsonicated CNTs could not be dispersed in water; only 1 min under sonication process enabled a good dispersion, as observed in the previous work.Reference Botelho, Edwards, Burkhart and Bittmann23 According to the literature, the period of time is estimated using light scattering and UV-vis analyses. In this work, the ratio between the CNT and surfactant was 2 and the CNT concentration in water was 1 mg per mL. This ratio was chosen according to the literature.Reference Szleifer and Yerushalmi-Rozen19
For mixing the CNT dispersion into the phenolic resin, a process using a mechanical mixer at 2000 rpm during 30 min was set up. Then, the phenolic resin with multiwalled carbon nanotubes (MWCNTs) and water were subjected to a drying process, using a distillation process (70 °C, under vacuum atmosphere for 3 h), and the moisture content was evaluated using Karl Fischer technique. Since the initial moisture content in the neat phenolic resin was around 2.5% this drying process was continued to be performed until reaching the initial value of moisture.
In the mechanical processing the masterbatch of the carbon nanofibers was prepared adding to the dissolver mixer, at room temperature, the nanofiber powder and the liquid phenolic resin. All masterbatches were mechanically stirred under vacuum atmosphere for about 20 min for removing most of the entrapped air introduced with the addition of the nanofibers and to form a homogeneous suspension. In this mixing process, the rotation speed was 2000 rpm. After this first set, the masterbatch was dispersed utilizing a TRC, model Exakt 80 E (Norderstedt, Germany). The dispersion took place in three consecutive steps, where the distance between the calender rolls was set to 150, 50, and 10 μm. So, using TRC, it was possible to produce three different mixtures: (i) phenolic resin/CNT passed one time in the TRC with rolls distance of 150 μm; (ii) phenolic resin/CNT passed two consecutive times in TRC, first with rolls distance of 150 μm and second time with the rolls distance of 50 μm; (iii) passed three consecutive times, first with the rolls distance of 150 μm, second with the rolls distance of 50 μm and third with the rolls distance of 10 μm. The cylinder’s rotational speed was 150 rpm. Since different CNT contents generate nanocomposites of different viscosities, the resin with different quantities of CNT was processed utilizing the TRC at different times. So, processing phenolic resin with 0.05 wt% CNT required around 3 h and same in respect of phenolic resin with 2 wt% CNT required around 7 h.
C. Autoclave curing process
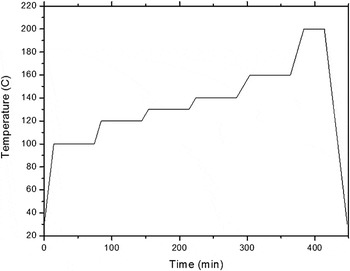
The CNT/phenolic resin nanocomposites production was carried out in three steps. In the first step, the MWCNTs were dispersed and mixed in phenolic resin as previously presented. In the next step, the mixed compounds were positioned onto a stainless mold frame with dimensions 210 m × 210 m × 10 mm. This mold was covered using a special stain plate system, which makes it possible to work in pressurized atmosphere. In the last step, the pressurized mold was placed inside of an autoclave brand Scholz (Coesfeld, Germany), model 39304, dimensions 2 × 0.68 m, total volume 2450 L, maximum temperature 500 °C and maximum pressure 25 bar; accordingly, the composites were exposed to a heating cycle up to 200 °C and cured under 7 atm of pressure as depicted in the Fig. 1. This heating rate and cycle were selected considering our previous experience using trial and error method to process phenolic resin into autoclave. A great number of previous trials were used resulting in damaged specimens or residual stress in the specimens. Using this technique, specimens with 0.05, 0.1, 0.5, 1.0, and 2.0 wt% CNT were produced.
Cure cycle used in phenolic resin/CNT processing.

D. Characterization
For evaluating the CNT dispersion in the phenolic resin specimens, density and rheological analyses were performed. The viscosity and the storage modulus of the phenolic resin with different amounts of CNT were determined by parallel plate rheology. Rheological measurements were performed at 25 °C using a rheometer, brand Rheometric Scientific (New Castle, DE), model Ares, with a torque transducer in the range of 0.004–100 g cm, utilizing parallel plates with 45 mm in diameter and separated by 1.5 mm. All oscillatory measurements were performed within the linear viscoelastic regime, which was experimentally determined using controlled frequency and variable strain measurements. The density values of all cured specimens were determined by American Society of Testing and Materials specifications ASTM D 891–09 (hydrostatic weighing) and appropriate equations.Reference Carballeira24 This procedure is based on Archimedes’ principle, using the following three measurable values: the weight of the body outside the water, the weight of the completely immersed body and the density of the water. The density can be obtained from the Eq. (1).

where:
d = density;
d w = density of water;
w b = weight of body;
w ib = weight of immersed body
The tensile tests were conducted in a universal testing machine (UTM) at room temperature. The machine brand Zwick model 1474 (Ulm, Germany) was set in tensile configuration according to EN ISO 527-2 standard. The composite samples for the mechanical tensile tests had dog-bone shape, width and thickness of 4 mm, and a gauge length of 30 mm. The distance between the sample clamps was 40 mm and the test speed was set to 1 mm/min. From the stress–strain diagrams the tensile modulus was determined by the slope of the curve between 0.05 and 0.25% of the total strain. The tensile strength was determined considering the material’s maximum sustained stress.
The flexure tests were also conducted in a UTM at room temperature. The machine brand Zwick model 1474 was set in a flexure configuration according to ASTM D790 standard. The composite sample’s dimensions for the mechanical flexure tests were 10 × 80 × 4 mm. The tests speed was set to 1 mm/min.
The Charpy impact test is a high-speed fracture test, which measures the energy necessary to break a specimen under bending conditions. The notched Charpy impact tests were performed at room temperature using a pendulum testing machine brand CEAST, according to the DIN-ISO179/1eU standard. The rectangular samples were fractured at room temperature by a swinging hammer with an impact energy of 4 J and an impact speed of 2.9 m/s. The distance between samples support was set to 62 mm.
The tribological performance of each material was evaluated by constant sliding speed test under a pressure of 1 MPa. The tests were performed at room temperature and with relative humidity ranging from 50% to 60%. The gray iron disks, 50 mm in diameter, were used for the friction tests. The wear resistance was measured using a constant interval-type drag test with the Krauss tester. The friction force and applied pressure were monitored manually, using an excel program. The amount of wear was calculated by measuring the change in weight and thickness of the friction material after the drag tests under a 1 MPa constant pressure. The friction force during brake application was measured at different speeds, 0.5 and 1.0 m/s using an appropriate dynamometer. The weight loss and thickness decrease of each sample were measured using an analytical balance and a digital micrometer, respectively. The wear rates represent the worn-out volumes per unit of applied load and the sliding distance. The cross-section areas were calculated utilizing the section profile of the wear tracks measured using a Taylor-Hobson Surtronic 3P profilometer (Rand Taylor Hobson Ltd., Rolling Meadows, IL). The cross-section area times the wear track perimeter gives the total worn-out volume. For each parameter, at least four repetitive tests were performed for calculating the mean wear rate.
The images were acquired by scanning electron microscopy (SEM), brand Leo FE-SEM model 1530 (ZEISS Company, Stuttgart, Germany) set to 0.5 kV. The samples were investigated with an additional gold coating to improve the contrast image of the fracture surfaces.
III. RESULTS AND DISCUSSION
A. CNT dispersion and morphology
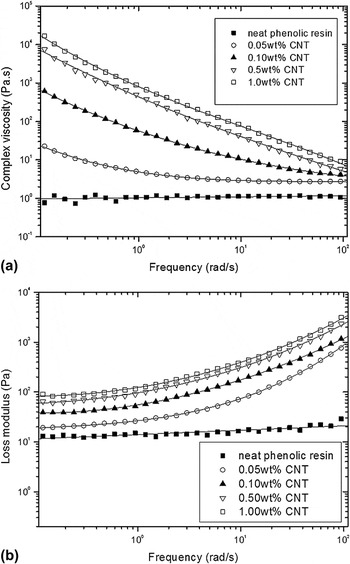
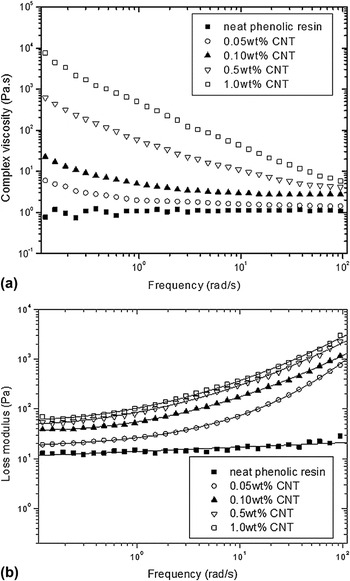
Figure 2 shows the complex viscosity and storage modulus (G′) as a function of frequency for neat phenolic resin and nanocomposites based on the CNTs when dispersed by mechanical process up to 10 μm (it was used in all the three steps: 150 μm followed by 50 μm and followed by 10 μm). A similar behavior was found when specimens were analyzed using aqueous solution (Fig. 3). The complex viscosity [Fig. 2(a)] of the neat resin is independent of the shear rate, exhibited by a Newtonian fluid. Therefore, with the increase of CNT content it can be observed that the rheological behavior changes to that of a fluid, which has to be mathematically expressed in terms of complex numbers having real and imaginary parts, presenting a shear thinning behavior at high frequencies. The low frequency rate range is useful for discerning differences in the structure of the systems. From this figure, it can also be observed that the specimens with the highest nanotube loading exhibit the highest viscosity values. The increase in the value of complex viscosity is due to a restriction of the polymer chains motion caused by the presence of the CNTs. Increasing the loading makes the locking of the polymer chains easier and, therefore, the value of complex viscosity increases.Reference Huang, Ahir and Terentjev17, Reference Carballeira24
Phenolic resin reinforced by CNT viscoelastic behavior of specimens mechanically mixed using all three steps (150 μm followed by 50 μm and followed by 10 μm): (a) viscosity and (b) storage behavior.

Phenolic resin reinforced by CNT viscoelastic behavior of specimens obtained using aqueous solution: (a) viscosity and (b) loss modulus behavior.

A plot of the frequency-dependent storage modulus is shown in Fig. 2(b). In this case, the magnitude of loss modulus increases with loading, accompanied by a flattening in the slope of response. This frequency-independent behavior at low ω is indicative of increasing solid-like elastic response. In addition, the distinct jump in the low-frequency magnitude of storage modulus (G′) between 0.05 and 0.10 wt% is an indication of percolation behavior.Reference Huang, Ahir and Terentjev17, Reference Carballeira24
Both systems (using water solution and mechanical dispersion) exhibit higher viscosities than the neat resin. The high viscosity at the low frequency rates can be attributed to the formation of a percolated structure by the CNTs. This structure breaks down as the frequency increases, resulting in viscosities that are similar at high frequency for all the systems.
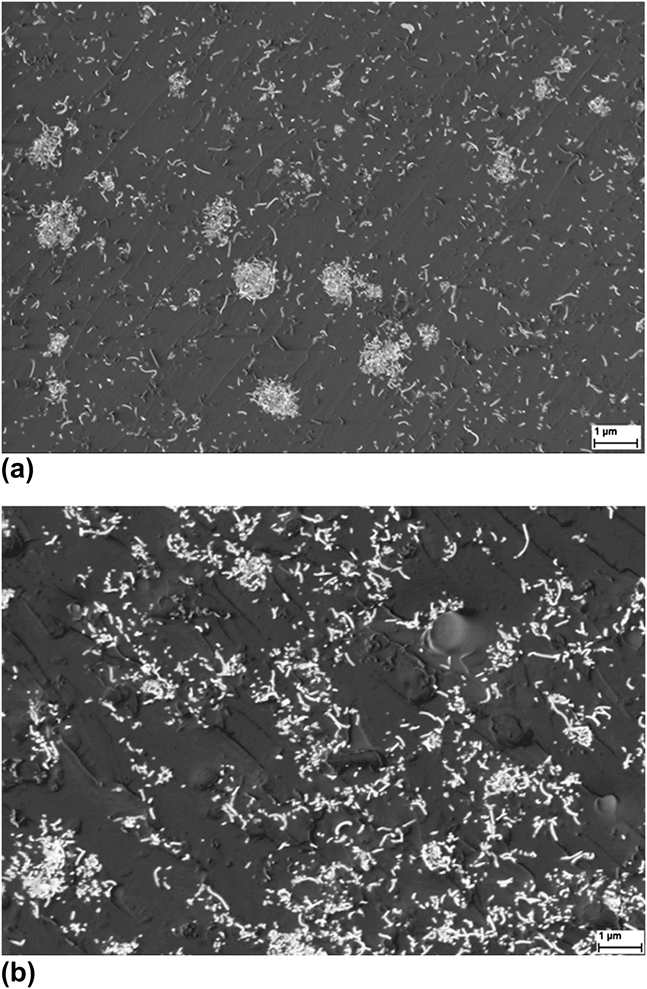
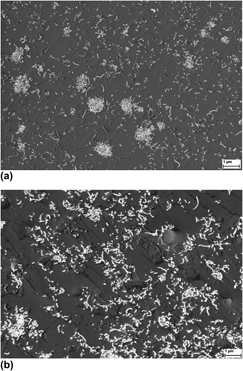
SEM was used to characterize the dispersion and distribution of the nanotubes in the phenolic matrix. Representative micrographs are shown in Fig. 4. These images show a fractured surface for phenolic resin with 1.0 wt% CNT, processed by aqueous solution [Fig. 4(a)] and TRC [Fig. 4(b)]. These micrographs show a relatively homogeneous distribution of CNTs, but also there are some CNTs agglomerations mainly in the specimens processed in aqueous solution. Also it is possible to observe from this figure, a good dispersion of the nanotubes in the phenolic matrix.
SEM micrographs from fractured surfaces of phenolic resin/CNT (1.0 wt% CNT content) composites: (a) CNT aqueous solution and (b) TRC (using all three steps).
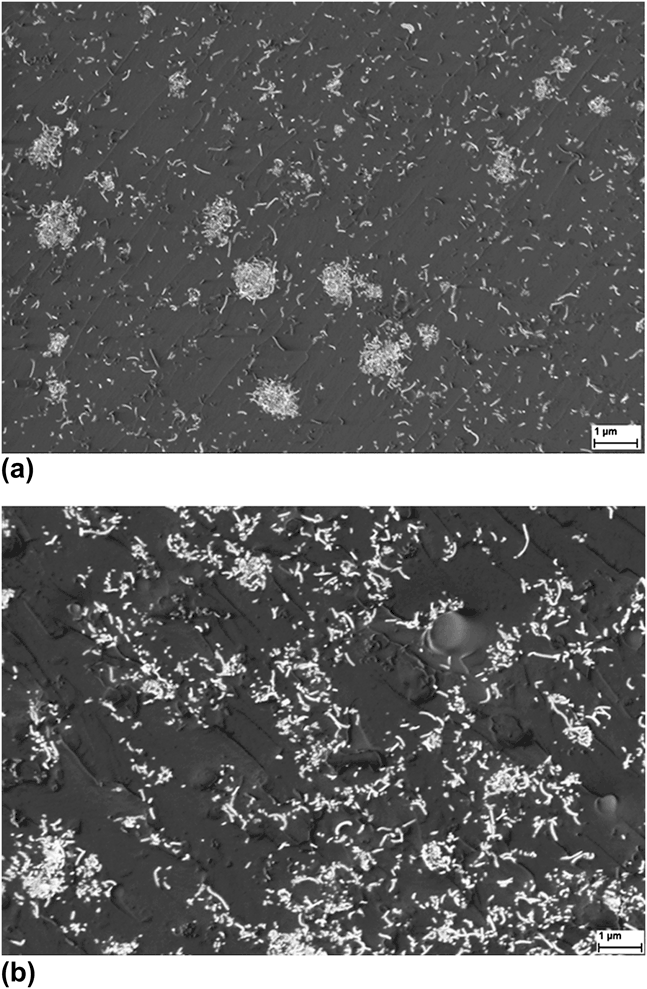
Good dispersion of CNT in composites reduces the stress concentration and enhances the uniformity of stress distribution; as a result, the phenolic resin/CNT processed by TRC (in this case using all three steps) have a better performance in mechanical and viscoelastic properties than those dispersed in aqueous solution.
B. Influence of CNT dispersion on the tensile properties
The quality of CNT dispersion has a strong influence on the nanocomposite mechanical properties. However, some properties are more sensitive to the reinforcement dispersion than the others. The improvement in the value of elastic modulus, for example, depends on intrinsic properties of the matrix and the filler as well as interactions between them and is to some extent dependent of the dispersion state. On the other hand, the ultimate properties are more sensitive to defects.Reference Carballeira24
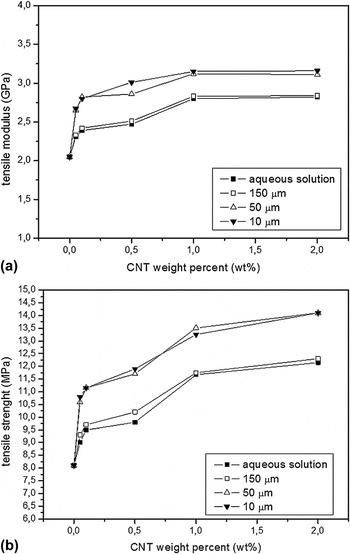
For evaluating the manner CNT dispersion affects the mechanical properties of the phenolic/CNT composites, tensile tests were performed in these specimens considering 0.05, 0.1, 0.5, 1.0, and 2.0 wt% CNT content, using different steps in the calender (150, 50 and 10 μm) and also processed by aqueous solution. Figure 5 presents the tensile modulus average and tensile strength for materials processed by aqueous solution after different dispersion steps in TRC. It can be observed that the modulus results present significant variation up to 1.0 wt%; for CNT loadings higher than 1.0% the change was negligible in both properties, but it was also observed that there was improvement in strength in every single case (around 46% for 0.5 wt% CNT and 56% for 2 wt% CNT).
Tensile results of the phenolic resin/CNT nanocomposite processed by TRC and aqueous solution: (a) tensile modulus and (b) tensile strength.

The rigid filler′s influence on the polymer’s stress–strain behavior is well known for fillers in the range of micrometers or larger. Microfillers commonly increase the stiffness and they also may have a detrimental effect on the strain break. The strength of microfilled composites is known to be directly proportional to the rising filler content.Reference Carballeira24 Some important composites characteristics have to be considered for explaining this phenomenon. The interface quality in composites, i.e., the static adhesion strength and the interfacial stiffness, usually play a very important role in the material’s capability to transfer stresses and elastic deformation from the matrix to the fillers.
This is especially true for nanocomposites, as they impart a high portion of the interface. If the filler-matrix interaction is rich, the particles are able to carry part of the external load. In this situation, the strength of the composite can be higher than the neat polymer matrix. If the bonding between filler and matrix is strong enough, the yield strength of a nanocomposite can be higher than the polymer matrix.Reference Carballeira24 In the same way, a high interfacial stiffness corresponds to a high composite modulus. Hence, the gradual increase in the stiffness and in the tensile strength, for the nanocomposites, reveals the stresses are efficiently transferred by the interface. The observed improvement on the mechanical properties of the phenolic resin/CNT has also been reported by Carballeira.Reference Carballeira24 In this article, the values found as tensile values 41, 55 and 69 MPa are respectively for neat resin, resin with 0.5 wt% CNT and resin with 1.0 wt% CNT. Also, values of the modulus were found as 5.1, 5.6, and 6.3 GPa, respectively.
According to Fig. 5, considering the processing techniques, the tensile properties of every single specimen presented a similar trend, but as expected, the phenolic resin/CNT nanocomposite processed by TRC (50 and 10 μm) presented higher strength and higher tensile modulus.
For confirming the experimental data, the results obtained using the models are also presented in this work. Several theoretical models have been proposed to explain the mechanical properties of CNT-reinforced composites. Most of these models assume a homogeneous dispersion of the nanofillers in the matrix and perfect stress transfer from the matrix to the fillers. The predicted mechanical properties often exceed the experimental results since, in the actually produced composites, the fillers tend to form entangled agglomerates that are extremely difficult to break up. The presence of these fiber clusters tends to reduce the material′s mechanical performance.
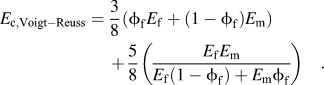
The Voigt–Reuss model estimates the elastic modulus of a short random fibers lamina by combining the Voigt–Reuss equations for longitudinal (El) and transverse modulus (Et):

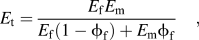
where E f and E m are respectively reinforcement and matrix modulus and  is reinforcement fraction content.
Using Akasaka’s simplified equation:
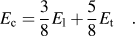
With the following result:
Thostenson and ChouReference Halpin and Kardos25 modified the Halpin Tsai theoryReference Hocke26 for unidirectional reinforcements orientation toward its applicability to nanotube-reinforced composites. Applying their approach to the Halpin Tsai’s equation for short fibers in random orientation,Reference Hocke26 the maximum obtainable value for Young’s modulus for a composite with a perfect distribution and impregnation of fibers inside the polymer is given by the equation:
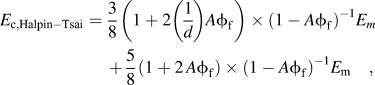
where:
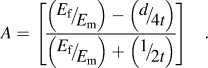
The Young’s moduli of the matrix and the fillers are 2050 MPa and 670 GPa, respectively,Reference Yeh, Hwa and Liu12L is the length and d is the fillers’ diameter being 25 μmReference Yeh, Hwa and Liu12 and 13 nm, respectively,Reference Botelho, Edwards, Burkhart and Bittmann23 and t = 0.34 nm (graphite layer thickness).Reference Carballeira24
Tibbets et al.Reference Carballeira24 proposed a modified Cox modelReference Carballeira24 for calculating the Young’s modulus for thermoset nanocomposites. The model estimates the stress transfer to nanofibers of length L, diameter d, axial tensile modulus, and volume fraction in a matrix of modulus E m with the following expression:
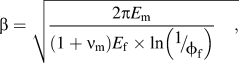
where ν m is the matrix Poisson’s ratio. Combining the above expression with the rule of mixtures, the modified Cox model gives the following equation for calculating the reinforced composite modulus:

where: η0 = is the reinforcement orientation factor and s = 2 l/d and assuming the nanofiber′s random orientation in the resin as η = 1/3.Reference Carballeira24
Table I shows a comparison between the measured values of the tensile modulus of the phenolic resin/CNT composites and the values of the same derived from predictions of three different theoretical models: Voigt–Reuss’, Halpin–Tsai’s, and Cox’s. As can be observed, up to 0.5 wt% CNT, the Voigt-Renns model is more satisfactory to be used, since up to this point the theoretical results are very close to the experimental results. In this case, the nonlinearity is attributed to MWCNTs aggregation at higher weight percentages. Therefore, for high CNT concentrations, the Cox and the Halpin-Tsai models are more suitable for use. This behavior can be attributed to these models as they take into account the shape factor. Large values for the coefficient A tend to soften the fitted curves of Young’s modulus of the MWCNTs/phenolic composites at high end of the MWCNTs additively, which indicate more aggregation initiated with increasing MWCNTs content. In general, every model underestimates the fillers′ reinforcing effect at low volume concentrations while overestimating it for high concentrations.
Comparison between experimental tensile modulus results and different theoretical predictions for phenolic resin/CNT nanocomposite.

C. Flexural properties
The mechanical performance of a CNT/polymer composite depends on the dispersion of CNTs and interfacial interaction between CNT and polymer. For comparison purpose, the flexural properties of the CNT processed with aqueous solution and TRC are also included in this section.
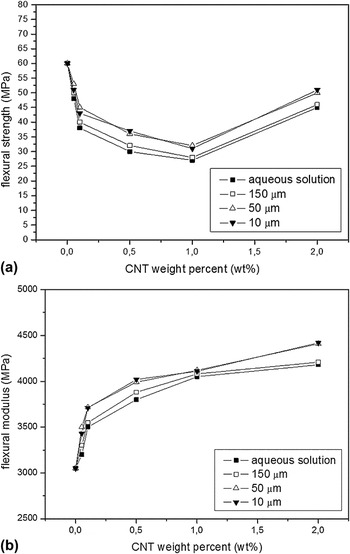
Figure 6 shows the variation of flexural modulus of the phenolic resin/CNT nanocomposites, with increasing amount of CNTs.
Flexural modulus results of the phenolic resin/CNT nanocomposite processed by TRC and aqueous solution.

According to this figure, the flexural modulus of the composites increases gradually with the amount of reinforcement and reaches a saturation value of around 4 GPa with 1.0 wt% CNTs for specimens prepared by aqueous solution and by TRC with 150 and 50 μm roller distances. In numerical terms, the modulus of the composites increases by 60% of the neat resin value at 2.0 wt% CNTs loading when also using TRC with 150 and 50 μm roller distances. Also, the flexural modulus values were higher in specimens processed with TRC (10 μm). The improvement in modulus is due to the combination of better CNT dispersion and stronger filler-matrix adhesion resulting from the TRC process. The flexure modulus was initially similar between all specimens but the composites processed outperformed when the CNT content was 1.0 wt%. These observations suggest that the CNTs are more effective in enhancing mechanical properties of composites, particularly at high CNT content. Similar gain of properties in phenolic resin reinforced by CNTs has been reported, but not concerning the differences in process parameters.Reference Yip and Wu16
D. Impact properties
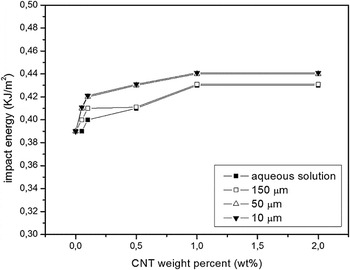
Figure 7 shows how the state of dispersion of the CNTs in the phenolic resin affects the impact energy of the composites containing different amounts of CNTs.
Impact results of the phenolic resin/CNT nanocomposite processed by TRC and aqueous solution.

As can be observed, the increase of impact energy was very small when compared with the tensile behavior. It was observed that the impact resistance increased with the number of passes through the calender. This increase was more significant for distances of 50 μm, after that the values of the impact energy remained almost constant. These results show that high-speed fracture tests, such as the Charpy impact tests, are not as sensitive to the state of agglomeration of the fillers in the matrix as the tensile tests, where the speed of crack propagation is considerably lower.
Figure 7 also provides a comparison between the impact energy for phenolic resin, reinforced with different amount of CNTs. The results offered an improving effect of the nanotubes on the impact behavior for all volume loadings tested. This reinforcement seemed to be effective already at low filler contents of only 0.05 wt% and reached the highest level observed for the present series at 1.0 wt% CNT. Once that maximum value was reached increasing the volume content of CNT did not change the impact energy significantly, a behavior similar to the one observed for both the modulus and strength of the CNT-reinforced composites.
As mentioned earlier, unreinforced phenolic resins can be considered as brittle materials and they exhibit a high sensitivity to notches, microcracks, and local inhomogeneities. The reason for this is that notches act as stress concentrators and much of the deformation of the sample on impact takes place in the vicinity of the notch tip where a higher apparent strain rate occurs in comparison with unnotched specimens.
Therefore, in this study, the presence of CNTs had a beneficial effect at low-volume concentrations. However, the presence of more CNTs in the resin did not further increase the resistance to impact fracture. A possible explanation is that CNTs agglomerates, more numerous with higher-volume loadings, act as stress concentrators and counteract the reinforcing effects of the individual CNT. Furthermore, the high aspect ratio of the CNT might induce additional stresses. These same effects were confirmed by Ref. Reference Abdalla, Dean, Adibempe, Nyairo, Robinson and Thompson1, who found that for epoxy resin reinforced with CNT, the impact properties of polymers are mainly enhanced by small particles with low aspect ratio, since large particles can act as crack initiation sites and high aspect ratio particles are able to induce large stress concentrations near their edges.
E. Tribological performance
The friction force generated by applying the brake is susceptible to changes in the sliding conditions. This is because the contact geometry at the sliding surface changes when the sliding conditions, such as pressure, temperature, and sliding speed, are changed. In addition, the chemistry of the sliding surface also affects the friction and wear of materials. Therefore, maintaining the friction force at a certain level is difficult when a brake is applied over a wide range of sliding conditions. However, commercial friction materials require a consistent friction force over a wide range of sliding conditions for safe and comfortable braking.Reference Hwang, Jung, Cho and Jang13
For confirming the improvement in friction stability attributable to the use of the CNTs, the average of the wear resistance was measured for all specimens in study. Also the density in each case has been obtained for calculating the wear resistance (Table II).
Density results (g/cm3) of the phenolic resin/CNT nanocomposite processed by TRC and aqueous solution.

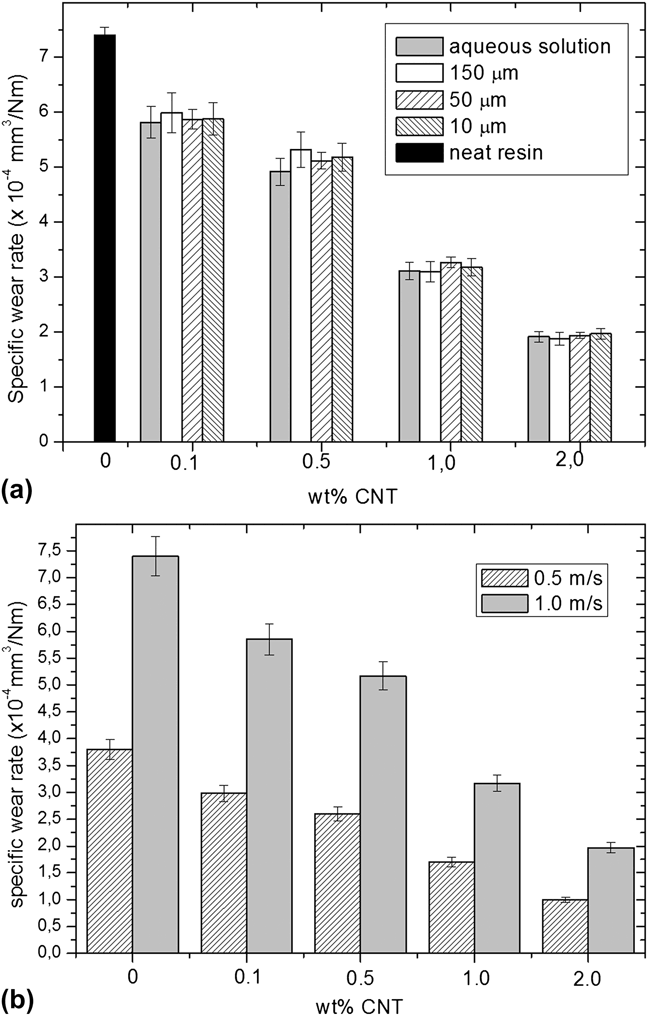
From Fig. 8(a), it was also possible to observe that the wear resistance did not increase with the number of passes through the calender. Also, considering the specimens prepared using aqueous solution, the wear resistance results were similar to those found by the TRC method. These results show that this test is not as sensitive to the state of agglomeration of the fillers in the matrix as the tensile and impact tests.
Specific wear rate of the phenolic resin/CNT nanocomposite: (a) processed by TRC and aqueous solution; (b) 0.5 wt% CNT in TRC (10 μm), in two different velocities.
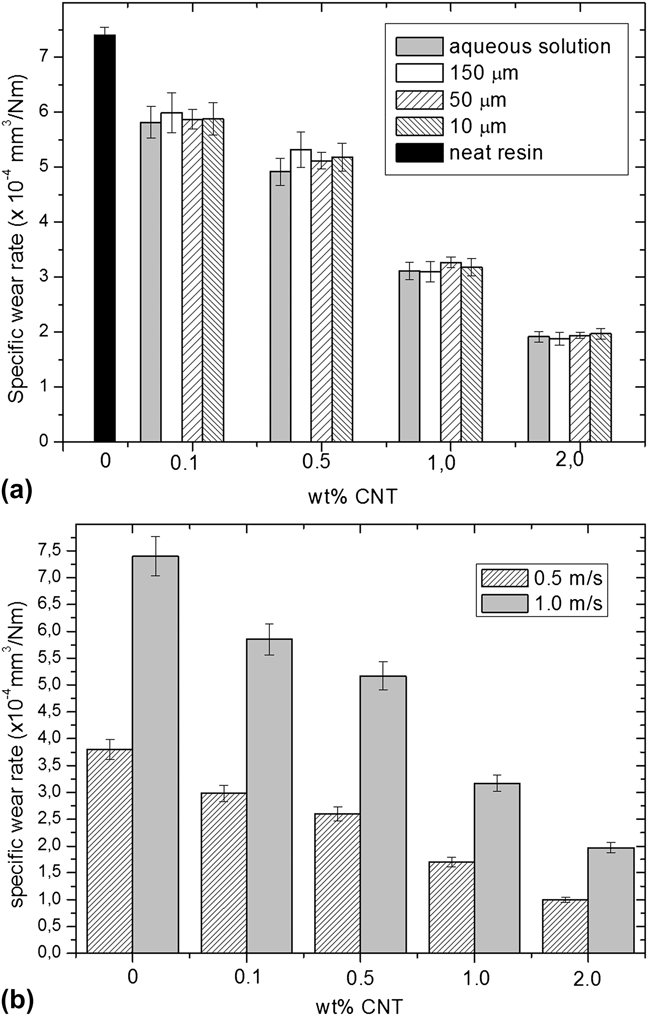
Figure 8(b) shows the wear rates of phenolic resin with different amounts of CNT, processed by TRC (10 μm) as functions of sliding velocity. In all cases, it can be observed that the increases of sliding velocity leads to higher wear rates. Under 1 N, when the sliding velocity is increased from 0.5 to 1.0 m/s, the wear rate is sharply increased.
IV. CONCLUSIONS
In this article, the mechanical properties of the phenolic matrix-based nanocomposites reinforced by MWCNTs were investigated experimentally. According to the results, the CNTs as reinforcement of the base matrix seem to be optimal with loadings around 1.0% by weight for obtaining maximum gain in the mechanical and rheological properties. In this situation, an average increase of 30–50% in the values in mechanical properties was observed in tensile, impact and flexural strengths. The theoretical models used confirm the experimental results. The tests demonstrate the specific wear rate decreases when the CNT content increases, probably due to the role of transfer films in reducing the wear, it has led to the theories according to which the wear reductions are due to the adhesive strength increase of the protective films.
ACKNOWLEDGMENTS
The authors acknowledge financial support received from FAPESP (under Grant No. 2009/06335-9) and CNPq under Grant No. 306053/2006-3.