Implications
A consequence of the high milk yielding nature of today’s dairy cow is negative energy balance (EB), potentially causing metabolic stress and reduced fertility. A shorter dry period (DP) moves part of the cow’s milk production to a period before calving, improving health and fertility. The present results indicate that a shorter DP reduced milk production after calving but the feed intake was not affected. Thus EB was improved. Furthermore, there were no interactions between breed and DP for milk production, EB and dry matter intake (DMI).
Introduction
The DP is generally considered the cow’s resting period and is commonly set 6 to 8 weeks before calving (Annen et al., Reference Annen, Collier, McGuire and Vicini2004a). Previous studies (Swanson, Reference Sverige1965; Coppock et al., Reference Coppock, Everett, Natzke and Ainslie1974) have shown maximal milk yields (MYs) with DPs of this length, but these data could be inaccurate for the high-yielding cow of today. During the past decade, research has shown health (Rastani et al., Reference Rastani, Grummer, Bertics, Gümen, Wiltbank, Mashek and Schwab2005), management and economic (Heeren et al., Reference Heeren, Steeneveld and Berentsen2014) benefits by shortening or omitting the DP. Milk yield has not been affected in some of these studies (Bachman, Reference Bachman2002; Annen et al., Reference Annen, Collier, McGuire, Vicini, Ballam and Lormore2004b), while in some studies a shorter DP has resulted in lower MY over the first weeks postpartum (Rastani et al., Reference Rastani, Grummer, Bertics, Gümen, Wiltbank, Mashek and Schwab2005; Steeneveld et al., Reference Steeneveld, van Knegsel, Remmelink, Kemp, Vernooij and Hogeveen2014). However, when including the milk produced during the additional weeks of milking prepartum, differences in total MYs might be compensated for, resulting in no loss or even more milk produced overall (Santschi et al., Reference Santschi, Lefebvre, Cue, Girard and Pellerin2011). High MY and limited DMI in early lactation result in negative EB (Ingvartsen and Andersen, Reference Ingvartsen and Andersen2000). Shortening the DP has been highlighted in recent years for its potential health benefits due to an improved EB (Grummer and Rastani, Reference Grummer and Rastani2004; van Knegsel et al., Reference van Knegsel, Remmelink, Jorjong, Fievez and Kemp2013). As a consequence of equal DMI and decreased MY in early lactation, EB has shown to be improved in cows with a short DP (Andersen et al., Reference Andersen, Madsen, Larsen, Ingvartsen and Nielsen2005). However, most studies of short DP have been performed on Holstein cows, while information about the effects of a short DP in dual-purpose breeds has not been thoroughly studied. Recent studies have shown differences in genes regulating feed efficiency between Jersey and Holstein breeds indicating phenotypic differences in feed efficiency between breeds (Salleh et al., Reference Salleh, Mazzoni, Höglund, Olijhoek, Lund, Løvendahl and Kadarmideen2017). Feed efficiency, commonly quantified as residual feed intake (RFI) is a tool to assess feed efficiency independently of production. It represents the difference between an animal’s observed feed intake and its predicted intake based on milk energy output, maintenance energy and body energy change (Vandehaar et al., Reference Swanson2016). The effect of DP length on RFI has apparently not been addressed. We hypothesised that MY from 8 weeks prepartum until 12 weeks of lactation would increase with short DP and that early lactation EB would be improved compared with a traditional DP of 8 weeks. The objectives of this study were to investigate the effects of DP length, 4 weeks (4W) or 8 weeks (8W), and the interaction of DP length with two different types of dairy breeds, Swedish Holstein (SH) and Swedish Red (SR), by studying MY and composition, DMI, EB and RFI.
Material and methods
The work was carried out during the winter feeding period in 2 consecutive years (2012 to 2014), at the Swedish Livestock Research Centre, Lövsta, Swedish University of Agricultural Sciences, Uppsala, Sweden. Mean herd annual milk production per cow was 9814 kg energy-corrected milk (ECM) during 2012 to 2013 and 10 328 kg ECM during 2013 to 2014. The experimental design and all handling of animals were approved by Uppsala Ethics Committee, Sweden (C217812/13).
Animals and management
Multiparous cows of SR (n=43) and SH (n=34) were blocked by breed and parity and then randomly allocated to two different treatments; traditional DP length of 8 weeks (8W) or short DP length of 4 weeks (4W), actual average DP length was 58 days for the 8W and 30 days for the 4W. All cows included had an udder disease score <5, yielded at least 15 kg milk/day 10 weeks prepartum and were not treated with antibiotics at drying-off or during the DP. An udder disease score is based on individual somatic cell counts (SCC) from three consecutive monthly test milkings, corrected for MY, breed, parity and days in milk. The scale runs from 0 to 9 and expresses the probability that a cow has sub-clinical infectious mastitis, where >5 implies a >50% probability of infection (Brolund, Reference Brolund1990). Cows subjected to the 4W treatment were milked until 4 weeks before the expected calving date. The milking was carried out in an automatic rotary system (DeLaval AMRTM, Tumba, Sweden) twice a day, at 0530 and 1530 h. Due to farm practicalities, 13 of the cows were milked in a voluntary milking system (VMS DeLaval, Tumba, Sweden) for the last 6 to 12 weeks of the study. These 13 cows were distributed as follows: the 4W group – two SH parity >2, last 5.7 weeks of trial; four SR parity 2, last 4.8 weeks of trial; three SR parity >2, last 3.3 weeks of trial. The 8W group – one SH parity 2, last 2.7 weeks of trial; two SR parity 2, last 4.1 weeks of trial; one SR parity >2 last 3.3 weeks of trial. All cows were kept indoors in a loose-housing system, with free access to cubicles with rubber mats and wood shavings. Cows were moved to a drying-off pen on day one after morning milking, they were milked again once on day 3 and then on day 6 and depending on MY (>25 kg/day in the week before drying off), again on day 8. The concentrate allowance was during 1 week, gradually reduced to zero 2 days before drying off. Cows were enrolled in the study from 10 weeks before expected calving to 12 weeks postpartum. Ten weeks before expected parturition MYs and BW (kg±SD) were as follows: The 8W group – eight SH parity 2, 20.8±5.5 kg milk/day, 701 ±50.8 kg; six SH parity >2, 21.0±3.7 kg milk/day, 690±49.2 kg; 12 SR parity 2, 21.2±5.3 kg milk/day, 684±56 kg; eight SR parity >2, 20.2±5.4 kg milk/day, 710±71.3. The 4W group – 12 SH parity 2, 24.1 ±4.7 kg milk/day 684±58.2 kg; eight SH parity >2, 30.2±5.2 kg milk/day, 719±61.7 kg; 14 SR parity 2, 21.2±3.6 kg milk/day, 652±40 kg; nine SR parity >2, 22.4±4.5 kg milk/day, 694± 63.8 kg.
Rations and diets
Dry cows were fed ~4 kg DM/day grass silage and had ad libitum access to straw, but did not receive any concentrate. Feed intake was not recorded for the dry cows. The lactating cows were fed silage and concentrate separately and received 5 kg DM concentrate/day after parturition and the amount was then increased by 0.4 kg DM/day to a maximum level of 15 kg DM/day. All cows were equipped with neck transponders and concentrate was fed individually in feeding stations (DeLaval). The feeding system was able to distribute, and record, consumption of two different concentrates at the same time. Silage was provided ad libitum and individual silage intake among lactating cows was recorded using BioControl feed bunks (BioControl, Rakkestad, Norway). Water and mineral mixture were available ad libitum. After parturition, older cows (parity 3 or older) were given an oral milk fever prophylactic treatment containing calcium (Bovikalc®, Boeringer Ingelheim GmbH, Ingelheim am Rein, Germany).
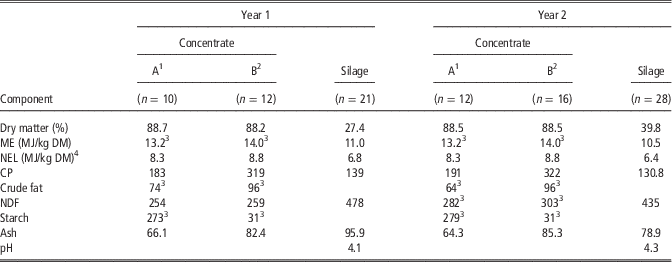
The ingredient composition of the concentrates varied slightly over the 2 years, but the concentrate contained: barley, wheat, rapeseed meal, palm kernel expeller, triticale, corn, dried distillers grain, oats, oat shells, dried beet pulp, wheat bran, peeled soya bean meal, potato proteins, molasses, fatty acids, malt sprouts, sodium chloride, magnesium oxide, limestone, calcium carbonate and vitamins. Samples of concentrate were collected once every second week, with two consecutive samples were pooled into one. Silage was sampled Monday to Friday every week and pooled into one sample every second week. The samples were stored at −20°C. Conventional chemical analyses of dry matter (DM), CP and ash were performed on concentrate and silage. Silage was also analysed for NDF. Metabolisable energy (ME) in silage was calculated from in vitro digestibility (VOS) according to Lindgren (Reference Kok, van Middelaar, Engel, van Knegsel, Hogeveen, Kemp and de Boer1979). pH was determined in silage juice. See Table 1 for chemical composition of feeds.
Composition of the concentrates and grass silage used (g/kg dry matter (DM) unless otherwise stated)

ME=metabolisable energy.
Average of n=number of pooled samples. The mineral mixture contained (%): Ca (14.6), P (7.9), Mg (9.5) and Na (6.8); year 2: Ca (16.3), P (6.5), Mg (6.5) and (Na 7.7) (Kvarnbyfoder, Sweden).
1 Low protein concentrate ‘Solid 120 or Solid 620’ (one of the two were fed together with Unik 82) manufactured by Lantmännen lantbruk, Malmö, Sweden.
2 High-protein concentrate ‘Unik 82’, manufactured by Lantmännen lantbruk, Malmö, Sweden.
3 Nutrient content guaranteed by the feed manufacturer (Lantmännen lantbruk, Malmö, Sweden).
4 Net Energy Lactation, calculated according to Van Es (Reference Vandehaar, Armentano, Weigel, Spurlock, Tempelman and Veerkamp1975).
Body weight, body condition scoring and energy balance
Body weight was automatically recorded (AWS 100; DeLaval International, Tumba, Sweden) after each milking, a weekly average was calculated for week 1, 4, 8 and 12 postpartum. Dry cows were weighed for BW once at week 8 and 4 prepartum. Body condition score was rated at 8 and 4 weeks prepartum and week 1, 4, 8 and 12 postpartum by two trained individuals using a five-point scale (Gillund et al., Reference Gillund, Reksen, Karlberg, Randby, Engeland and Lutnaes1999) with quarter-points increments, where 1 is severe undercondition and 5 is severe obesity.
Energy balance and RFI were calculated as follows:
 $$\eqalignno{ & {\rm EB}\, {\equals}\, \left {\left( {{\rm NE}_{{{\rm intake}}} } \right.} \right)\, {\minus}\, \left( {{\rm NE}_{{{\rm maintance}}} {\plus}{\rm NE}_{{{\rm lactation}}} } \right) \cr & {\rm RFI}\, {\equals}\, \left( {{\rm NE}_{{{\rm intake}}} } \right)\, {\minus}\, \left( {{\rm NE}_{{{\rm maintance}}} {\plus}{\rm NE}_{{{\rm lactation}}} \, {\minus}\, {\rm NE}_{{{\rm mobilisation}}} {\plus}{\rm NE}_{{{\rm deposition}}} } \right) $$
NEintake, NEmaintance, NElactation, NEmobilisation, NEdeposition were calculated according to the NorFor system (Volden, Reference van Knegsel, van der Drift, Čermáková and Kemp2011).
Milk sampling
Milk yield was automatically recorded at each milking session. Milk samples, 25 ml, were collected from an afternoon milking and the following morning every fourth week into tubes prepared with bronopol, stored at 4°C and analysed the day after sampling. The samples were analysed for composition of fat, protein and lactose by infrared Fourier transform spectroscopy (MilkScan FT120 Foss, Hillerød, Denmark). Energy-corrected milk was calculated according to Sjaunja et al. (Reference Sjaunja, Baevre, Junkkarinen, Pedersen and Setala1991).
Statistical analysis
Milk production, BW and BCS were determined in all cows included in the study (n=77). Due to problems not related to the experiment, forage intake data were partially lacking for eight cows (4W group – one SH parity 2, two SH parity >2, two SR parity 2, two SR parity >2; 8W group – one SR parity>3). These cows were therefore excluded from the data set used for determination of feed intake, EB and RFI. Feed intake data and milk production data were also lacking for cows occasionally held in a sick pen. When intake data were lacking for short periods (<14 days) because of mastitis (n=9), lameness or wounds (n=6), bloat (n=1), retained placenta (n=1) or circulatory disorders (n=1), the remaining data were used.
Data were analysed with the statistical software SAS 9.3 (SAS institute Inc., Cary, NC, USA, 2010). The PROC MIXED model with repeated measurements was used to study the daily average per cow per lactation week for milk production, feed intake, EB and feed efficiency measurements with the following model:
 $$Y\, {\equals}\, {\rm treatment}{\plus}{\rm breed}{\plus}{\rm parity}\,{\rm class}{\plus}{\rm lactation}\,{\rm week}{\plus}{\rm cow}{\plus}{\rm year}$$
where cow and year are random effects and Y is the dependent variable. Interactions between treatment and breed and treatment and lactation week were included in all models, but taken out of the model when not significant. As observations are made several times on the same animal, the model also estimates the correlation in time using a spatial power correlation structure.
The same model was used for BW and BCS, although only for lactation week −8, −4, 1, 4, 8 and 12. PROC MIXED was also used when analysing the overall average milk composition and total yield, using one data point per cow for the experimental period, but the only random effect in the model was then year. Multiparous cows (parity 3 or older) formed one parity class and all cows approaching their second parturition another. Parity class or interactions with parity class were included in all models, but the interactions were excluded from the model if they were not significant. Least square means were calculated using the SAS statement LSMEANS/PDIFF.
Results
Milk production
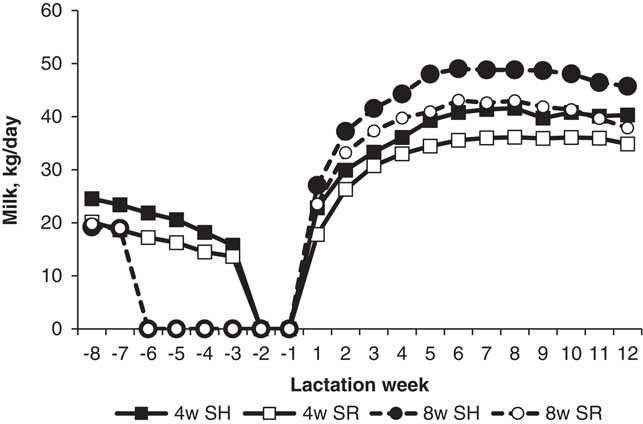
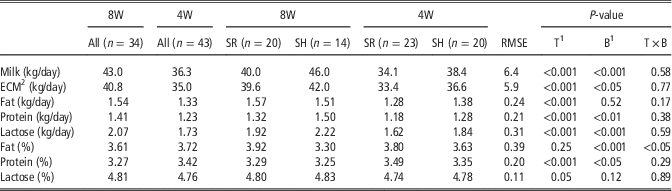
The patterns of daily milk production during the entire experimental period are shown in Figure 1. Total milk production during the period from 1 to 12 weeks postpartum was lower for SR than SH (P<0.001) and cows in the 4W treatment produced less than those in the 8W treatment (P<0.001) (Table 2, Figure 1). Week of lactation had a significant effect on MY (P<0.001). In total, over the first 12 weeks of lactation, cows with a 4W DP produced significantly (P<0.001) less milk (2931 kg) than cows with a 8W DP (3470 kg). However, when the milk produced before calving was included (lactation week 9 prepartum to week 12 postpartum), the two groups produced virtually similar amounts of milk, 3724 kg (4W) and 3684 kg (8W), respectively (P=0.7).
Milk production (kg/day), least square means (LSM), for the two treatments 4 weeks (4W) and 8 weeks (8W) dry period and the two cow breeds Swedish Red (SR) and Swedish Holstein (SH) (4W SH n=20, 4W SR n=23, 8W SH n=14, 8W SR n=20).

Milk production and milk composition during weeks 1 to 12 postpartum, least squares mean (LSM) and root mean square error (RMSE), for the two treatments (T) 4 weeks (4W) and 8 weeks (8W) dry period in the two cow breeds (B): Swedish Red (SR) and Swedish Holstein (SH)

1 Estimated without the T×B interactions.
2 ECM=energy-corrected milk according to Sjaunja et al. (Reference Sjaunja, Baevre, Junkkarinen, Pedersen and Setala1991).
The percentage of protein in milk was higher among 4W cows and the lactose percentage was lower (Table 2). The yield of fat, protein and lactose was lower for the 4W cows. The yield of protein and lactose was higher in SH cows than SR, but fat and protein percentage was lower for SH cows than SR cows (Table 2). There was an interaction between breed and DP length (P<0.05), whereby SH cows with 4W DP had higher fat percentage than SH cows with 8W DP, while SR cows showed the opposite pattern (Table 2). Parity had no effect on MY or milk composition.
Body condition score and weight
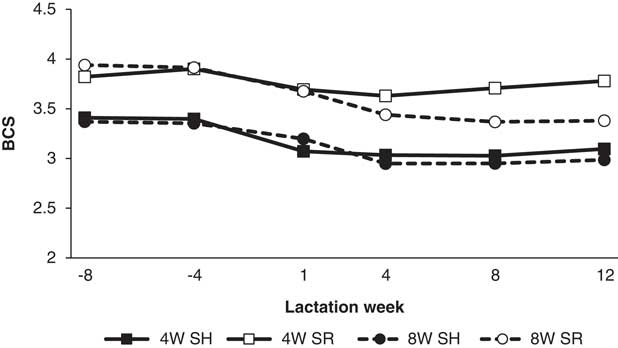
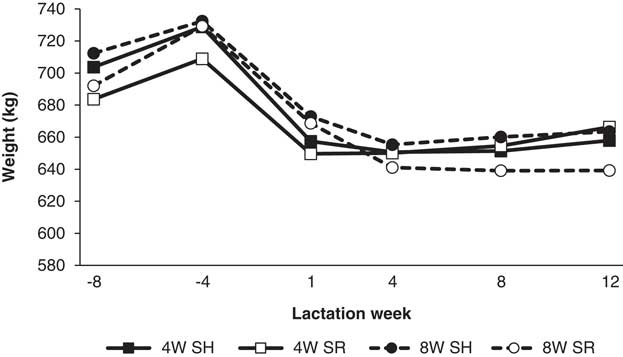
Changes in BCS and BW are presented in Figures 2 and 3. There was an interaction between DP length and lactation week and 8W cows lost more in BCS after calving (P<0.05). Week of lactation had a significant effect on BCS (P<0.001). There was also a breed effect on BCS, where the SR cows had an overall higher BCS than the SH cows (SR=3.7, SH=3.2, P<0.001). As observed for BCS, an interaction was also found for BW between DP length and lactation week (P<0.05). Week of lactation had a significant effect on BW (P<0.001). There were no breed differences, but parity had an effect on BW, with younger cows having lower BW than older cows (parity 2=650 kg, parity ⩾3=697 kg, P<0.001).
Body condition score (1 to 5) for the two treatments 4 weeks (4W) and 8 weeks (8W) dry period and the two cow breeds Swedish Red (SR) and Swedish Holstein (SH) (4W SH n=20, 4W SR n=23, 8W SH n=14, 8W SR n=20).

Body weight (kg) for the two treatments 4 weeks (4W) and 8 weeks (8W) dry period and the two cow breeds Swedish Red (SR) and Swedish Holstein (SH) (4W SH n=20, 4W SR n=23, 8W SH n=14, 8W SR n=20).

Dry matter intake, energy balance and feed efficiency
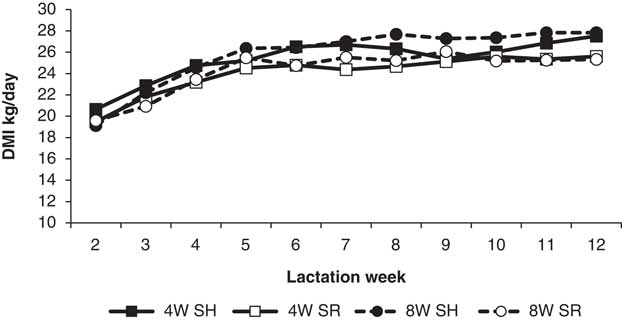
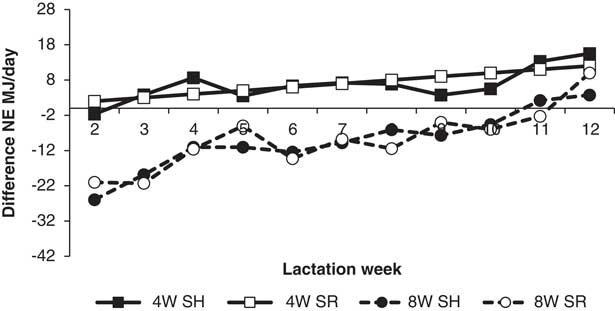
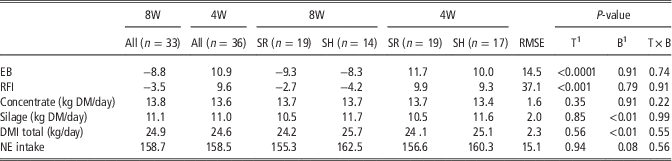
Dry matter intake did not differ between the two DP treatments (Figure 4). However, there was a breed effect, with the SR cows consumed less total DM and silage DM than the SH cows (P<0.01) (Table 3). Cows subjected to the 4W treatment were in positive EB almost throughout the entire study period, while the 8W cows entered positive EB in lactation week 11 to 12 (Figure 5). Energy balance was affected by DP treatment (P<0.001). An interaction was found between parity and treatment for EB, the EB for parity groups as follows: 4W parity 25.4 MJ/day, 4W parity >216.4 MJ/day, 8W parity 2 −5.2 MJ/day, 8W parity >2 −12.4 MJ/day (P<0.05). When comparing feed efficiency as RFI for the two treatments, the 4W group had a higher RFI, leading to lower feed efficiency than the 8W group, but there was no difference between breeds (Table 3).
Dry matter intake (DMI, kg/day) during lactation weeks 2 to 12 postpartum for the two treatments 4 weeks (4W) and 8 weeks (8W) dry period and the two cow breeds Swedish Red (SR) and Swedish Holstein (SH) (4W SH n=17, 4W SR n=19, 8W SH n=14, 8W SR n=19).

Energy balance (difference in net energy (NE), MJ NE/day) during lactation week 2 to 12 postpartum for the two treatments 4 weeks (4W) and 8 weeks (8W) dry period and the two cow breeds Swedish Red (SR) and Swedish Holstein (SH) (4W SH n=17, 4W SR n=19, 8W SH n=14, 8W SR n=19).

Energy balance (EB, MJ NE/day), feed efficiency (residual feed intake (RFI), MJ NE/day) and dry matter intake (DMI, kg/day) of concentrate and silage, net energy intake (MJ NE/day), least squares mean (LSM) and root mean square error (RMSE), during weeks 2 to 12 postpartum for the two treatments (T) 4 weeks (4W) and 8 weeks (8W) dry period in the two cow breeds (B) Swedish Red (SR) and Swedish Holstein (SH)

1 Estimated without the T×B interaction.
Discussion
Milk yield and content
Milk production postpartum for 4W cows was ~15% lower than for 8W cows, and both SH and SR cows responded with the same reduction in MY when subjected to the 4W treatment. The reduction was greater than described by Bernier-Dodier et al. (Reference Bernier-Dodier, Girard, Talbot and Lacasse2011) and Rastani et al. (Reference Rastani, Grummer, Bertics, Gümen, Wiltbank, Mashek and Schwab2005). According to national cattle statistics for Sweden, cows of the SR breed yield ~11% less milk than SH cows (Sverige, Reference Weber, Wallace, Hansen, Chester-Jones and Crooker2014), which is in line with the results of the present study. Although the 4W group produced less milk after parturition, the two groups produced equal amounts of milk in total from 9 weeks prepartum until 12 weeks postpartum. Kok et al. (Reference Lindgren2016) recently published a paper presenting alternative ways of calculating lactation production, as the commonly used 305-day production measure is less adequate when comparing cows that have shorter than conventional DP. For cows with a short DP, it is important that all of their milking days are included in the calculation. It has been shown in several other studies that second parity cows respond with a more marked reduction in milk production if subjected to short DP compared with older cows (Pezeshki et al., Reference Pezeshki, Mehrzad, Ghorbani, Rahmani, Collier and Burvenich2007; Santschi et al., Reference Santschi, Lefebvre, Cue, Girard and Pellerin2011). However, in the present study there was no interaction between parity and DP length on postpartum MY, but there were less old cows than younger in the study. This is in line with findings in a recent study by Steeneveld et al. (Reference Steeneveld, van Knegsel, Remmelink, Kemp, Vernooij and Hogeveen2014) of higher MY in second parity cows subjected to a 30-day DP than in older cows when yield before parturition was also included. Those authors suggested that 30-day DP is more suitable for primiparous than for multiparous cows.
The higher protein content in the 4W cows is in line with several other studies summarised by van Knegsel et al. (Reference van Knegsel, Remmelink, Jorjong, Fievez and Kemp2013). Improved metabolic status of cows with shorter DP has recently been shown to be related to metabolites involved in the energy cycle of mammary epithelial cells, which stimulate mammary protein synthesis (de Vries et al., Reference de Vries, Brandt, Lundh, Holtenius, Hettinga and Johansson2016). It is thus possible that the higher protein content in the cows with shorter DP was related to the improved EB, but it has to be underlined that the daily protein yield was lower. The fat content, on the other hand, was not affected by DP length, which is also in line with previous studies (van Knegsel et al., Reference van Knegsel, Remmelink, Jorjong, Fievez and Kemp2013), also, the fat yield was lower for cows in the 4W group.
Energy balance and dry matter intake
Although cows with shorter DP responded with lower MY, DMI did not differ between the two DP groups. The result is in line with previous studies (Rastani et al., Reference Rastani, Grummer, Bertics, Gümen, Wiltbank, Mashek and Schwab2005; van Knegsel et al., Reference Van Es2014). The SR cows with short DP were in positive EB already in the second week after parturition and the SH cows were in balance after three weeks. The rapid return to positive EB in 4W cows was probably an effect of the high content of energy in the diet. However, early lactating dairy cows in negative EB are often not metabolically dysregulated and they cope well with the metabolic changes related to the rapid onset of milk production (Weber et al., Reference Volden2007). Thus, the value of reducing the negative EB after calving by shortening the DP, especially in SR, cows were probably limited.
The EB of second parity cows was less affected by DP length than older cows. It might be speculated that second parity cows, in line with heifers (Janovick and Drackley, Reference Janovick and Drackley2010), do not mobilise body reserves to the extent that older cows do. The positive EB among the 4W cows was not reflected in a concomitant improvement in body condition. Cows with a short DP had higher RFI, indicating reduced feed efficiency. Herd and Arthur (Reference Herd and Arthur2009) estimated that tissue metabolism explained 37% of the variation in RFI in cattle. It is possible that tissue metabolism was influenced by the DP length which in turn affected RFI. When RFI is calculated it is adjusted for body energy changes, which are estimated by changes in BCS. However, BCS may not be significantly related to changes in internal fat stores (Drackley et al., Reference Drackley, Wallace, Graugnard, Vasquez, Richards and Loor2014; Nikkhah, Reference Nikkhah2015) this is a weakness of the present study which might have influenced the RFI calculations. However, the increase in BW after parturition was moderate in cows subjected to a short DP and does not indicate large deposition of abdominal fat. The SH had higher DMI than the SR cows, which is explained by higher silage intake as the concentrate allowance was restricted and did not differ between treatments or breeds. The BW did not differ between breeds and SH cows apparently had a higher capacity for forage intake than the dual-purpose breed SR. The SR had higher BCS, indeed 43% of the SR cows had BCS above 3.75 in the first week after parturition (data not shown). Such a BCS could reduce postpartum DMI (Roche et al., Reference Roche, Mackey and Diskin2000; Agenas et al., Reference Agenas, Burstedt and Holtenius2003). It is also possible that the higher potential for milk production among SH cows contributed the higher intake. The SH cows, bred for milk production, did not have higher feed efficiency for milk production than the dual-purpose breed SR. This study appears to the first to compare RFI between dual-purpose and milk breeds and more studies are required to confirm this result.
Conclusions
Shortening the DP reduced daily MY without affecting feed intake. Thus the postpartum negative EB was reduced. Residual feed intake was reduced for 4W cows. The milk produced by 4W cows prepartum balanced out the loss in MY during the 12 weeks postpartum and the protein content in milk was higher for the 4W cows. Concerning MY, milk composition, EB, RFI and DMI cows of both SR and SH responded equally to a short DP, as did cows of different parities, except for EB.
Acknowledgements
The authors acknowledge the Swedish Farmers’ Foundation for Agricultural Research for funding this project.