Implications
Dietary supplementation of cattle with anionic salts promotes metabolic acidosis, which can stimulate Ca release from bone reserves and improve sensitivity of hormone receptors, preventing hypocalcaemia; supplementation with 25-hydroxyvitamin D (25(OH)D) on the other hand appears to initiate active Ca absorption from the small intestine independent of endogenous hormonal controls. Moderate reduction in dietary cation–anion differences results in little bone Ca resorption but may still result in improved hormone receptor sensitivity, and when combined with 25(OH)D, supplements may increase Ca availability and reduce hypocalcaemia in cattle.
Introduction
Extracellular Ca in ruminants is required to meet various demands including lactation, foetal growth, endogenous digestive loss and neuromuscular requirements (Horst et al., Reference Horst, Goff and Reinhardt1994). However, periparturient hypocalcaemia in clinical or subclinical form in ruminants is common and is a consequence of a deficiency in extracellular Ca (Horst, Reference Horst1986; Fleischer et al., Reference Fleischer, Metzner, Beyerbach, Hoedemaker and Klee2001). The major sources of Ca are dietary and the labile reserves contained within the skeleton. Horst et al. (Reference Horst, Goff and Reinhardt2003) suggested that if hypocalcaemia is to be completely avoided Ca inputs from both of these pools need to be increased. However, the hormonal response required to increase Ca availability requires a period of time, or a ‘lag period’, to effectively increase ionised Ca entry into the blood pool (Block, Reference Block1994). Pre-emptive promotion of ionised Ca entry into the blood pool would circumvent this lag period.
Dietary cation–anion difference (DCAD) is a measure of the dietary balance of strong anions, predominately sulphur and chloride, and the cations, potassium and sodium. A strongly anionic diet will result in compensated metabolic acidosis, whereas a cationic diet will increase metabolic alkalinity (Ender et al., Reference Ender, Dishington and Helgebostad1962). Metabolic alkalosis may result in an increased insensitivity of cellular receptors to parathyroid hormone (PTH). This can lead to a delay in both the release of Ca from skeletal storage and active absorption in the small intestine when a sudden Ca demand is initiated (Goff and Horst, Reference Goff and Horst2003). Anionic diets have been shown to increase both Ca absorption and skeletal mobilisation before parturition and therefore have been effective at reducing the incidence of hypocalcaemia (Fredeen et al., Reference Fredeen, DePeters and Baldwin1988; Goff et al., Reference Goff, Horst, Mueller, Miller, Kiess and Dowlen1991; DeGroot et al., Reference DeGroot, Block and French2010).
Active absorption of Ca from the digestive tract is controlled by active vitamin D (1,25(OH)2D3), and plasma concentration of 1,25(OH)2D3 is elevated in animals on low dietary Ca intake (Liesegang and Risteli, Reference Liesegang and Risteli2005). Increased serum concentration of 1,25(OH)2D3 will increase bone resorption with the presence of PTH, in order to maintain plasma Ca (Block, Reference Block1984; Gaynor et al., Reference Gaynor, Mueller, Miller, Ramsey, Goff and Horst1989). Dietary supplementation with 25-hydroxyvitamin D (25(OH)D) has been shown to increase both plasma 25(OH)D and 1,25(OH)2D3 concentrations in cattle regardless of the Ca status of the animal (Cho et al., Reference Cho, Choi, Hwang, Kim and Myung2006). Therefore, it is possible to increase the concentration of 1,25(OH)2D3 via dietary supplementation with 25(OH)D and this could potentially initiate increased absorption of Ca from the small intestine, but not bone resorption, in the absence of PTH (Suda et al., Reference Suda, Ueno, Fujii and Shinki2003).
However, regardless of the plasma concentration of 1,25(OH)2D3, supraphysiological plasma concentrations of 25(OH)D (i.e. >200 ng/ml) have been shown to increase plasma Ca and P concentration in cattle (Hollis et al., Reference Hollis, Conrad and Hibbs1977) and replace the majority of the functions of 1,25(OH)2D3 in mice (Rowling et al., Reference Rowling, Gliniak, Welsh and Fleet2007). Thus, large doses of 25(OH)D should increase the rate of absorption of Ca from the digestive tract.
Blood Ca concentrations are normally maintained at relatively constant levels, and therefore an increased entry of Ca into the plasma pool will result in increased output of Ca in urine (Schonewille et al., Reference Schonewille, Vantklooster, Dirkzwager and Beynen1994; Kurosaki et al., Reference Kurosaki, Yamato, Mori, Imoto and Maede2007). The increased output of Ca in urine is therefore a direct indication that Ca mobilisation from skeletal reserves or increased absorption from the intestine (or both) have been initiated.
An experiment designed to evaluate the effect of DCAD and the effect of dietary supplements of 25(OH)D was conducted at the University of New England, Australia. A comparison of estimating urinary Ca excretion from urine spot samples and urine total collection was undertaken to evaluate whether the spot sampling procedure would enable future studies to be conducted without the hindrance of metabolism crates. In order to facilitate the separate collection of urine and faeces, steers were used as the experimental model. McGrath et al. (Reference McGrath, Savage and Nolan2011) reported similar urine Ca outputs in both non-lactating Holstein cows and steers. Moreover, the steers also exhibited better acceptance and higher intakes of diets containing varying amounts of anionic salts compared with dairy cows.
Material and methods
Animals
Rumen fistulated 18-month-old Brangus steers (n = 18) were allocated to one of six dietary treatments according to live weight (315 ± 45 kg) in a completely randomised block design. The study was approved by the University of New England Animal Ethics Committee.
Treatments and diet
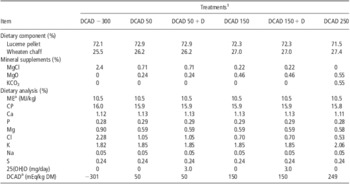
A basal forage diet comprising a mixture of lucerne and wheaten chaff was used throughout the experiment. Six dietary treatments were formulated containing four levels of DCAD. Four levels of DCAD were achieved by varying the amount of MgCl2 and KCO3 to the basal diet. Two of the dietary treatments (DCAD of 50 and 150 mEq/kg dry matter (DM)) also contained supplements of 25(OH)D (Hy-D, DSM Nutritional Products, Wagga Wagga, Australia) to achieve an intake of 3 mg/steer per day.
The steers were provided a 10-day adaption period to each dietary treatment. During this time, the steers were housed in individual pens with ad libitum access to water and feed. On day 11 of the experiment, the steers were placed in individual metabolism crates for a further 5-day period for measurement of daily urine and faeces output. The steers were offered feed twice daily at 0800 and 1600 h and individual feed intakes for each 24 h period were measured before the morning feed. The mineral supplements (Table 1) used to create four levels of DCAD were dissolved in a small volume of water and applied to the forage diet immediately before feeding. Those steers that received the 50 mEq/kg DM plus 25(OH)D and 150 mEq/kg DM plus 25(OH)D diets received the 25(OH)D premix dispersed in 3 ml water, which was injected directly into the rumen through the cannula once daily before the morning feed. The DCAD of the diets was calculated using the equation originally described by Ender et al. (Reference Ender, Dishington and Helgebostad1962) as
 $$ {{\rm{Dietary}}\,{\rm{cation\! \ndash\! anion}}\,{\rm{difference}}\,{\rm{(mEq/kg)}}\ {\rm{ = }}\,\cr &\!\!\!\!\!\!\!\!\!\!\!\!\!\!\!\!\!\!\!\!\!\!\!\!\!\!\!\!\!\!\!\!\!\!\!\!\!\!\!\!\!\!\!\!\!\!\!\!\!\!\!\!\!\!\!\!\!\!\!\!\!\!\!\!\!\!\!\!\!\!\!\!\!\!\!\!\!\!\!\!\!\!\!\!\!\!\!\!{\rm{(mEq}}\;{\rm{N}}{{{\rm{a}}}^{\rm{ + }}} \,{\rm{ + }}\,{\rm{mEq}}\;{{{\rm{K}}}^{\rm{ + }}} {\rm{)}} \,{\rm{ - }}\,{\rm{(mEq}}\;{\rm{C}}{{{\rm{l}}}^{\rm{ - }}} \,{\rm{ + }}\,{\rm{mEq}}\;{{{\rm{S}}}^{{\rm{ - - }}}} {\rm{)}}$$
Description of the basal forage diet and amounts of mineral supplements used to create a range of dietary DCADs

DCADs = cation–anion differences; ME = metabolisable energy; 25(OH)D = 25-hydroxyvitamin D; DM = dry matter.
Mineral analysis of the dietary treatment is also presented (DM basis).
aValues with superscripts are calculated.
1Treatments: DCAD −300 = DCAD −300 mEq/kg; DCAD 50 = DCAD 50 mEq/kg; DCAD 50 + D = DCAD 50 mEq/kg plus 25(OH)D at 3 mg/day; DCAD 150 = DCAD 150 mEq/kg; DCAD 150 + D = DCAD 150 mEq/kg plus 25(OH)D at 3 mg/day; DCAD 250 = DCAD 250 mEq/kg.
Sample collection
Daily total collections of faeces and urine volumes were conducted and proportional subsamples taken and bulked for each animal. Urine was acidified during total collection and stored according to the method described by Chen and Gomes (Reference Chen and Gomes1992). Feed offered was subsampled for DM and nutrient analysis at the commencement of the experiment and at regular intervals during the collection period. In addition to the daily output, spot samples of urine of ∼50 ml were collected from each animal between 0800 and 1000 h every day during the collection period.
Sample analysis
Subsamples of feed offered and refusals were evaluated daily for DM content in order to calculate daily feed intakes. The mineral content (Ca, P, S, Mg and Na) in feed and Ca, P and Mg content of faeces were analysed using an inductively coupled plasma optical emissions spectrometer (ICP-OES, Vista MPX Radial, Varian Pty Ltd, Melbourne, Australia) after perchloric acid and hydrogen peroxide wet digestion (Anderson and Henderson, Reference Anderson and Henderson1986). Chloride concentrations (Christian et al., Reference Christian, Riche and Yates2002) were determined using a continuous flow analyser (SAN ++ Continuous Flow Analyser, Skalar, Breda, The Netherlands). CP was analysed (Etheridge et al., Reference Etheridge, Pesti and Foster1998) by Dumas combustion using an LECO analyser (LECO TruSpec N nitrogen analyser, LECO Corporation, St. Joseph, MI, USA).
Spot urine samples were tested for pH within 1 h of sampling with a pH meter (Ecoscan pH 5/6, Eutech Instruments Pte Ltd, Singapore). Urine samples from the total collection procedures were analysed after a modified wet digestion process (Anderson and Henderson, Reference Anderson and Henderson1986). The filtered urine was combined with concentrated HNO3 (1 : 1) in a screw cap 100 ml glass bottle and heated at 80°C for 1 h before dilution and filtering. The Ca, P and creatinine concentrations in the urine spot samples were measured using an auto analyser (Dade Behring Dimension RXL Clinical Chemistry System, Deerfield, Illinois, USA). Ca concentrations were determined by colorimetric assay following a method adapted from Stern and Lewis (Reference Stern and Lewis1957). Urine P was measured using a phosphomolybdate method developed by Fiske and Subbarow (Reference Fiske and Subbarow1925). Urine creatinine excretion is known to be determined by muscle mass, and therefore highly correlated to live weight (Hobson, Reference Hobson1939). Creatinine was determined using a modified kinetic Jaffe reaction reported by Larsen (Reference Larsen1972), and the following equation was adapted from Chizzotti et al. (Reference Chizzotti, Valadares Filho, Valadares, Chizzotti and Tedeschi2008) to correct for urine concentration.
 $${\rm{C}}{{{\rm{a}}}_{{\rm{ex}}}}\,{\rm{ = }}\,{\rm{C}}{{{\rm{a}}}_{\rm{s}}}{\rm{/(C}}{{{\rm{r}}}_{\rm{s}}}{\rm{/(LW}}\,\times \,{\rm{C}}{{{\rm{r}}}_{{\rm{er}}}}{\rm{)}}$$
where Caex is Ca excretion rate in mg per day, Cas is Ca concentration in the sample, Crs is the creatinine concentration in the sample, LW is the weight of the animal minus 5% (to simulate 12 h off feed) and Crer is the expected creatinine excretion rate (g/kg LW), which is a constant developed by Chizzotti et al. (Reference Chizzotti, Valadares Filho, Valadares, Chizzotti and Tedeschi2008) for cattle of similar age and live weight.
Statistical analysis
Data were analysed as two separate data sets. The results of the daily collection procedures were analysed by repeated measures. This data set contained results for variations in urine pH and urinary creatinine, Ca and P excretion. A second data set represented the results from the 5-day collection periods. This set contained values for animal weight, feed intake, feed refusals and outputs of faecal DM and urine. The time series nature of both data sets was taken into account by an ANOVA of repeated measures (Rowell and Walters, Reference Rowell and Walters1976) via the AREPMEASURES procedure of GenStat (2008). This forms an approximate split-plot ANOVA (split for time). The Greenhouse–Geisser epsilon was used to estimate the degree of temporal auto correlation, and the probability levels were adjusted accordingly.
Improved experimental power for evaluating total collection of urine Ca excretion was gained by pooling treatments DCAD 150 + D, DCAD 50 + D, DCAD 50 and DCAD 150 for 25(OH)D supplementation. A post hoc t-test was performed on the means of urine Ca excretion for the new treatments 25(OH)D and Control.
A comparison of the techniques used for estimating urinary Ca excretion utilised Lin's (Reference Lin1989) concordance correlation coefficient. Variability of urinary Ca excretion measurement for the different techniques was compared by the residual mean square value.
Results
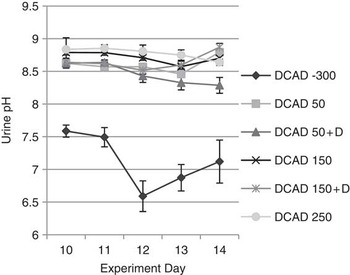
Very alkaline urine pH measurements were recorded in steers fed the diets of DCAD 250, 150 and 50 mEq/kg DM. There were no significant differences in urine pH from steers on these treatments, although the highest urine pH values were recorded from steers fed the diet containing a DCAD of 250 mEq/kg DM. The pH of urine samples from steers fed the treatment containing a DCAD of −300 mEq/kg DM were, however, significantly lower than other treatments (Figure 1).
Influence of variations in the dietary cation–anion differences (DCADs) of a forage diet and 25-hydroxyvitamin D (+D) on the urine pH of steers.

Despite the range in DCAD between treatments, dietary DM intakes were remarkably constant throughout the experiment and between diets (8.0 ± 0.8 kg/day) and this was reflected in similar DM digestibilities between treatments (61 ± 1.5%). No significant differences in the apparent digestibilities of either Ca (37.2 ± 2.7%) or P (47.5 ± 5.8%) because of dietary treatment were recorded. Daily creatinine concentrations in urine were similar in all animals irrespective of the DCAD of the feed (31 ± 3.1 mg/kg).
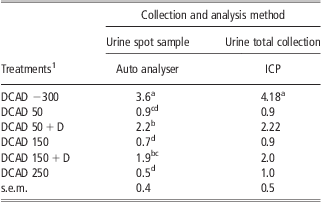
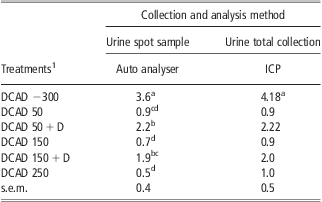
A comparison of mean Ca urine excretions measured from either the spot sampling technique or total urine collections is presented in Table 2. The steers offered the diets containing moderate amounts of anionic salts (treatments containing DCADs of 50 mEq/kg DM and 150 mEq/kg DM) exhibited low Ca outputs in urine and were similar between these treatments and to outputs from steers fed the strongly cationic diet (250 mEq/kg DM). On the other hand, the steers fed the treatment containing a DCAD of −300 mEq/kg DM exhibited a significantly higher urinary Ca excretion (P < 0.05) either by total collection or by the urine spot sampling technique.
Ca excretion (g/day) in urine from steers fed the basal forage diet containing varying DCADs (mEq/kg DM) with or without daily supplementation of 25(OH)D
DCAD = cation–anion differences; 25(OH)D = 25-hydroxyvitamin D; DM = dry matter; ICP = inductively coupled plasma.
Comparison of Ca output in urine determined by total urine collection or spot urine sample using creatinine to determine concentration.
a,b,c,dMeans within a column with different superscripts differ (P < 0.05).
1Treatments: DCAD −300 = DCAD −300 mEq/kg; DCAD 50 = DCAD 50 mEq/kg; DCAD 50 + D = DCAD 50 mEq/kg plus 25(OH)D at 3 mg/day; DCAD 150 = DCAD 150 mEq/kg; DCAD 150 + D = DCAD 150 mEq/kg plus 25(OH)D at 3 mg/day; DCAD 250 = DCAD 250 mEq/kg.
However, the urine spot sampling technique did show a clear and significant increase in urine Ca output from steers when supplemented with 25(OH)D in the diets containing DCADs of 50 or 150 mEq/kg DM. Total urine collection was not significant (P < 0.05) for differences in urinary Ca excretion from steers fed these dietary treatments. However, concordance between urine Ca excretion measured by spot sampling and total collection was excellent (concordance: 0.95, 95% CI 0.87 to 0.98, P < 0.01).
Urinary excretion of P was similar across all treatments and was not influenced by level of DCAD or the presence of 25(OH)D supplements. The average P excretion via urine from steers on all treatments was below 1 g/day. A small increase in urine Mg excretion was recorded in the DCAD −300 treatment; this was expected because of a higher Mg concentration in the diet (Table 1). All other treatments displayed no difference in urinary Mg excretion. Neither the variations in DCAD nor supplementation with 25(OH)D affected the apparent retention of Ca, P or Mg.
Discussion
The diet containing a DCAD of −300 mEq/kg DM resulted in a compensated metabolic acidosis, which was reflected in both significant depressions in urine pH and significant increases in urinary Ca output. The decrease in the urine pH from steers fed the treatment containing a DCAD of −300 mEq/kg DM was not as low as reports from other experiments with a similar DCAD (Tucker et al., Reference Tucker, Hogue, Waterman, Swenson, Xin, Hemken, Jackson, Adams and Spicer1991; Pehrson et al., Reference Pehrson, Svensson, Gruvaeus and Virkki1999; Seifi et al., Reference Seifi, Mohri and Zadeh2004). These experiments involved the use of mature Holstein cows and occasionally heifers, and this may be a potential cause for the difference. However, studies investigating the effect of varying DCAD regimes on growing steers are few and those that have been conducted have utilised high concentrate diets (Luebbe et al., Reference Luebbe, Erickson, Klopfenstein and Meyer2009).
As a consequence of greater Mg concentration in the diet DCAD −300 mEq/kg, there was a potential for confounding results (Table 1). However, the concentration of Mg in all diets was considerably greater than requirements (National Research Council (NRC), 2000), and a difference in dietary Mg intake has been shown previously not to cause a variation in urinary Ca excretion or pH (Waterman et al., Reference Waterman, Swenson, Tucker and Hemken1991). Furthermore, the Mg concentration in the DCAD −300 mEq/kg was not considered to be high enough to cause any negative animal effects (NRC, 2000).
Dietary treatments containing moderate quantities of anionic salts (e.g. DCAD of 50 and 150 mEq/kg DM) did not generate sufficient metabolic acidosis to achieve a concomitant buffering with release of bone Ca, and therefore there was no increase in urine Ca excretion (Beck and Webster, Reference Beck and Webster1976; Takagi and Block, Reference Takagi and Block1991). However, when treatments within this range were supplemented with 25(OH)D, an increase in urinary Ca excretion was shown in spot samples.
It is argued that steers fed these dietary treatments supplemented with 25(OH)D did exhibit increased urinary Ca excretion through increased dietary absorption of Ca. However, only when the results of total urine collection procedures from treatments containing DCAD 50 and 150 mEq/kg DM were combined and compared with those corresponding treatments containing 25(OH)D supplementation, there is a clear significant difference in increased urine Ca excretion (ca. 1.2 g/day). However, an increase in absorption of Ca from the small intestine corresponding to an extra output of ∼1.2 g/day of Ca in urine is insignificant when compared with the large quantities of Ca excreted in faeces (ca. 76 g/day). Consequently, it is difficult to provide supporting evidence for improved absorption of dietary Ca because of the presence of 25(OH)D. It is highly likely that the total urine collection procedures may have resulted in abnormally high content of Ca as a consequence of faecal contamination within the metabolism crates. Cattle faeces have a much greater Ca concentration than urine and any faecal contamination of urine will increase its apparent Ca concentration. Although Breves and Schröder (Reference Breves and Schröder1991) reported increased absorption of P because of supplementation with vitamin D, this was not evident in our study as the apparent digestibility of P is confounded by P recycling through saliva back into the rumen digesta (Scott and Beastall, Reference Scott and Beastall1978; Mañas-Almendros et al., Reference Mañas-Almendros, Ross and Care1982).
The current study, however, does show that if an accurate assessment of daily creatinine excretion is available the technique of uncontaminated spot sampling of urine for the calculation of daily Ca excretion is accurate. Spot sampling also has the added benefits of reducing stress in animals and the need for spending prolonged periods in metabolism cages, which enables the technique to be useful for long-term feeding studies.
Conclusion
Although Ca homeostatic mechanisms appear to be activated by strongly anionic diets (DCAD −300 mEq/kg DM), this study revealed that the daily addition of 3 mg of 25(OH)D in animals fed moderate DCAD regimes (50 and 150 mEq/kg DM) resulted in an increase in urinary Ca excretion. It is suggested that supplementation with 25(OH)D initiates active Ca absorption from the small intestine independent of endogenous hormonal controls. Thus, a combination of strongly anionic diets plus supplements of 25(OH)D could improve the ability of animals to cope with rapid Ca demand. Future research is focused on the evaluation of the homeostatic mechanisms to explain the increases in Ca turnover because of the additive effect of 25(OH)D and anionic salts in dairy cows.
Acknowledgements
This work was supported by DSM Nutritional Products Australia Pty Ltd, Kenmore, Queensland, Australia. We acknowledge the staff in the animal house and laboratories at the University of New England, notably Les Anderson, Jennie Hegarty, Neil Baillie, Leanne Lisle and Kate Metcalfe for their support. We also acknowledge that the co-author Dr Robert Elliott has a conflict of interest as he is employed by the funding company DSM nutritional products Australia.