1. Introduction
Biologically controlled minerals form part of innumerable organisms (both unicellular and multicellular). These biominerals (sensu Marin et al. Reference Marin, Le Roy, Marie, Ramos-Silva, Bundeleva, Guichard and Immel2014), composed of a mixture between inorganic and organic phases, form the shells and skeletons of terrestrial and aquatic organisms which have specific biological functions (support, protection from predators, defence against chemical agents, feeding, senses, etc.) and structures (teeth, bones, shells, plates, spines, otoliths . . .). These frames are composed of biominerals which are notable for their specific crystallochemical properties (Mann, Reference Mann2001) such as: ‘uniform particle sizes, well defined structures and compositions, high levels of spatial organization, complex morphologies, controlled aggregation and texture, preferential crystallographic orientation and higher-order assembly (known as self-assembly) into hierarchical structures’. Biominerals are present in the marine realm in different forms and compositions, calcium carbonate (CaCO3) being one of the most representative. Aragonite, calcite and vaterite are ubiquitous minerals in shells, skeletons or skeletal elements of marine organisms (such as molluscs, corals, brachiopods, algae, coccoliths, ascidians . . .), and each group of organisms (Stolarski, Reference Stolarski2000; Mann, Reference Mann2001; Cusack et al. Reference Cusack, Dauphin, Chung, Pérez-Huerta and Cuif2008; Taylor, Kudryavtsev & Schopf, Reference Taylor, Kudryavtsev and Schopf2008; Berman, Reference Berman, Sigel, Sigel and Sigel2010; Frýda et al. Reference Frýda, Klicnarova, Frydova and Mergl2010) has different crystal shapes, sizes and distributions (microstructure sensu Checa et al. Reference Checa, Mutvei, Osuna-Mascaró, Bonarski, Faryna, Berent, Pina, Rousseau and Macías-Sánchez2013). All these properties and characteristics are controlled by the organic phases (e.g. macromolecular framework, Lowenstam & Weiner, Reference Lowenstam and Weiner1989; Mann, Reference Mann2001; Cuif, Dauphin & Sorauf, Reference Cuif, Dauphin and Sorauf2011) secreted by the mineralizer cells, which play an important role in biomineralization (e.g. in molluscs and corals; Cuif, Dauphin & Gautret, Reference Cuif, Dauphin and Gautret1999; Dauphin et al. Reference Dauphin2002). Biomineralization processes are regulated by a gene pool (sensu Mann, Reference Mann2001), which is conditioned by bioenergetic processes (metabolic) and adapted to environmental influences (phenotype). The main controlling mechanisms sensu Mann (Reference Mann2001) are chemical (ion transport, saturation), spatial (confining processes of supramolecular organization), structural (preferential nucleation), morphological (morphogenesis) and constructional (higher-order structures).
The distinctive properties of biominerals may be detected and analysed in the fossil record where diagenetic processes have not obliterated the original attributes. Biomineralization studies in fossils can help our understanding of the evolution of metazoans through the Phanerozoic. Biominerals offer chemical information about the environmental conditions where they were precipitated (via geochemical proxies), but they also offer a single unique position to understand the growth processes that provide organisms with an evolutionary advantage to colonize different habitats (e.g. growth patterns, Barbin, Ramseyer & Elfman, Reference Barbin, Ramseyer and Elfman2008; changes in mineralogy, Stolarski et al. Reference Stolarski, Meibom, Przenioslo and Mazur2007; Balthasar et al. Reference Balthasar, Cusack, Faryma, Chung, Holmer, Jin, Percival and Popov2011; formation of structural elements, Pérez-Huerta, Cusack & England, Reference Pérez-Huerta, Cusack and England2007; Frýda et al. Reference Frýda, Klicnarova, Frydova and Mergl2010).
Biomineralization studies on Palaeozoic corals have been historically focused on the analysis of microstructures from a taxonomic point of view (Wang, Reference Wang1950; Brood, Reference Brood1978; Semenoff-Tian-Chansky, Reference Semenoff-Tian-Chansky1984; Sorauf, Reference Sorauf1984; Rodríguez, Reference Rodríguez1989) or from their preservation state. This latter point has been the subject of controversy for more than 70 years (see Coronado, Pérez-Huerta & Rodríguez, Reference Coronado, Pérez-Huerta and Rodríguez2013 and Rodríguez, Reference Rodríguez1989 for a review). New advances in the biomineralization of Palaeozoic corals have been focused on the biogenic origin of skeletons of Carboniferous Syringoporicae (de Fromentel, Reference de Fromentel1861) (Coronado, Pérez-Huerta & Rodríguez, Reference Coronado, Pérez-Huerta and Rodríguez2013, Reference Coronado, Pérez-Huerta and Rodríguez2015a ,Reference Coronado, Pérez-Huerta and Rodríguez b ). A complete assessment of the biogenic origin of microstructures was done by Coronado, Pérez-Huerta & Rodríguez (Reference Coronado, Pérez-Huerta and Rodríguez2013) via the use of a combination of techniques (petrographic microscopy; scanning electron microscopy (SEM); atomic force microscopy (AFM); electron backscatter diffraction (EBSD); cathodoluminescence (CL); electron microprobe analysis (EMPA)), which allowed us to observe the main properties of the microstructures of Multithecopora hontoriense. The study revealed that the skeletons are formed of hierarchical structures from the nanoscale to the macroscale. Coronado, Pérez-Huerta & Rodríguez (Reference Coronado, Pérez-Huerta and Rodríguez2015b ) studied by EBSD the preferred crystallographic orientations in different microstructural elements, the processes of growth of the skeletons and the development of wall elements in seven taxa of Syringoporicae.
In a subsequent study of Sinopora skeletons, computer-integrated polarization microscopy (CIP) was applied for the first time to the study of the crystallographic arrangement of biominerals. The study was focused on the detection of diagenetic modifications in combination with SEM, AFM and CL (Coronado, Pérez-Huerta & Rodríguez, Reference Coronado, Pérez-Huerta and Rodríguez2015a ).
These studies have shown the biogenic origin of the microstructures of Syringoporicae corals, shedding light on growth processes, the assembly mechanisms and those abiogenic characteristics specific to diagenetic alteration of these microstructures.
1.a. Structure of the colony of Palaeozoic corals
Palaeozoic corals were solitary and colonial cnidarians that inhabited Palaeozoic seas from Early Ordovician to Permian times. Within this informal group the most abundant orders in the fossil record are the Tabulata and the Rugosa. Scrutton (Reference Scrutton1998) differentiated between growth-form and the internal structural organization of the colony, which forms the complete compound skeleton (Hill, Reference Hill and Teichert C1981). The external appearance of the colony is the growth-form (fasciculate, cateniform, retiform, umbelliferous, massive, ramose and foliose sensu Scrutton, Reference Scrutton1998). The internal structural organization indicates the interrelationships of modules (corallites) within the colony (dendroid, phaceloid, cerioid, amural or plocoid and coenenchymal sensu Scrutton, Reference Scrutton1998). This variety of forms, and in some cases, the integration of some of them in the same colony, suggests a great plasticity in the Palaeozoic coral skeletons, making it very difficult to determine the level of colonial integration and generating a high intraspecific variation in corals. This intraspecific variation may have been controlled by a genotypic or a phenotypic response and even, in some cases, by an ecophenotypic response. Scrutton (Reference Scrutton1998) described six kinds of variations (ontogenetic, astogenetic, cyclomorphic, topomorphic, disturbance and pathological), thus making it very difficult to differentiate through the study of skeletons.
The Syringoporicae include fasciculate, massive and cateniform colonies with a variable internal structural organization, being most commonly phaceloid and dendroid and less commonly cerioid or pseudocerioid (Tchudinova, Reference Tchudinova1986; Poty, Reference Poty2010; Coronado, Pérez-Huerta & Rodríguez, Reference Coronado, Pérez-Huerta and Rodríguez2015b ). Taxa with intraspecific variation are common in this superfamily, e.g. cerioid–phaceloid (Duncanopora, Tchudinova, Reference Tchudinova1986; Roemeria, Lafuste & Tourneur, Reference Lafuste and Tourneur1988a and Tourneur & Lafuste, Reference Tourneur and Lafuste1991; Neomultithecopora, Coronado & Rodríguez, Reference Coronado and Rodríguez2014).
An evolutionary study of Syringoporicae (Tchudinova, Reference Tchudinova1986) revealed that although the first appearance of the group is in the Middle Ordovician with Syringoporinus, a cateniform to cerioid colony with cylindrical-prismatic corallites, the trend during the evolution of Syringoporicae is towards forming phaceloid colonies having cylindrical corallites (Tchudinova, Reference Tchudinova1980). Thus, intraspecific variations in the internal structure of the colony and the growth-form (cerioid to phaceloid, massive to fasciculate) are diverse and depend on the taxon.
Tchudinova (Reference Tchudinova1986) remarked that the final growth-form of Syringoporicae is strongly influenced by the genetic strategy and the environment. Examples of this process can be found in some colonies of Multithecopora hontoriense, which change their colony morphology during environmental fluctuations, varying the corallite spacing, packing them together, but maintaining the phaceloid structure with cylindrical or irregular corallites (Coronado & Rodríguez, Reference Coronado and Rodríguez2014). In contrast, Roemeria (Lafuste & Tourneur, Reference Lafuste and Tourneur1988a ) and Neomultithecopora (Coronado & Rodríguez, Reference Coronado and Rodríguez2014) change their internal structural organization from phaceloid to cerioid or pseudocerioid, with prismatic corallites. This suggests that morphological intraspecific variation could be exerted by environmental conditions, but in the case of variations in the internal structural organization, should be controlled by genetics.
Coronado, Pérez-Huerta & Rodríguez (Reference Coronado, Pérez-Huerta and Rodríguez2015b ) observed that the crystallographic arrangement of cerioid Syringoporicae (Roemeripora) is different to phaceloid taxa (i.e. Multithecopora, Syringopora and Sinopora), although they share crystallographic properties. In this way, biomineralization studies may help to recognize some characteristics that can only be controlled by genetic code. As mentioned above, the controlled biominerals are an expression of the cellular mineralizer tissues, so the crystallochemical properties of the biominerals are controlled by genotype, and those variations in the growth-form or internal structural organization, due to environmental fluctuations, should be regulated by the genetic code because they vary in each taxon.
This study presents a detailed structural and crystallographic analysis of six taxa belonging to four genera of Devonian and Carboniferous Syringoporicae that are phaceloid with shared walls (Pleurosiphonella, Fig. 1), cerioid (Roemeria and Roemeripora, Figs 1, 2) and pseudocerioid (Neomultithecopora, Fig. 2). The purpose of this work is to disclose the similarities and differences in the growth processes at the biomineral scale between cerioid and phaceloid taxa and finally to study the architectural adaptations derived from environmental fluctuations.
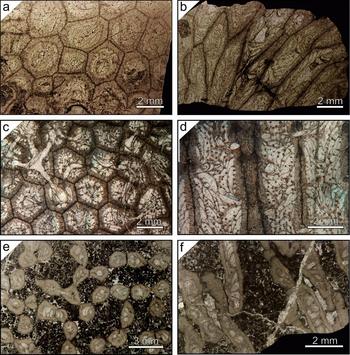
Macroscopic features of the studied colonies in transverse and longitudinal sections. (a, b) Cerioid colony of Roemeria bohemica. (c, d) Cerioid colony of Roemeripora sp. (e, f) Cateniform colony of Pleurosiphonella sp.

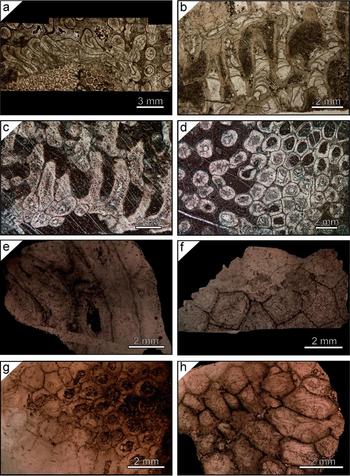
Macroscopic features of the studied colonies. (a, b) Phaceloid–cerioid colony of Neomultithecopora cantabrica from the Hontoria section: (a) transverse section incrusting a chaetetid; (b) longitudinal section of a phaceloid part of the colony. (c, d) Phaceloid–cerioid colony of Neomultithecopora cantabrica from the Prioro section: (c) longitudinal section; (d) transverse section. (e, f) Cerioid colony of Roemeria infundibulifera: (e) longitudinal section; (f) transverse section. (g, h) Cerioid colony of Roemeria cubiniensis: (g) transverse section; (h) longitudinal section.

2. Material
The Devonian material studied in this research is part of the Lafuste collection of the Muséum National d’Histoire Naturelle (MNHN), Paris (France): (1) Roemeria bohemica Počta, Reference Počta and Barrande1902 (Fig. 1a, b), Pragian in age (A47624) (Tourneur & Lafuste, Reference Tourneur and Lafuste1991); (2) Roemeria cubinensis Lafuste & Tourneur, Reference Lafuste and Tourneur1988a (Fig. 2g, h), Eifelian in age (A47625); and (3) Roemeria infundibulifera (Goldfuss, Reference Goldfuss1829) (Fig. 2e, f), Givetian in age (A47626) (Lafuste & Tourneur, Reference Lafuste and Tourneur1988a ).
The Carboniferous material comes almost entirely from the collection of the Universidad Complutense of Madrid (Spain) and it consists of two taxa: (1) Roemeripora sp. (Fig. 1c, d) from the Fuenteobejuna section, upper Viséan (Coronado & Rodríguez, Reference Coronado and Rodríguez2014); and (2) Neomultithecopora cantabrica Rodríguez & Ramírez, Reference Rodríguez and Ramírez1987 from the Prioro (PR) (Fig. 2c, d) and Playa de la Huelga (Hontoria) sections (HO) (Fig. 2a, b), upper Moscovian in age (Coronado & Rodríguez, Reference Coronado and Rodríguez2014). Additionally, some cateniform samples of Pleurosiphonella Tchudinova, Reference Tchudinova, Astrova and Tchudinova1970, being phaceloid with shared walls (Fig. 1e, f), from the Lafuste collection of the Muséum National d’Histoire Naturelle (MNHN), Paris (France), have been studied (A47627). These samples were collected in 1979 by Dr G. A. Gill in the Viséan of Czatkowice (Poland) and the taxonomical characterization (Pleurosiphonella sp.) was done by Dr J. Lafuste.
3. Methods
For the purpose of checking the structural and crystallographic properties of each skeleton, a combination of different techniques was applied, including petrographic microscopy, scanning electron microscopy (SEM), atomic force microscopy (AFM) and computer-integrated polarization microscopy (CIP). The structural level has been studied at two different scales: at the nanoscale (AFM) and at the microscale (SEM and petrographic microscopy), although only four taxa from five localities (Roemeria bohemica, Roemeripora sp., Neomultithecopora cantabrica (PR and HO) and Pleurosiphonella sp.) have been studied under AFM because some samples from the MNHN as rocks slabs were unavailable or the thin-sections were covered with resin. Microscale structures have been studied with petrographic microscopy and ultrathin-sections (UTS) of all taxa, but only in Roemeripora sp. has SEM been used to study the inner structure of the microcrystals. CIP was used for recognizing the crystallographic arrangement of the skeletons of all taxa.
3.a. Structural characteristics
Petrographic microscopy, SEM and AFM were used for visualization and characterization of the microstructures and nanotextures of selected taxa. UTS were prepared for Roemeripora sp. and Neomultithecopora cantabrica with the method developed by Lafuste (Reference Lafuste1970), to correct the visualization of microcrystals under petrographic microscopy. Longitudinal and transverse sections of Roemeripora sp. were broken by means of natural breakage. Details of the methods and equipment used can be found in Coronado, Pérez-Huerta & Rodríguez (Reference Coronado, Pérez-Huerta and Rodríguez2013, Reference Coronado, Pérez-Huerta and Rodríguez2015a ). Treatment of images was done with WSxM v5.0 Develop 5.0 software by Nanotec (Horcas et al. Reference Horcas, Fernández, Gómez-Rodríguez, Colchero, Gómez-Herrero and Baro2007).
3.b. Crystallographic characteristics
UTS (transverse and longitudinal) of all taxa were used for CIP analysis, independently of the preparation method of the UTS (covered or uncovered). The CIP method has been described by Heilbronner & Pauli (Reference Heilbronner and Pauli1993), Heilbronner (Reference Heilbronner2000) and Heilbronner & Barret (Reference Heilbronner and Barret2014) as a method for texture analysis and optical orientation imaging. It determines the c-axis orientations of uniaxial minerals from optical micrographs and displays the results in the form of pole figures and orientation images, using a colour-code (CLUT) that represents each orientation. This method has been applied to biomineralization studies of fossil specimens with relevant results (Coronado, Pérez-Huerta & Rodríguez, Reference Coronado, Pérez-Huerta and Rodríguez2015a ). Details of the methods and equipment used can be found in Coronado, Pérez-Huerta & Rodríguez (Reference Coronado, Pérez-Huerta and Rodríguez2015a ). The petrographic micrograph and the CIP analyses were done with Image SXM software (Barret, Reference Barret1997).
4. Results
4.a. Structure at the microscale of the skeletons
The taxa selected have different growth-forms and internal structural organizations. Roemeria bohemica (Fig. 1a, b), R. cubiniensis (Fig. 2g, h), R. infundibulifera (Fig. 2e, f) and Roemeripora sp. (Fig. 1c, d) show massive cerioid colonies, with prismatic corallites (four–six sides) and a dome-shaped colony. In the cases of R. cubiniensis and R. infundibulifera some colonies show an alternating internal structural organization between cerioid–pseudoceriod–phaceloid in some points of the colony (cylindrical corallites), such as the peripheral areas (Lafuste & Tourneur, Reference Lafuste and Tourneur1988 a), although only the cerioid areas have been studied in these samples. Tourneur & Lafuste (Reference Tourneur and Lafuste1991) described the same habit in some colonies of R. bohemica. On the other hand, Neomultithecopora cantabrica (Fig. 2a–d) shows a variable internal structural organization depending on the position in the colony. The beginning of growth was phaceloid and prostrate, attached to hard substrates such as chaetetids (cylindrical corallites, Fig. 2a, d); secondarily, the corallite growth was erect via lateral increase over the initial stage (Fig. 2b, d). During growth the corallites were aggregated into a massive colony passing from a phaceloid internal structure to cerioid (prismatic corallites), mainly in the wave zone of the colony (Fig. 2c, d). The shadow-zone and some peripheral areas continued growing with phaceloid development. Ultimately, Pleurosiphonella sp. shows a phaceloid internal structure with halysitid-type corallites, an oval section and a cateniform-shaped colony (Fig. 1e, f).
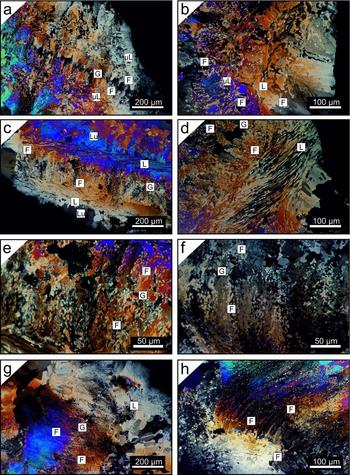
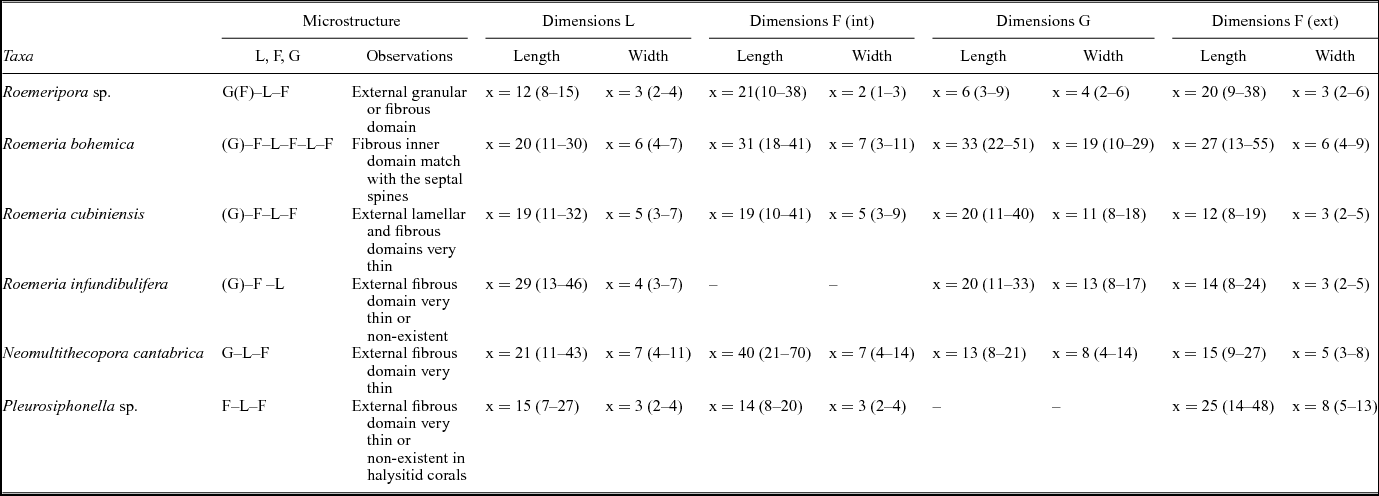
The microstructure of the skeletons of Syringoporicae is composed of a framework of concentric alternating domains of calcite crystals (Figs 3, 4), whose main morphologies are lamellae, fibres and granules. These three microstructural elements have been identified in studied taxa. Details of the domains which make up the skeleton, their position and the dimensions of each microstructural element in each taxon have been summarized in Table 1.
Microscopic features of studied taxa. L – lamellae; μL – microlamellae; F – fibres; G – granules. (a, b) Transverse and longitudinal sections of Roemeria bohemica. (c, d) Longitudinal sections of Roemeria infundibulifera. (e) Detail of contact of fibrous domain and hyaline elements in a transverse section of R. infundibulifera. (f) Detail of contact of fibrous domain and hyaline elements in a transverse section of Roemeria cubiniensis. (g, h) Two transverse sections of Roemeria cubiniensis. Note the great development of the external fibrous domain in (h).

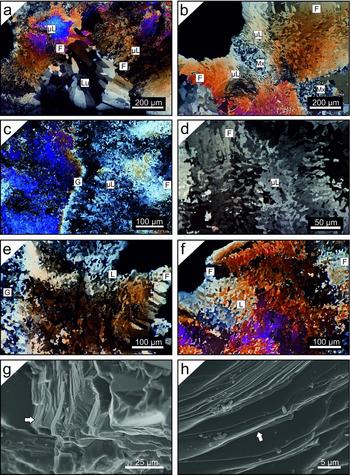
Microscopic features of studied taxa. L – lamellae; μL – microlamellae; F – fibres; G – granules; Lu – lumen; Mx – matrix. (a, b) Transverse sections of halysitid corallites of Pleurosiphonella sp. Note the accumulation of matrix over a connecting tubule in (b). (c, d) Transverse sections of Roemeripora sp. Note the wavy path of a granular median lamina in (c) and the development of fibres in the median lamina in (d). (e, f) Transverse sections of Neomultithecopora cantabrica in the Hontoria section. Cerioid organization in (e) and phaceloid in (f). (g, h) SEM detail of lamellar domain in natural breakage. Note the intralamination smaller than 1 μm that forms the crystal (white arrows).

Dimensions of microstructural elements of Syringoporicae from this study in microns

L – lamellae; F – fibres; G – granules; ext – external; int – internal.
4.a.1. Lamellae
Lamellae, > 25 μm in size, and microlamellae, < 25 μm in size (Rodríguez, Reference Rodríguez1989), are single crystals, straight to wavy, with indentations at their edges and a flake shape. The morphologies are variable and depend on their position in the skeleton (i.e. the contact with other microstructural elements) and the taxon. They can be ‘scutellate’ or shield-shaped (Lafuste & Plusquellec, Reference Lafuste and Plusquellec1985); cupolar-shaped; ‘tenailles’ or pliers-shaped (Lafuste, Reference Lafuste1983); ‘lunular’ or moon-shaped (Lafuste, Reference Lafuste1978); and geniculate-shaped (Lafuste, Reference Lafuste1981). In this article we will not make these distinctions in morphology, considering them as only lamellae and microlamellae, but some examples of these morphologies can be found in Figures 3 and 4. These elements are completely imbricated with each other forming a compact framework (Figs 3, 4). The morphological axis is oriented perpendicular to the lumen and the concave part of the lamellae always points to the lumen, showing a concentric aspect of the lamellar domains (Figs 3, 4). These elements have a great lateral development in two dimensions; their length varies from 7 to 46 μm, and their width fluctuates from 2 to 11 μm depending on the taxon (Table 1). Most skeletons of the taxa studied here have microlamellae except Roemeria infundibulifera, Roemeria cubiniensis, the lamellar external domain of Roemeria bohemica and Neomultithecopora cantabrica. Natural breakage of the corallites of Roemeripora sp. shows that the lamellae are composed of submicrometric intralamination almost parallel to the morphological axis of the lamella independent of their wavy surface or lateral wedging (Fig. 4g, h).
4.a.2. Fibres
Fibres are elongate crystals with an irregular morphology, indentations in their edges and an apex or tip at the end and sometimes at the base. Similar to lamellae, the morphology is variable: strip-shaped or palisade, barrel-shaped, irregular elongate-shaped and tabular-shaped, depending on their position in the skeleton. The morphological axis is oriented towards the lumen, parallel to the direction of growth. Irregular elongate-shaped fibres appear in the holacanth septal spines of Roemeripora sp. and Roemeria bohemica. Their length varies from 8 to 70 μm, and their width fluctuates from 1 to 14 μm depending on the taxon (Table 1) and morphology.
4.a.3. Granules
‘Granules’ are single crystals with indentations to their edges and a round flake shape. They have irregular sizes with lengths from 3 to 51 μm, and their width fluctuates from 2 to 29 μm. Two kinds of granules can be recognized in the studied taxa: short, irregular, equidimensional forms with a low variability in size (Roemeripora sp. and Neomultithecopora cantabrica), known as granules (sensu Lafuste & Plusquellec, Reference Lafuste and Plusquellec1986), and a second kind of large granules that are asymmetric with a high variability in size and morphology (Roemeria bohemica, R. infundibulifera and R. cubiniensis), known as hyaline elements (sensu Lafuste & Tourneur, Reference Lafuste and Tourneur1990). This latter element has been described as elongated granules (Lafuste & Plusquellec, Reference Lafuste and Plusquellec1986), hyaline stellate-shaped (Lafuste & Tourneur, Reference Lafuste and Tourneur1988a ), platelets (Lafuste & Tourneur, Reference Lafuste and Tourneur1988b ), long hyaline elements (Lafuste & Tourneur, Reference Lafuste and Tourneur1990), sticks (‘baguette’, Lafuste & Tourneur, Reference Lafuste and Tourneur1991) and ribs (Lafuste, Fernández-Martínez & Tourneur, Reference Lafuste, Fernández-Martínez and Tourneur1992). Hyaline elements have characteristic irregular sub-rounded morphologies in all Roemeria taxa as well as hyaline stellate-shaped crystals in R. cubiniensis and ‘baguettes’ and hyaline stellate-shaped crystals in R. bohemica. It should be taken into account that some of these asymmetric crystals contain opaque impurities. Both ‘granules’ (equidimensional granules and hyaline elements) are situated in the median lamina. The median lamina is a black ‘line’ under transmitted light microscopy first described by Nicholson (Reference Nicholson1879), and it has been interpreted as an irregular (even dashed) crystal domain of secretion of polyps between two edges of skeletons (Plusquellec, Reference Plusquellec and Lardeux1976; Plusquellec & Tchudinova, Reference Plusquellec and Tchudinova1977). This lamina has been described in the middle of septa and shared walls in colonial forms of rugose and tabulate corals. Their dark appearance is related to the distribution and size of granules and their degree of imbrication. This does not allow light transmission and details can only be observed using UTS with petrographic microscopy or SEM.
4.a.4. Transition between fibrous and lamellar domains
There is a gradual change between the fibrous and lamellar domains, with the modification of the regular shapes (shield-shaped lamellae and elongated fibres) via intermediate shapes, as was described above (cupolar-shaped; pliers-shaped), independent of the internal structure of the colony. This gradual transition between the microcrystals can be observed also between the granules and lamellae in Roemeripora sp. or Neomultithecopora cantabrica, but it cannot be seen in the transition to lamellae or fibres and hyaline elements (e.g. Roemeria bohemica, R. infundibulifera or R. cubiniensis). The median lamina formed by hyaline elements lacks continuity, with a disrupted or dashed development versus the wavy path of the granular median lamina in Roemeripora and Neomultithecopora. The granular median lamina of Roemeripora sp. changes during the growth of the corallites and their widening. The granular domain changes to an external fibrous domain. This process is known as ‘fibrization’ of the median lamina (Lafuste, Fernández-Martínez & Tourneur, Reference Lafuste, Fernández-Martínez and Tourneur1992) in other massive tabulate corals. A similar process can be observed in R. cubiniensis (Fig. 3h) where the widening process of the corallites allows the development of a fibrous domain with elongated fibres in the place of the median lamina.
Pleurosiphonella sp. skeletons show a halysitid morphology (sometimes oval) of the corallites in their growth of a cateniform colony. During lateral increase (Fig. 1e) the corallites grew straight over the substrate and sometimes they shared the wall at those points where the connecting structures (connecting tubules, Fig. 1e) are formed, changing from cylindrical to oval corallites. This process of growth generated a shared-wall structure between two corallites in which the microstructure was flattened and their path was conditioned to the morphology of the connecting structure as if the polyps were stretched during the secretion of the skeleton. The morphological axis of the microcrystals in the symmetric plane along the connecting structure is abruptly turned and the transition between two corallites is a net-like contact.
4.b. Structure at the nanoscale of skeletons
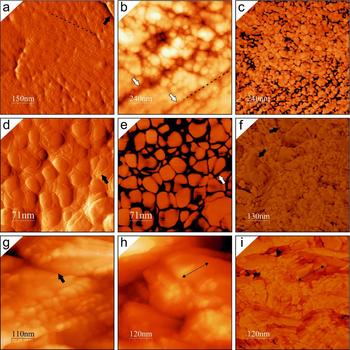
The microcrystals of Syringoporicae studied with AFM (Roemeripora sp., Roemeria bohemica, Pleurosiphonella and Neomultithecopora cantabrica) reveal a complex nanostructure composed of co-oriented rounded nanocrystals with different sizes and morphologies, which depend on the taxon.
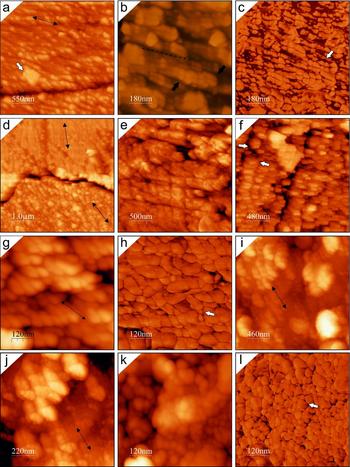
Roemeripora sp. microcrystals (lamellae and fibres) are composed of an aggregate of nanogranules with variable sizes, 30–116 nm (x = 62 nm) in length and 22–97 nm (x = 44 nm) in width. They are disposed to form nanolaminae ~ 50 nm thick and they in turn form submicrometric structures (intralamination) of ~ 300 nm. Both nanocrystals and nanolaminae are surrounded by dark-coloured envelopes, as the phase images show (Fig. 5a, c–e). These envelopes are easily observable in amplitude images (Fig. 5a, d) because they produce a positive relief around the nanocrystals, considering that the amplitude images are the measure of deflection of the tip with the topography of the sample providing information about the shape and slope of the sample. Each granule is surrounded by a thin envelope 3–16 nm in thickness, depending on their positions in the microcrystals. This intralamination corresponds with the submicrometric intralamination observed by SEM in the microcrystals (Fig. 4g, h). Roemeria bohemica has a nanotexture that shows an aggregate of irregular, co-oriented, pill-shaped nanogranules (Fig. 5h, i), which show variable sizes from 17–72 nm (x = 38 nm) in length to 13–45 nm (x = 25 nm) in width. They are similar to those described by Coronado et al. (submitted) for Syringopora but these have a smaller size. The nanogranules show a thin dark envelope (Fig. 5i), less marked than in Roemeripora sp. and 3–5 nm in thickness. Some areas of microcrystals have evidence of nanogranule fusion, forming larger units (Fig. 5f, black arrows). On those edges between co-oriented microcrystals, points or surfaces of contact can be observed (Fig. 5g, black arrow) with the nanounits co-oriented. Pleurosiphonella sp. microcrystals are composed of aggregates of subquadrangular nanogranules with sub-rounded corners (Fig. 6b, c) of variable sizes, 28–93 nm (x = 52 nm) in length and 27–52 nm (x = 35 nm) in width, which are arranged in nanolaminae, similar to Roemeripora sp. These nanolaminae are stacked forming larger units of submicrometric intralamination (Fig. 6b), similar to those described in Roemeripora sp. Taking into account that the etching has been the same in the entire sample, the differential etching produced at the contact of the microcrystals should be highlighted (Fig. 6a, d). At those contacts between co-oriented microcrystals, the etching has not been completed between them, showing some points with co-oriented nanocrystals in contact (Fig. 6a). On the other hand, those misoriented microcrystals have a deeper etching in the contact between crystals (Fig. 6d), without contact points. The nanolamination allows observing clearly the misorientation between microcrystals. Figure 6d shows a contact between two lamellae and a misorientation of ~ 30° can be observed (double arrowed lines). The nanogranules show a dark envelope of 5.5–23 nm thickness (Fig. 6c), and they have a higher thickness in the contact between nanolaminae (Fig. 6c, white arrow), as occurs in Roemeripora sp. As a last example, the structure of the microcrystals in Neomultithecopora cantabrica has been studied in samples from different localities with a similar age. The structure at the nanoscale of N. cantabrica is characterized by an aggregation of irregular elongated nanogranules (ellipsoidal-shaped) (Fig. 6g, k), arranged in nanolaminae (Fig. 6f, i, j) with their morphological axis oblique to the plane of accretion (Fig. 6g). The inner structure of these nanolaminae are composed of a stack of nanogranules and in turn the nanolaminae are stacked composing higher structures, similar to submicrometric intralamination 200–500 nm in thickness, as was emphasized in previous taxa. The sizes are variable and slightly different between the two samples, although this can be interpreted as intraspecific variation. Hontoria samples are 27–93 nm (x = 56 nm) in length and 21–93 nm (x = 43 nm) in width, whereas Prioro samples are 26–98 nm (x = 51 nm) in length and 18–60 nm (x = 35 nm) in width. The elongated nanogranules show a thin dark envelope (Fig. 6h, l) around them 3–7 nm in thickness.
(a–e) AFM images of the nanostructure in Roemeripora sp. (a) Amplitude image in the contact of two lamellae (black arrow). Note the nanolamination (dashed line) and the positive relief around nanocrystals. (b, c) Height and phase images of the nanotexture of a microcrystal. Note the intralamination (white arrows) and the nanolaminae that form the structure (dashed line) in (b). (d, e) Detail at high magnification of the dark envelopes of nanogranules (arrows) in amplitude (d) and phase images (e). (f–i) AFM images of the nanostructure in Roemeria bohemica. (f) Phase image where the sub-granular nanotexture can be observed in a transverse section of a microcrystal and some areas with nanocrystals fused in large units (black arrows). (g) Height image of a contact between two co-oriented microcrystals. (h, i) Height and phase image of nanotexture of a longitudinal section of a microcrystal. Note the stacking of pill-shaped crystals (double black arrow shows the morphological axis of the nanounits).

(a–d) AFM images of Pleurosiphonella sp. (a) Height image in the contact between two co-oriented microcrystals. Double arrowed line points to the direction of co-orientation and white arrow shows an impurity inside the microcrystal. Note the presence of points of contact between nanocrystals. (b, c) Height and phase images of the intralamination (black arrows) of the microcrystals. Note that the intralamination is composed of nanolaminae, in which a different phase can be observed around the nanocrystals (dark envelopes) and is thicker in the base of the nanolaminae. (d) Note the misorientation between two microcrystals (double arrowed lines) and the deep and continuous contact between them, in contrast to that observed in co-oriented microcrystals (a). (e–h) AFM images of Neomultithecopora cantabrica from the Hontoria section. (e, f) Height images showing the nanotexture that forms the microcrystals. Note the intralamination composed of nanolaminations (white arrows) and the elongated granules. (g, h) Height and phase images of a detail of elongated granules and their co-orientation. Note the dark envelope around the nanounits (white arrow). (i–l) AFM images of Neomultithecopora cantabrica from the Prioro section. (i, j) Height images of the nanotexture composed of nanolaminae that form the intralamination. (k, l) Height and phase images of a detail of the nanotexture showing the dark envelopes around the nanounits.

4.c. Crystallographic arrangement of skeletons
CIP has been used in all studied taxa with the purpose of identifying the crystallographic arrangement of the skeletons. Ten c-axis orientation images (COI) and their corresponding pole figures were obtained using the CIP method from different shared walls and phaceloid corallites. Some considerations should be taken into account before beginning the description of the studied taxa. The diagenetic alteration can be mapped with crystallographic methods (including CIP) in polycrystalline skeletons, as has been shown by some authors (Pérez-Huerta, Cusack & England, Reference Pérez-Huerta, Cusack and England2007; Pérez-Huerta, Cusack & Méndez, Reference Pérez-Huerta, Cusack and Méndez2012; Coronado, Pérez-Huerta & Rodríguez, Reference Coronado, Pérez-Huerta and Rodríguez2013, Reference Coronado, Pérez-Huerta and Rodríguez2015a ,Reference Coronado, Pérez-Huerta and Rodríguez b ; Moreno-Azanza et al. Reference Moreno-Azanza, Mariani, Bauluz and Canudo2013). Well-structured frameworks produced by controlled biomineralization, such as skeletons and shells, show a great crystallographic control. During diagenetic alteration, the crystallographic axis loses the original properties (azimuth and/or inclination) and the new crystals (in frameworks), formed by processes of dissolution/precipitation, usually show a random orientation pattern. Black dots and black areas in orientation images correspond to those areas with artefacts derived from scratches or dust in the UTS, which have been removed from the analysis.
4.c.1. Roemeripora sp.
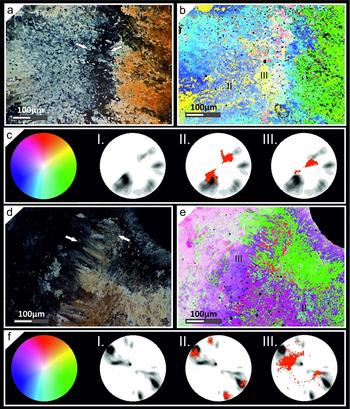
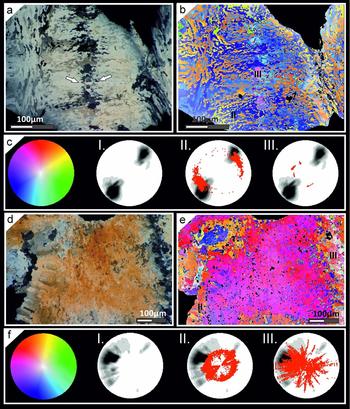
Roemeripora sp. has been studied in a slightly oblique transverse section (Fig. 7a–c) and a transverse section of a thickened corallite from a more calicular region (Fig. 7d–f). The oblique region in the contact between two corallites is separated by a wavy granular median lamina ~ 55 μm in thickness (Fig. 7a). In the petrographic micrograph and orientation image three main areas can be identified (two lamellar domains and a median lamina), which show different orientations of the c-axis. An irregular mixture of microlamellae (e.g. geniculated, cupolar) is present in the sclerenchyma in both walls, which appear to be arranged in rows (Fig. 7a, b) in regards to the fibres. As in the transverse section, the c-axis is oriented perpendicular to their morphological axis. The c-axis in the lamellae of the oblique section has an inclination of ~ 60–65° (Fig. 7c) in both walls, whereas the inclination of the c-axis of granules of the median lamina is ~ 75–90° (Fig. 7c). The c-axis inclination in the left wall is ~ 30° near to the lumen. The azimuth of the c-axis of both walls is misoriented by ~ 60°. The orientations (azimuth) of the granular zone are composed of a mixture of orientations (azimuth) belonging to both walls, which is revealed by the blue-yellow and green colouration of the orientation image. The petrographic micrograph of the transverse section (Fig. 7d) shows two microlamellar walls separated by a fibrous median lamina of ~ 75 μm thickness. The fibres have an orientation of the c-axis parallel to the morphological axis of the crystals. The fibrous median lamina forms small fascicles of fibres, some with large morphologies, as in the middle region of the image, and others with shorter irregular elongated morphologies in the upper region of the image. Three main areas, as in the previous example, can be recognized in the orientation images (two microlamellar sclerenchyma and the median lamina) (Fig. 7e). The two microlamellar walls are completely co-oriented in the azimuth of the c-axis, but they are misoriented in their inclination by ~ 40° (Fig. 7f), depending on the distance to the median lamina. The left wall shows an inclination of their c-axis of ~ 75–85°, whereas the right wall has an inclination of ~ 50–60° in the areas close to the median lamina and ~ 35–40° in the areas close to the lumen. Moreover, the median lamina has two kinds of orientations. The fibres close to the left side have an inclination of ~ 70–75° and gradually change to ~ 30–40° in the centre of the median lamina. The right lamellar sclerenchyma shows two maximal orientations (azimuth) of the c-axis, misoriented to each other by ~ 40° (Fig. 7f). This variation may be interpreted as rotation around the corallite side and it can be observed in the micrograph (Fig. 7d).
(a–c) CIP analysis of an oblique transverse section of Roemeripora sp. in the area between two shared walls with a granular median lamina. (a) Petrographic micrograph of the investigated area. White arrows point to lamina media. (b) Orientation image of the studied area. (c) Standard colour look-up table (CLUT). I: Pole figure of the entire investigated area. II–III: pole figures of some areas studied in detail and superimposed on the whole pole figure (lamellar domain and median lamina, respectively). (d–f) CIP analysis of a transverse section of Roemeripora sp. in the area between two shared walls with a fibrous median lamina. (d) Petrographic micrograph of the investigated area. White arrows point to lamina media. (e) Orientation image of the studied area. (f) Standard colour look-up table (CLUT). I: Pole figure of the entire investigated area calculated. II–III: Pole figures of some areas studied in detail and superimposed on the whole pole figure (lamellar domain and fibrous median lamina, respectively). Black regions in orientation images belong to the thick region of contact between the crystals and opaque impurities and they were not considered for the c-axis pole figure calculation. Pole figures were calculated as an orientation distribution function and provided in multiples of uniform distribution intervals of 0.5 for c-axis orientations. Red points correspond to the punctual c-axis orientation of each pixel of selected areas. These features have been applied to all CIP analyses.

4.c.2. Roemeria
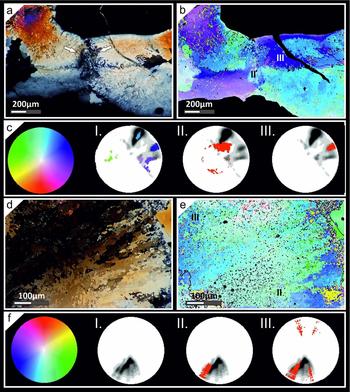
The crystallographic arrangement of Roemeria infundibulifera was studied in a transverse (Fig. 8a–c) and an almost longitudinal section (Fig. S1d–f in the online Supplementary Material available at http://journals.cambridge.org/geo). Petrographic micrographs of the sections of the corallites show that these skeletons are composed of alternating domains of lamellae and fibres separated by a median lamina composed of hyaline elements (Fig. 8a, Fig. S1d in the online Supplementary Material available at http://journals.cambridge.org/geo). Both the fibres and lamellae have a concordant and correlated c-axis orientation (azimuth) between two corallites (parallel and perpendicular to the morphological axis, respectively) (Fig. 8b, e). The lamellar domain in the transverse section shows a broad distribution of the c-axis orientation (azimuth) of ~ 45° due to the rotation of the wall around the corallite (Fig. 8b). The c-axis inclination in the lamellae and fibres near to the median lamina is ~ 30–35° (Fig. 8b, c) regarding their morphological axis, and is similar in the longitudinal section (Fig. S1e, f in the online Supplementary Material available at http://journals.cambridge.org/geo). The lamellar domains near to the lumen show an inclination of ~ 60° (Fig. 8b, c). The hyaline elements of the median lamina are disseminated in the middle of two walls and they do not form a continuous lamina (Fig. 8a, Fig. S1d in the online Supplementary Material available at http://journals.cambridge.org/geo). The representation of the orientations of each crystal has been expressed in a pole figure (Fig. 8c), in which the random orientations of the c-axes of different elements can be appreciated. On the other hand, the left part of the area studied in the longitudinal section shows a different pattern of orientation, which seems to proceed from the lumen of the corallite (Fig. S1e in the online Supplementary Material available at http://journals.cambridge.org/geo). This area shows a random orientation between the microstructural elements, probably due to a diagenetic alteration front from the lumen (Fig. S1f in the online Supplementary Material available at http://journals.cambridge.org/geo).
(a–c) CIP analysis of a transverse section of Roemeria infundibulifera in the area between two shared walls with a median lamina composed of hyaline elements. (a) Petrographic micrograph of the investigated area. White arrows point to lamina media. (b) Orientation image of the studied area. (c) Standard colour look-up table (CLUT). I: Pole figure of the entire investigated area. II–III: Pole figures of some areas studied in detail and superimposed on the whole pole figure (fibrous domain and hyaline elements, respectively). (d–f) CIP analysis of a transverse section of Neomultithecopora cantabrica of phaceloid growth. (d) Petrographic micrograph of the investigated area. (e) Orientation image of the studied area. (f) Standard colour look-up table (CLUT). I: Pole figure of the entire investigated area calculated. II–III: Pole figures of some areas studied in detail and superimposed on the whole pole figure (altered inner fibrous domain and altered lamellar domain in contact with matrix, respectively).

Roemeripora bohemica shows a high variation in the c-axis orientation of the microstructure (Fig. S2a, b in the online Supplementary Material available at http://journals.cambridge.org/geo). The petrographic micrograph (Fig. S2a in the online Supplementary Material available at http://journals.cambridge.org/geo) shows two fibrous and lamellar walls separated by a lamina media composed of hyaline elements with a discontinuous appearance. The fibrous area is small compared with the lamellar domain and it is near to the median lamina. The orientation (azimuth) of the c-axis of the lamellae and fibres is concordant in both walls (perpendicular and parallel to the morphological axis, respectively) and the inclination is variable between both walls. The right wall shows an inclination similar to that described in other taxa (~ 55–65°), whereas the left wall shows an inclination between ~ 70 and 85°. The hyaline elements of the median lamina have random orientations (Fig. S2c in the online Supplementary Material available at http://journals.cambridge.org/geo), mostly with a single orientation of each crystal. The skeletons show clear evidence of diagenetic alteration in some areas that show random orientations. On the other hand, the shared wall of Roemeria cubiniensis shows a microstructure composed of short irregular fibres disposed in rows (Fig. S2d in the online Supplementary Material available at http://journals.cambridge.org/geo) separated by a median lamina of disseminated hyaline elements. The orientation is concordant between the two walls, being parallel to the morphological axes of the fibres and in this case also to the rows. The inclination of the microelements is variable between the two walls, depending on the corallite and the distance to the median lamina. The maximum pole is focused in the lower side of the image at ~ 60–70° near to the lumen and at ~ 35–40° near to the median lamina. Furthermore, the fibres of the upper wall of the image have a maximum at ~ 35–40° in areas close to the median lamina and at ~ 5–10° near to the lumen. On the other hand, the median lamina is composed of irregular microcrystals (stellate-shaped) with a random c-axis orientation (Fig. S2f in the online Supplementary Material available at http://journals.cambridge.org/geo). The uppermost part of the image shows a diagenetic alteration zone that has advanced to the median lamina from the right part of the image.
4.c.3. Neomultithecopora
Neomultithecopora cantabrica allows the study of the in situ variation of c-axis orientation between a phaceloid and pseudocerioid–cerioid internal structure. The samples studied by CIP correspond to two transverse sections of cerioid (Fig. S1a–c in the online Supplementary Material available at http://journals.cambridge.org/geo) and phaceloid growth (Fig. 8d, e). The petrographic micrograph shows a cerioid transverse section with two lamellar sclerenchyma separated by an irregular (slightly wavy) granular median lamina (Fig. S1a in the online Supplementary Material available at http://journals.cambridge.org/geo). The lamellar domains show a concordant c-axis orientation (azimuth) in the lamellae (perpendicular to the morphological axis), and the variation of inclination in both walls is similar at ~ 25–35° (Fig. S1c in the online Supplementary Material available at http://journals.cambridge.org/geo). The granular zone has many regions with variable c-axis orientations with diverse colourations (Fig. S1b in the online Supplementary Material available at http://journals.cambridge.org/geo); a similar pattern has been observed in the lower wall and some scattered zones in both walls. These regions have random c-axis orientation patterns (Fig. S1c in the online Supplementary Material available at http://journals.cambridge.org/geo), which indicates diagenetic alteration. Nonetheless, the granules of the median laminae still show original orientations with directions concordant to the main microstructural elements. The inclinations in those zones are high, with values of ~ 75–85°, as shown by the light colourations in these regions. The phaceloid section of N. cantabrica is composed of an inner fibrous domain in the palisade and an external lamellar domain (Fig. 8d). This main lamellar domain has a c-axis orientation (azimuth) perpendicular to the morphological axis and towards the lumen (Fig. 8e, f) and an inclination of ~ 20–35° depending on the location in the section (Fig. 8f). The fibrous domain and some areas of the lamellar domains have random c-axis orientations, specifically the areas in contact with the lumen, although some fibres still show original (azimuth and inclination) c-axis orientations (Fig. 8e). The same process occurs with the lamellae in contact with the matrix.
4.c.4. Pleurosiphonella
A halysitid shared wall between two corallites over a connecting tubule has been studied in Pleurosiphonella sp. (Fig. 9a–c). The orientation image shows a complex conformation of the shared wall. The microstructure of Pleurosiphonella sp. is composed of a main lamellar domain and an external inner fibrous domain. The main orientations are subdivided by quadrants separated by a symmetric plane along the connecting tubule and a net-like contact between corallites, as explained above. In those areas close to the contact between walls, the microelements are small, they have irregular morphologies (Fig. 9a) and their orientations depend on their position in the wall. The flattened microstructure close to the contact area is conditioned by the stretching of corallites. The c-axis orientation (azimuth) of the structure can be subdivided in three main orientations (Fig. 9b, c), shown by cool colourations in the pole figure (blue and purple). The symmetric plane separates two areas (upper and lower in the image) misoriented by ~ 40° in both walls. In turn, the left wall exhibits a gradual change in the disposition of its microstructure (upper left part of image), recovering the cylindrical conformation of the skeleton and misorienting the connecting area and the cylindrical sclerenchyma by ~ 60°. The main inclination of the c-axis in the different quadrants of the connecting structure is ~ 15º, whereas in the cylindrical conformation it is ~ 30–35° and in the lower quadrant of the right wall it is ~ 60°. On the other hand, a phaceloid transverse section of Pleurosiphonella sp. (Fig. 9d–f) shows alternating lamellar and fibrous domains (F–L–F). Both lamellae and fibres show a c-axis orientation coherent with the previous results. The transverse section shows a continuous orientation except for some small areas with visible diagenetic alteration, which exhibit a different orientation and are close to the matrix and lumen areas. The maximum pole (inclination) is focused at ~ 30° with some variations of 15–60° in some points of the section. The orientation (azimuth) is variable at ~ 40°, similar to other taxa studied (Fig. 9f).
(a–c) CIP analysis of a transverse section of Pleurosiphonella sp. in the area between shared walls over a connecting tubule. (a) Petrographic micrograph of the investigated area. White arrows point to contact point between corallites. (b) Orientation image of the studied area. (c) Standard colour look-up table (CLUT). I: Pole figure of the entire investigated area. II–III: Pole figures of some areas studied in detail and superimposed on the whole pole figure (contact area between both corallites and lamellar domain, respectively). (d–f) CIP analysis of a transverse section of Pleurosiphonella sp. of phaceloid growth in a cylindrical corallite. (d) Petrographic micrograph of the investigated area. (e) Orientation image of the studied area. (f) Standard colour look-up table (CLUT). I: Pole figure of the entire investigated area calculated. II–III: Pole figures of some areas studied in detail and superimposed on the whole pole figure (fibrous and lamellar domains, respectively).

4.d. Misorientation study
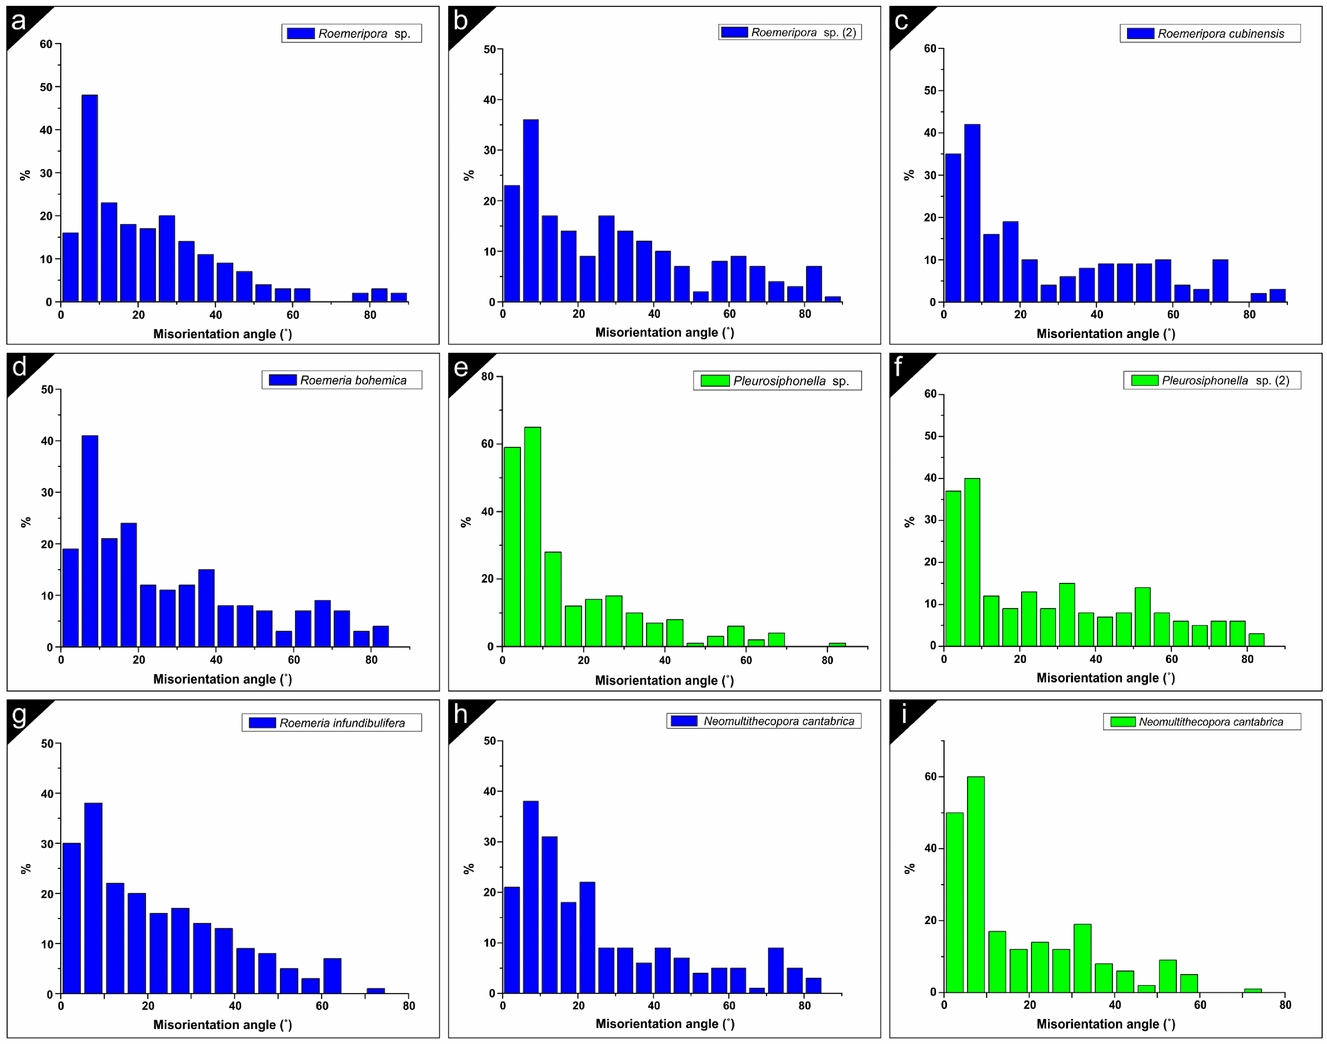
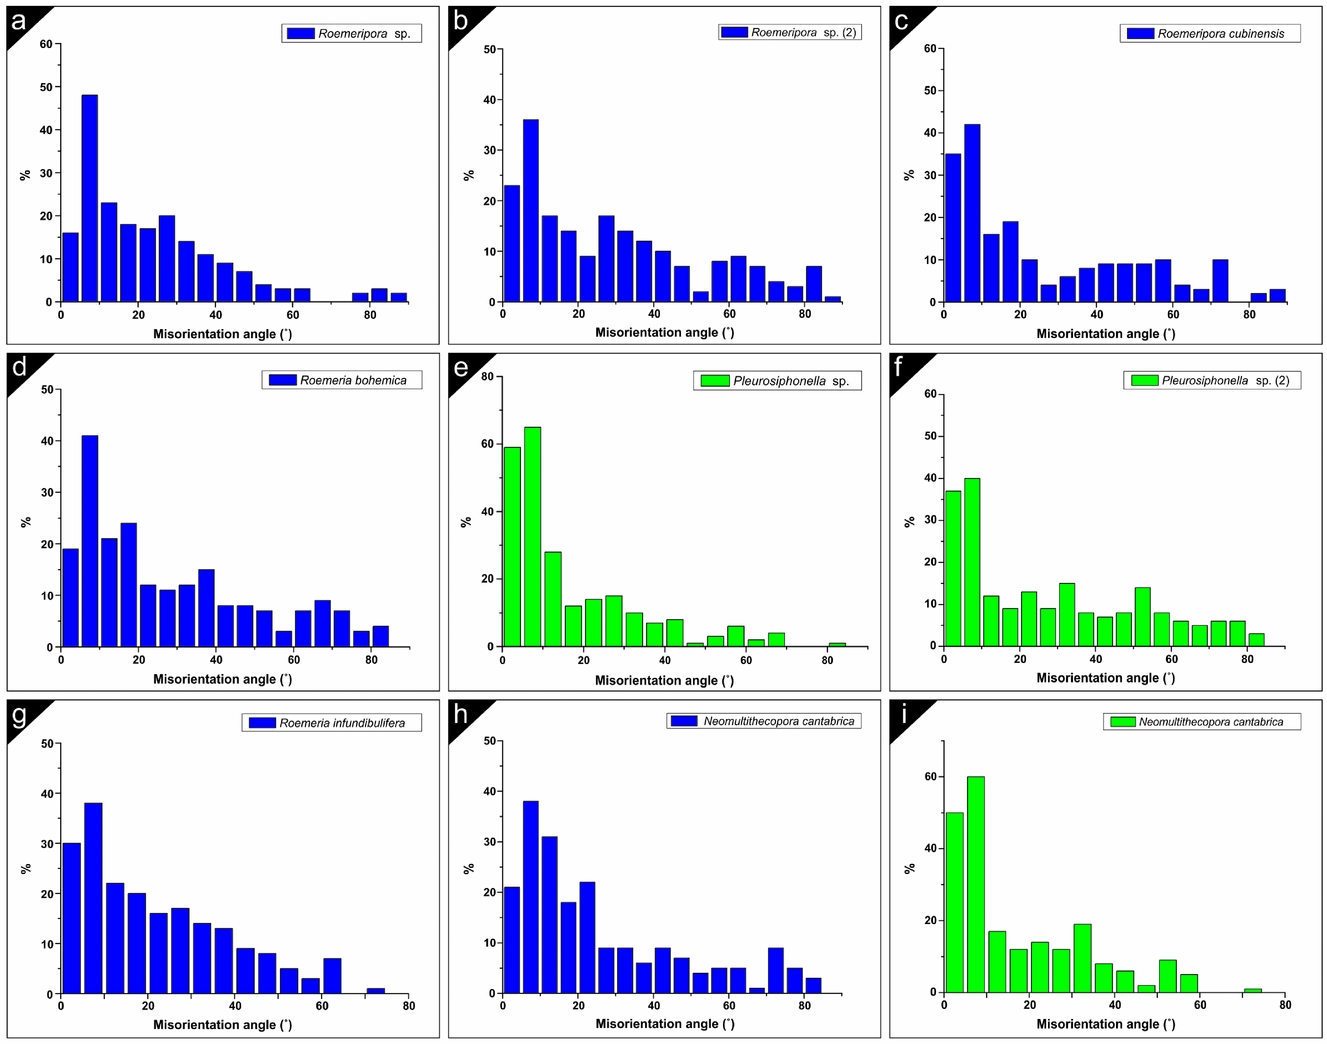
The correlated misorientation has been calculated by punctual measurement between two crystals (200 points per image). The CIP method has a crystallographic sensitivity of greater than 10° (Trimby & Prior, Reference Trimby and Prior1999), although we have measured some small variations above 5°, so the differentiation between crystals with the same orientation or a variation of less than 5° is difficult with this methodology, and for this reason the results may be somewhat different from those of the EBSD analysis, in which the main order of misorientation for Syringoporicae is 5° (Coronado, Pérez-Huerta & Rodríguez, Reference Coronado, Pérez-Huerta and Rodríguez2015b ). Similar results to the main misorientation obtained here were shown by Coronado, Pérez-Huerta & Rodríguez (Reference Coronado, Pérez-Huerta and Rodríguez2015a ) in Sinopora sp. The misorientation results for all studied taxa have been summarized in histograms (Fig. 10). The trend of misorientation depends on the analysed sections (oblique or transverse) and their internal structural organization (phaceloid or cerioid). There is a common result in all taxa independent of their internal structural organization. The main misorientation is 10° together with 5° in some phaceloid corals (green graphs). The general trend in the cerioid corals (blue graphs) is a lognormal distribution with a gradual decrease of the misorientation to higher angles (e.g. Roemeripora, Roemeria bohemica, R. infundibulifera and Neomultithecopora cantabrica). Variations in the trend can be related to the studied sections (transverse, or slightly oblique or the presence of wall elements). Similar results were obtained with EBSD for Roemeripora sp. in which the difference of 5° was the main order of misorientation. Otherwise, the phaceloid taxa show a lognormal distribution with an abrupt decrease from the main misorientation (interval of 5–10°) to higher angles. The example of Neomultithecopora cantabrica is the most representative (Fig. 10h, i), with diverse trends in the different internal structural organizations. Pleurosiphonella sp. shows that, depending on the section, the misorientation values vary. Figure 10e shows the values of misorientation of the shared-wall example in the connecting tubuli versus the cylindrical section (Fig. 10f).
(a–i) Relative frequency (%) of the correlated misorientation angles in different taxa studied by CIP. Note the variation between the phaceloid taxa (green histograms) and the cerioid taxa (blue histograms). Roemeripora sp. (2) corresponds with the area studied where a fibrous median lamina appears. Pleurosiphonella sp. (2) corresponds with the studied area in a cylindrical corallite.
5. Discussion
5.a. Micro- and nanostructure: highly organized self-assembled structures
The data described here reveal that the crystallostructural properties of Syringoporicae have still preserved most of their biogenic properties. The microstructural and nanostructural characteristics of the studied Syringoporicae are common in all of the taxa despite their internal structural organization and their differences in the crystallographic arrangement. Following the criteria proposed by Mann (Reference Mann2001) it can be inferred that the Syringoporicae skeletons are composed of hierarchical structures from the millimetre to nanometre scale. The skeletons are composed of ‘well defined structures’ as a calcitic sclerenchyma formed by concentric micro-domains, septal spines and tabules. The variation in the size, morphology and distribution of the micro-domains reveals that these features are conditioned by the taxonomy (Table, 1), showing distinctive ‘uniform particle sizes’ for each taxon. An example of this can be seen in Figure S3 in the online Supplementary Material (available at http://journals.cambridge.org/geo) where the different sizes (length and width) of the nanocrystals have been plotted for each taxon taking into account their morphologies. The box charts reveal that the nanostructure of Neomultithecopora cantabrica is similar between the samples from the two different localities. The modest differences appear to be related to intraspecific variation, but the morphology, the median values and their distribution is similar between them. Conspicuous differences can be observed between other taxa, highlighting that those with similarities in size have different morphologies. Both at the microscale and nanoscale the units that form the different bricks have ‘high levels of spatial organization’. On the one hand, imbricate calcite crystals (fibres and lamellae) forming either micro-domains or wall elements are observed at the microscale. On the other hand, at the nanoscale the microcrystals are composed of nanounits that form nanolaminae arranged in submicrometric intralaminations. Both micro- and nanounits have ‘complex morphologies’ composed of curved crystals very different to their inorganic counterparts. The alternating domains reveal at the microscale a ‘controlled aggregation and texture’ via the control produced by epithelial cells, which are responsible for mineralization in some Anthozoa (e.g. Scleractinia), and this control can be seen at the nanoscale where the co-oriented nanocrystals show that each microcrystal is forming a bio-composite (Mann, Reference Mann2001). The gradual transition between lamellae, fibres and equidimensional granules with intermediate morphologies is a common characteristic between all taxa and it seems to be an essential property in Palaeozoic corals (Lafuste, Reference Lafuste1978, Reference Lafuste1983; Rodríguez, Reference Rodríguez1989). As explained above, both micro- and nanotextures have a ‘preferential crystallographic orientation’, which suggest a great crystallographic control exerted by the epithelial tissue as was shown also in previous studies of other taxa of this superfamily (Coronado, Pérez-Huerta & Rodríguez, Reference Coronado, Pérez-Huerta and Rodríguez2013, Reference Coronado, Pérez-Huerta and Rodríguez2015a ,Reference Coronado, Pérez-Huerta and Rodríguez b ). This fact suggests that the epithelial cells are almost in contact with the mineralized substrate. All these lines of evidence emphasize that the skeletons of Syringoporicae are composed of highly organized ‘self-assembled structures’, as was shown by Coronado, Pérez-Huerta & Rodríguez (Reference Coronado, Pérez-Huerta and Rodríguez2013) for Multithecopora hontoriense.
5.b. Matrix-mediated biocrystallization
The new data presented here support the idea that skeletons of the Syringoporicae are a product of matrix-mediated biocrystallization. This hypothesis was established by Coronado, Pérez-Huerta & Rodríguez (Reference Coronado, Pérez-Huerta and Rodríguez2015b ) from crystallographic evidence, stating that skeletons are formed by a co-ordinated stepping growth mode. First, the dark envelopes observed around nanocrystals in all the samples studied, which are thicker between nanolaminae, have been interpreted by previous authors as intracrystalline organic matrix (Dauphin, Reference Dauphin2002; Cuif et al. Reference Cuif, Dauphin, Farre, Nehrke, Nouet and Salomé2008; Baronnet et al. Reference Baronnet, Cuif, Dauphin, Farre and Nouet2008; Checa et al. Reference Checa, Mutvei, Osuna-Mascaró, Bonarski, Faryna, Berent, Pina, Rousseau and Macías-Sánchez2013; Gorzelak et al. Reference Gorzelak, Stolarski, Mazur and Meibom2013). This organic matrix could correspond to an organic-hydrogel secreted by epithelial cells. This model supports the idea that growth would have been produced in steps, from the secretion of the organic matrix, which acted as a site of crystallization. The process of biocrystallization continued by the addition of organic layers and their subsequent crystallization, forming submicrometric intralaminations to form the microcrystal. This process has been described and coined by Cuif et al. (Reference Cuif, Dauphin, Nehrke, Nouet and Perez-Huerta2012) for scleractinians and molluscs, from the observation of these organic phases by AFM and their confirmation via structural and compositional evidence. Also, it has been suggested for other groups where this kind of evidence (organic linings and intralamination) can be observed at both the structural and compositional level, such as echinoderms, foraminifers and brachiopods (Cusack et al. Reference Cusack, Dauphin, Chung, Pérez-Huerta and Cuif2008; Cuif et al. Reference Cuif, Dauphin, Nehrke, Nouet and Perez-Huerta2012; Gorzelak et al. Reference Gorzelak, Stolarski, Mazur and Meibom2013). Although this model can only clarify the formation of single microcrystals, it is necessary to understand the process of formation of a complete framework and the relationships between the microunits. On this point, Coronado, Pérez-Huerta & Rodríguez (Reference Coronado, Pérez-Huerta and Rodríguez2015b ) interpreted, on the basis of crystallographic data, that the nucleation between co-oriented crystals could be produced by a mechanism similar to mineral bridges, maintaining the preferred crystallographic orientations during the process of growth. The misorientation study revealed that most microcrystals are co-oriented and the EBSD images showed that they are separated by a dashed line, which was attributed to intercrystalline organic matrix, whereas the misoriented crystals have a mostly continuous intercrystalline organic matrix. The new data from AFM contributed here supports this hypothesis. The contact between co-oriented microcrystals is bridged by co-oriented nanounits and the etched valley between crystals is deeper and continuous between those misoriented microcrystals. Thus, during the secretion of organic-hydrogel two kinds of organic matrices are differentiated. The porous intercrystalline organic matrix, which could be responsible for acting as a template for the morphology of the microcrystals confining the biocrystallization, and the intracrystalline organic matrix could be responsible for the growth of the nanounits and their posterior conformation in microcrystals by aggregation of nanolaminae.
Thus, the skeleton structure (at the micro- and nanoscale) seems to be a reflection of the genetic code. The modes of growth and the conformation of microstructures are homogeneous in all the studied taxa and comparable with previous studies (Coronado, Pérez-Huerta & Rodríguez, Reference Coronado, Pérez-Huerta and Rodríguez2013, Reference Coronado, Pérez-Huerta and Rodríguez2015a , Reference Coronado, Pérez-Huerta and Rodríguez2015b ). Likewise, the variation in sizes and morphologies of the micro- and nanocrystals seem to be related to taxonomy.
5.c. Shared walls: meaning of median lamina
As described in Section 4.a above, three principal kinds of calcite crystals are recognized in the studied taxa: lamellae, fibres and granules (equidimensional and hyaline elements). Regardless of the morphology of the crystals, the fibres and lamellae in the different taxa have common crystallographic characteristics, with the c-axis oriented (azimuth) towards the lumen. The inclination is variable and depends on the internal structural organization. The phaceloid taxa (Neomultithecopora cantabrica and Pleurosiphonella sp.) have a distinctive inclination of the c-axis of 20–35° with respect to the microcrystal. An equivalent value was measured by EBSD and CIP in other phaceloid Syringoporicae (Coronado, Pérez-Huerta & Rodríguez, Reference Coronado, Pérez-Huerta and Rodríguez2015a , Reference Coronado, Pérez-Huerta and Rodríguez2015b ). This value seems to represent the inclination of the lamellae with respect to the growth direction (according to the morphological axis). This value is variable in the cerioid/pseudocerioid taxa. Some cerioid taxa show an inner variation of c-axis inclination along the wall excluding the median lamina. This variation corresponds with a misorientation between the areas (external to internal) of ~ 30°, and usually the higher inclination is located towards the lumen and may be conditioned by the presence of wall structures such as septal spines or tabules, and it depends on the inclination of these structures with respect to the lumen (as occurs in Roemeria infundibulifera, R. cubiniensis and Roemeripora sp.; details of wall elements in Lafuste & Tourneur, Reference Lafuste and Tourneur1988a ; Coronado, Pérez-Huerta & Rodríguez, Reference Coronado, Pérez-Huerta and Rodríguez2015b ). Coronado, Pérez-Huerta & Rodríguez (Reference Coronado, Pérez-Huerta and Rodríguez2015b ) showed that the formation of these wall elements conditioned the surrounding microstructure and their crystallographic arrangement. Even so, the most common value in the transverse section for the inclination of the c-axis of the microelements is ~ 30–35°, similar to that in phaceloid taxa. Some shared walls have a variation of c-axis inclination between them. Roemeripora sp. (in the transverse section) and Roemeria bohemica show a misoriented c-axis inclination in shared walls of ~ 40° and 20°, respectively. Petrographic micrographs of Roemeripora sp. et al. showed that the interference colours under polarized light never match with the median lamina in any side of the prismatic wall, but in some sides the colour (which indicates c-axis orientation) is similar between the two shared walls (Coronado, Pérez-Huerta & Rodríguez, Reference Coronado, Pérez-Huerta and Rodríguez2015b ), coinciding with the observations by CIP in most of the studied taxa. This complex conformation can be related to the origin of the median lamina.
The crystallographic and structural data have revealed two singular features about the hyaline elements. One of them is that they never have a gradual transition to other sclerenchyma microelements, as happens in the transition of fibres, lamellae and equidimensional granules. In addition, the crystallographic orientations (azimuth) of the c-axes of hyaline elements, independent of their morphology, always have a random orientation with regards to the sclerenchyma. These two features seem to indicate that the hyaline elements have an inorganic origin. As Lafuste & Tourneur (Reference Lafuste and Tourneur1991) described in Thamnopora and as can be seen in the Syringoporicae studied here, the hyaline elements show the presence of spotted opaque particles in the interior of some crystals observed by petrographic microscopy, suggesting that these spots are the remains of organic matter preserved within the crystals. This could explain the presence of hyaline elements and the interruption of growth between both corals. The median lamina with hyaline elements is discontinuous and the hyaline elements could be spaces where the epithelial tissue was trapped between two shared walls during growth. After the organic decay, the biomolecules were occluded by the crystal faces as inclusions during the precipitation of cements into spaces. Crystallization in the presence of organic compounds can generate irregular morphologies that could have suggested to Lafuste & Tourneur (Reference Lafuste and Tourneur1991) the organic origin of these structures. Recently, there have been numerous experiments on controlled crystallization in the presence of organic molecules and their control over morphological habits, which change substantially (Falini et al. Reference Falini, Manara, Fermani, Roveri, Goisis, Manganelli and Cassar2007; Goffredo et al. Reference Goffredo, Vergni, Reggi, Caroselli, Sparla, Levy, Dubinsky and Falini2011; Nindiyasari et al. Reference Nindiyasari, Fernández-Díaz, Griesshaber, Astilleros, Sánchez-Pastor and Schmahl2014). This evidence suggests that hyaline elements should be not considered as granules.
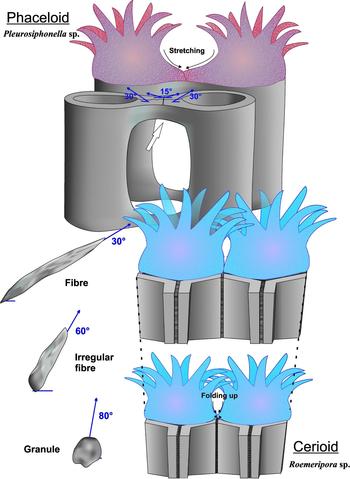
A singular feature of the median lamina composed of equidimensional granules is the presence of a high inclination of the c-axis. Roemeripora sp. and Neomultithecopora cantabrica median laminae show, by the c-axis orientations (azimuth), that both walls take part in the growth of this lamina. The variation of inclination between the walls and the granules of the median lamina is ~ 20–50°. There are some types of evidence in the studied taxa that help us to understand the origin of granules. One of them is found in Pleurosiphonella sp., where the microelements of the connecting tubule change their morphologies in the contact zone where the crystal size is reduced (Fig. 11). The inclination of the c-axis in these areas is varied, losing the regular inclination of ~ 30° to ~ 15°, which indicates a stretching of polyps during growth (Fig. 11). Even so, the connecting tubule grew forming a cylindrical structure as the misorientation study shows (Fig. 10f). In the case of Roemeripora sp. or N. cantabrica the microelements near the median lamina change their morphology, passing to intermediate morphologies (cupolar-shaped to granules in Roemeripora sp. or irregular fibres to granules in N. cantabrica). Apart from this evidence, in the case of Roemeripora sp., a process of ‘fibrization’ of the median lamina (Lafuste, Fernández-Martínez & Tourneur, Reference Lafuste, Fernández-Martínez and Tourneur1992) can be observed in thickened areas, in which the median lamina is composed of fibres. This process has been described in other Palaeozoic corals (Lafuste & Tourner, Reference Lafuste and Tourneur1988b ; Lafuste, Fernández-Martínez & Tourneur, Reference Lafuste, Fernández-Martínez and Tourneur1992). An orientation image of this area reveals that the fibres of the median lamina have an inclination of the c-axis that depends on the inclination of both sides, in this case the left wall has an inclination of ~ 75–85° and the fibres have an inclination ~ 75°, whereas in the right side the fibres are at ~ 40° and the microlamellae of the right side are at ~ 50–60°. This fact suggests that during the growth process, due to the proximal contact of polyps in a cerioid structure, the epithelial tissues of two polyps were in contact during the secretion (as occurs in Pleurosiphonella sp.). Coronado, Pérez-Huerta & Rodríguez (Reference Coronado, Pérez-Huerta and Rodríguez2015b ) interpreted that the secretion began in the external part of the corallite towards the lumen. As explained above, the biomineral features of Syringoporicae reveal that the epithelial cells were very close to the skeleton, controlling the biocrystallization process almost in contact. Thus, variation in the position of the epithelial tissue (either stretching or folding) varies the space of crystallization and their crystallographic properties and the morphology of the microcrystals. Consequently, the high c-axis inclinations of granules indicate that the two epithelial tissues were in contact and probably folded up (Fig. 11). In that situation, the growth of microelements (e.g. fibres) was aborted and the equidimensional granules were formed due to lack of space between both walls. An example of this can be observed in Figure 4e, where the fibres of Neomultithecopora cantabrica began to grow, but they were aborted, appearing as granules. During the vertical development of the colony, the polyps grew and the diameter of the corallites was widened and the wall was thickened whereby there was more space to secrete a true domain of fibres (Fig. 11). These have a concordant inclination with the walls, as occurs in Roemeripora sp. The equidimensional granules have been described in the middle lines of septa, the basal surfaces of tabulae and dissepiments, and in shared walls of colonial forms in rugose and tabulate corals. All these locations are related to limited space for growth of microelements.
Upper part of image shows a schematic representation of the shared wall of halysitid corallites of Pleurosiphonella sp. and the variation of c-axis orientation around the contact area by the stretching of polyps. Lower part of image shows the variation of morphologies and c-axis orientation of granules and fibres by the folding up of polyps in a cerioid taxon similar to Roemeripora sp.

5.d. Cerioid growth: a genetic architectonical solution
Mann (Reference Mann2001) stated that the main control mechanisms in biomineralization processes are governed by a gene pool, which is conditioned by bioenergetic processes (e.g. growth of corals during the day in the presence of the sun or by the presence of nutrients) and adapted to environmental influences. These control mechanisms are a complex interrelated network and they are chemical (ion transport, saturation), spatial (confining processes of supramolecular organization), structural (preferential nucleation), morphological (morphogenesis) and constructional (higher-order structures). The biomineralization process in Syringoporicae is controlled mainly from the molecular level to the millimetre scale by the genetic code, as was displayed before.
The variation in astogeny (pattern formation in colonial organisms; Hammer, Reference Hammer1998) is common in the Syringoporicae as an architectonical solution to environmental fluctuations stabilizing the colony. Different strategies have been described: prostrate and reticulated growth (e.g. ‘auloporoid reticulum’ in Multithecopora, Tchudinova, Reference Tchudinova1986); an erect colony with reticulated connecting structures (e.g. Syringopora, Nowinski, Reference Nowinski1991); a cerioid massive dome-shaped colony (e.g. Roemeria, Mistiaen, Reference Mistiaen and Brice1988); or the irregular cateniform palisades of halysitid corals (e.g. Catenipora, Hammer, Reference Hammer1998). These changes have also been interpreted as an improved feeding system (Hammer, Reference Hammer1998 and references herein). The intraspecific variation of the internal structural organization or the astogenetic changes of Syringoporicae (phaceloid or cerioid) depend on spatial, structural and morphological controls. As an example, in colonies of Neomultithecopora cantabrica and Roemeria, the internal structure of the colony changed from phaceloid to cerioid probably owing to stressful moments such as an increase in wave action, storms or gravitational instability (Fig. S4 in the online Supplementary Material available at http://journals.cambridge.org/geo) or ecological behaviour such as feeding strategies. Some of these factors and their relationships to the colony form were analysed by Young & Scrutton (Reference Young and Scrutton1991) and summarized by Scrutton (Reference Scrutton1998). In contrast, other Syringoporicae subjected to environmental stress conditions (increasing wave energy) arrange the corallites and their morphologies into irregular patterns without losing the phaceloid arrangement (Coronado & Rodríguez, Reference Coronado and Rodríguez2014). The crystallographic data provided here suggest that in spite of the environmental conditions the crystallographic arrangement and the final morphology of the colony were only controlled by the genetic code. The cerioid taxa have specific misorientation and c-axis inclination variations which can be conditioned by the disposition of the microcrystals on individual sides in a prismatic structure (Fig. S4 in the online Supplementary Material available at http://journals.cambridge.org/geo) instead of correlative variation in a cylindrical structure (Fig. S4 in the online Supplementary Material available at http://journals.cambridge.org/geo).
The ability of some Syringoporicae families to arrange the microstructures in other systems may be a potential adaptive advantage for colonizing different environments. This could be explained by the development of a structure that remains as a honeycomb in cerioid colonies. These structures are known as ‘cellular structures’ (Gibson & Ashby, Reference Gibson and Ashby1997), which are an interconnected network of solid pillars or plates which form the edges and faces of cells and are very common in the natural world (as in wood, bones, sponge structures). Some of the most important features of a cellular solid are its relatively low density and its high plasticity under uniaxial and biaxial deformations (Gibson & Ashby, Reference Gibson and Ashby1997). Under seawater, the maximum efforts are conditioned by wave energy, which could produce uniaxial deformation of the colonies in conditions of maximum stress, and the pores of connection between corallites could favour this mechanism, allowing the passage of water. This feature together with the prismatic morphology of corallites at the macroscale is a relevant strategy to avoid fracture by cleavage; because the main orientation of the c-axis in each side of the wall is misoriented at 60° (Fig. S4 in the online Supplementary Material available at http://journals.cambridge.org/geo), this could have been an evolutionary advantage to colonize marine realms during the Palaeozoic.
6. Conclusions
The structural and crystallographic comparative study of cerioid, pseudocerioid and phaceloid taxa with shared walls has revealed:
-
(1) Micro- and nanotextural features are common in all of the skeletons studied, showing that they were composed of hierarchical structures from the millimetre to nanometre scale.
-
(2) The data presented here show that the Syringoporicae skeletons were a product of matrix-mediated biocrystallization, suggesting a co-ordinated stepping growth mode for the formation of microcrystals and a growth system similar to mineral bridges to produce the whole skeleton. Thus, the data reveal that the skeleton structure is a reflection of the genetic code.
-
(3) The median lamina is formed by the joint crystallization of both polyps at the same time. Crystallographic data reveal that the hyaline elements have an inorganic origin, in contrast to equidimensional granules. The crystallographic and structural data reveal that the granules could be aborted fibres during the growth of two corallites in contact.
-
(4) The variation in the internal structural organization (phaceloid, or cerioid) is conditioned by the environment but the final structure is controlled by genes. The modifications are observable in the crystallographic arrangement, which is controlled by genetics, which is derived from the disposition of epithelial tissue.
Acknowledgements
Financial support through the Spanish Ministerio de Economía y Competitividad (research project CGL2012–30922BTE) and Complutense University Research Group (910231) is gratefully acknowledged. I.C. acknowledges financial support through a FPI-UCM grant and a Synthesis grant (FR-TAF-2397) developed at MNHN (Paris, France) during 2012, which allowed studying the material of Lafuste's collection. We sincerely thank the staff of the Centro Nacional de Microscopía Electrónica (CNME, Complutense University of Madrid, Spain), where SEM and AFM were used. This research is a contribution to the IGCP Project 596 (Climate change and biodiversity patterns in the Mid-Palaeozoic). We also give our sincere thanks to Ian D. Somerville (UCD) for his advice and the English revision of the manuscript. We thank the reviewers (Dr Graham Young and anonymous) and the editor (Prof. Graham Budd) for their help and constructive comments on the text.
Supplementary material
To view supplementary material for this article, please visit http://dx.doi.org/10.1017/S0016756815000862