Introduction
Loess–paleosol sequences (LPS) have a primary aeolian origin and represent common terrestrial Quaternary deposits in the mid-latitudes. In spite of their smaller thickness, fragmentation, and younger age (Haase et al., Reference Haase, Fink, Haase, Ruske, Pécsi, Richter, Altermann and Jäger2007; Rousseau et al., Reference Rousseau, Derbyshire, Antoine and Hatté2018), Western and Central European loess deposits reveal a strong influence of the North Atlantic circulation, shaping the intensity and cyclicity of the cold-arid and humid periods (Antoine et al., Reference Antoine, Rousseau, Moine, Kunesch, Hatté, Lang, Tissoux and Zöller2009; Sima et al., Reference Sima, Rousseau, Kageyama, Ramstein, Schulz, Balkanski, Antoine, Dulac and Hatte2009; Martin-Garcia, Reference Martin-Garcia2019; Újvári et al., Reference Újvári, Bernasconi, Stevens, Kele, Páll-Gergely, Surányi and Demény2021). Loess deposits there are relatively thin, comprised mainly of last glacial loess and Holocene soils (Rousseau et al., Reference Rousseau, Derbyshire, Antoine and Hatté2018). On the other hand, Central and South-Eastern European loess areas are characterized by thicker deposits, extending back to 1 Ma (Forster et al., Reference Forster, Heller, Evans and Havlicek1996; Jordanova and Petersen, Reference Jordanova and Petersen1999; Panaiotu et al., Reference Panaiotu, Panaiotu, Grama and Necula2001; Jordanova et al., Reference Jordanova, Hus and Geeraerts2007; Marković et al., Reference Marković, Stevens, Kukla, Hambach, Fitzsimmons, Gibbard and Buggle2015, and references cited therein; Antoine et al., Reference Antoine, Lagroix, Jordanova, Jordanova, Lomax, Fuchs and Debret2019).
The Lower Danube loess area is part of the European loess belt, linking Eastern Eurasian loess with the western end of the loess belt. The Lower Danube loess is of special importance for development of a spatially consistent view of the environmental processes and factors that played a role during the Pleistocene glacial stages. Moreover, the important role of the Danube River lowlands for the spread of early humans and hominid migration is another motivation for continuing research efforts (Fitzsimmons et al., Reference Fitzsimmons, Marković and Hambach2012; Tourloukis, Reference Tourloukis, Harvati and Roksandic2016).
The aim of the present study is to reveal the significance of local factors and their relative importance in the cumulative magnetic signal, thereby influencing the magnetic paleoclimate proxies from loess–paleosol archives. This is of critical importance for separation of local and regional/global signatures utilized for quantitative paleoclimate reconstructions of paleo-precipitation and paleo-temperature using pedogenic magnetic enhancement.
Study area and profile locations
The study area is located in SE Europe in the Lower Danube region, which is an important part of the Pontic East European loess domain (Lehmkuhl et al., Reference Lehmkuhl, Nett, Potter, Schulte, Sprafke, Jary and Antoine2021, Fig. 1). The importance of the region is defined by its geographical location at the intersection of different dust sources (e.g. Black Sea shore shelf sediments; floodplain alluvial sediments of the Danube River; long-distance, far-travelled dust from proglacial zone of the Fennoscandian Ice Sheet; and local dust sources) (Lehmkuhl et al., Reference Lehmkuhl, Nett, Potter, Schulte, Sprafke, Jary and Antoine2021; Fenn et al., Reference Fenn, Millar, Bird, Veres and Wagner2025). The loess–paleosol complex in the Kaolinovo area, situated near the southern border of the loess cover in North Bulgaria (Evlogiev, Reference Evlogiev2007), consists of seven loess horizons, two of which (L3 and L4) are marked only by layers of large hard CaCO3 concretions, six paleosols, and the Holocene soil on top of the sequence. The established stratigraphic scheme for the loess–paleosol sequences in North Bulgaria is based on the magnetostratigraphic study of the Viatovo profile (Jordanova et al., Reference Jordanova, Hus, Evlogiev and Geeraerts2008) and correlations of magnetic susceptibility records with the global δ18O stack of Lisiecki and Raymo (Reference Lisiecki and M.E2005) (Jordanova et al., Reference Jordanova, Hus, Evlogiev and Geeraerts2008, Reference Jordanova, Laag, Jordanova, Lagroix, Georgieva, Ishlyamski and Guyodo2022a).
(a) Topographic map of Europe with Lower Danube area indicated (source: European Environment Agency) (https://www.eea.europa.eu/en/analysis/maps-and-charts/elevation-map-of-europe; accessed 11 July 2025). (b) Loess cover in the Lower Danube area and the location of the studied site. Locations of the loess–paleosol sequences from North Bulgaria, discussed in the text: Kaolinovo (KAO); Viatovo (VIA) (Jordanova et al., Reference Jordanova, Hus, Evlogiev and Geeraerts2008); Suhia kladenetz (SK) (Jordanova et al., Reference Jordanova, Laag, Jordanova, Lagroix, Georgieva, Ishlyamski and Guyodo2022a), and Koriten (KOR) (Jordanova and Petersen, Reference Jordanova and Petersen1999). Loess map after Lehmkuhl et al. (Reference Lehmkuhl, Nett, Potter, Schulte, Sprafke, Jary and Antoine2021).

The Viatovo quarry is situated approximately 60 km NW of Kaolinovo at the same paleogeomorphic level (Fig. 1b, site VIA). A clearly identified Brunhes–Matuyama paleomagnetic reversal in the oldest loess L7 reveals that the loess–paleosol complex in the area covers the last 800 ka. Below the loess complex, red clay deposits 4–6 m thick are present regionally. According to the magnetostratigraphic results for the Viatovo section (Jordanova et al., Reference Jordanova, Hus, Evlogiev and Geeraerts2008), two normal polarity magnetozones, presumably identified as Jaramillo and Olduvai subchronozones, were discovered in the red clay formation. This suggests an age of 1.2–1.8 Ma for the red clay unit. Pre-Quaternary basement is represented by Lower Cretaceous limestones, which are strongly affected by karstification.
The loess–paleosol sequence in the Kaolinovo area crops out in a number of open quarries used for kaolin extraction. Five sampling locations within three open pits in close proximity (within ∼2 km distance) have been studied (Fig. 2a). The local relief is slightly undulating with altitudes above sea level varying between 287 and 300 m (Fig. 2b). The paleo-karst relief is uneven, characterized by both positive and negative forms. The negative paleokarst relief is filled with kaolinitic deposits, composed of bottom (mantle) infilling, kaolin body, and infiltration zone. The shapes of the kaolin bodies are determined by the contour of the paleokarst valley (Tonov et al., Reference Tonov, Vangelova and Vangelov2016). A SW–NE transect (A–A’ profile line in Fig. 2c) across the Dojrantsi quarry was used to study the kaolinitic deposits filling the karstified paleo-relief. Separate uplifted limestone bodies define positive shapes, which are inherited by the younger kaolinitic infillings and even by the Quaternary red clays and the LPSs on top (Fig. 2c). The position of location 1 is situated downslope of such a feature, which determines the presence of the thickest deposits within the quarry.
(a) Terrain map (Google Maps Inc.) (https://www.google.com/maps/@43.6041685,27.1516756,3620m; accessed 10 July 2025) of Kaolinovo area with studied locations 1–5 from Dojrantsi and Kus quarries. (b) Elevation map of the study area (TessaDEM Open Database License 1.0) (https://en-us.topographic-map.com/world/?center=43.60368%2C27.12896&zoom=13; accessed 8 July 2025) with indicated study locations 1–5. (c) Vertical geological cross section of the deposits within Dojrantsi quarry taken along A–A’ surface profile line shown in (a). Modified after Tonov et al. (Reference Tonov, Vangelova and Vangelov2016). Legend: 1 = Quaternary loess–paleosol complex and red clays; 2 = conditional kaolinitic sands; 3 = unconditional kaolinitic sands; 4 = unconditional kaolinitic sands not sampled; 5 = kaolinitic clays; 6 = clays and sandy clays; 7 = limestones.
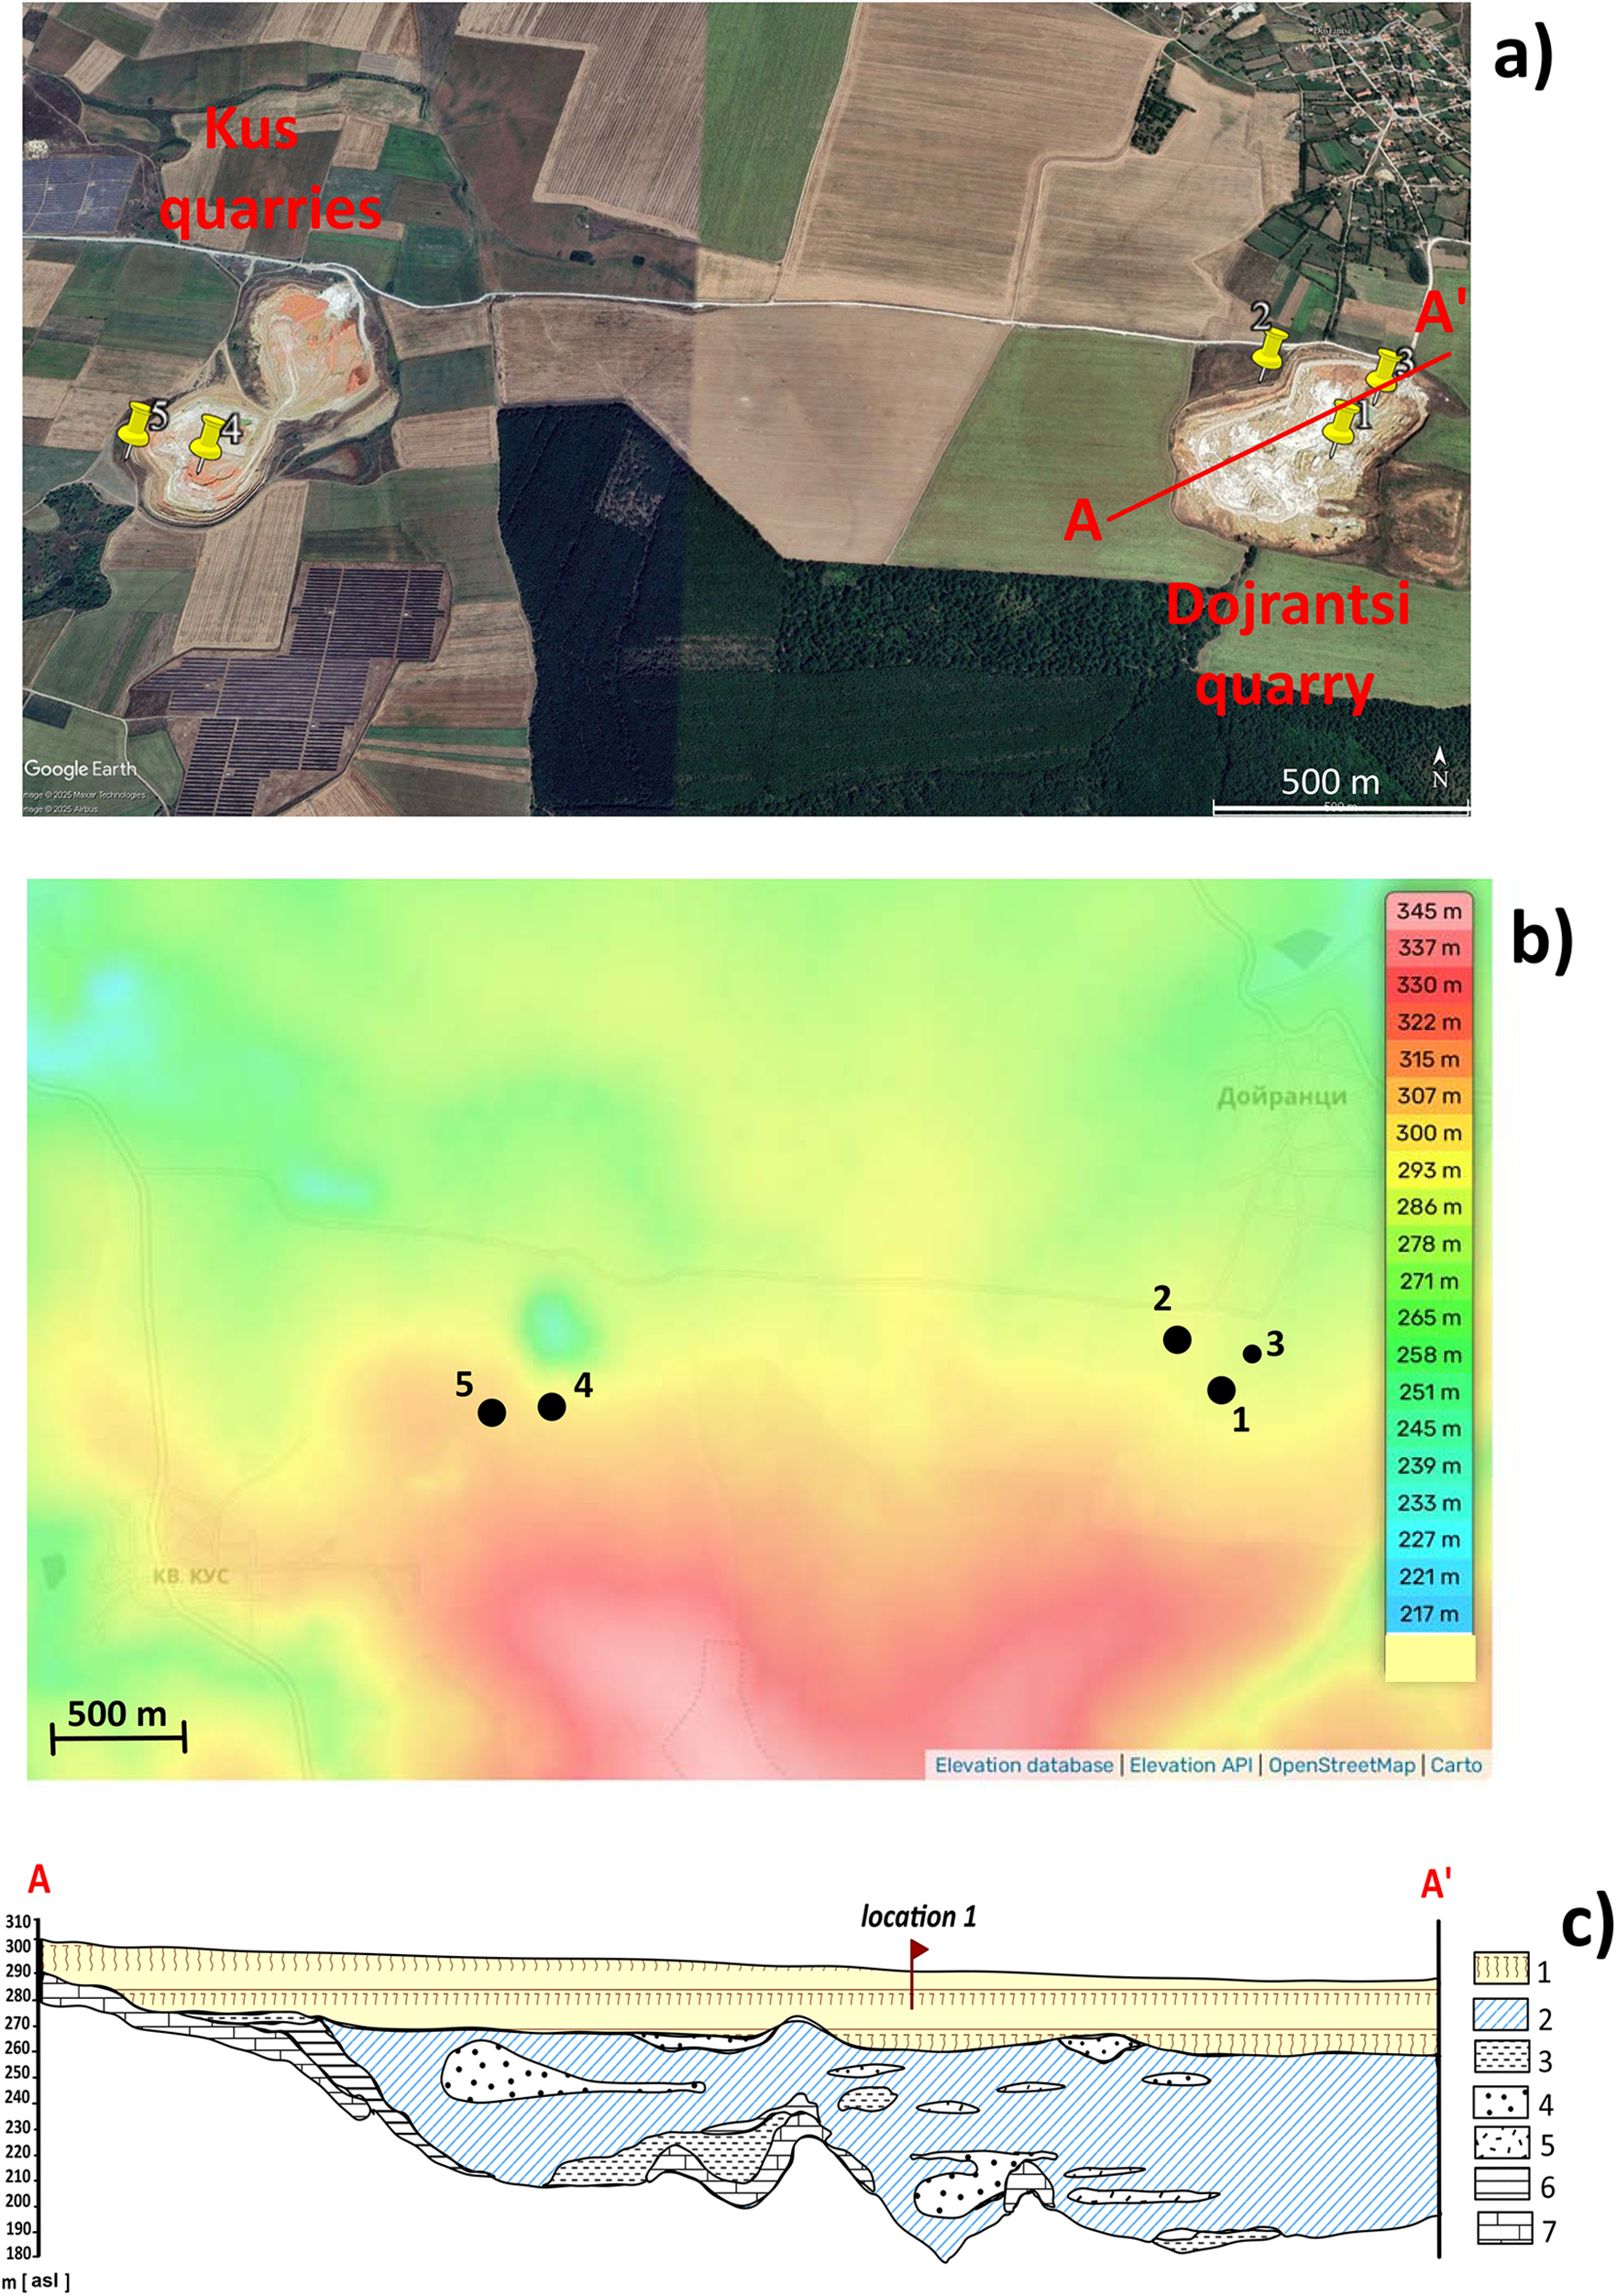
Two continuous depth profiles were sampled at Dojrantsi quarry (locations 1 and 2 in Fig. 2a, b): one profile was sampled in 2011 (Kao2011 profile, location 1) and the second profile was sampled in 2017–2019 (Kao2017 profile, location 2). The studied upper part of the loess–paleosol sequence at location 2 is represented by 12-m-thick deposits consisting of a Holocene soil (S0), 3 intercalated paleosols (S1, S2, S3–4), and the loess horizons (L1, L2, L3, L5). The upper part of the profile at location 1 consists of the same units, but has a thickness of 15 m. The lowermost part of the loess–paleosol sequence (S6, L7, and the red clays complex at the bottom), represented by 5-m-thick deposits, also has been sampled. The pedocomplex of S3–S4 paleosols at location 1 showed strong signs of water logging, thus additional sampling of this unit at location 3 was carried out (Fig. 2a, b).
The most recent sampling campaigns in the area were accomplished at nearby Kus quarries. Location 4 (profile KUS I, covering recent soil S0 and the first loess L1) and profile KUS II (S3–4–L5) were sampled in 2019. Profile KUS II was sampled to better constrain of the boundary between the S4 paleosol and the lower loess horizon L5, because at location 2 (Kao2017 profile) loess L5 was not clearly identified in this pedocomplex. At location 5, the lowermost 8 m of the sequence, covering S4, L5, S5, L6, S6, and L7 (Kus III) was sampled in 2023 (Supplementary Fig. 1S) with the purpose of filling the sampling gap in the Kao2011 record at the 15.5–16.2 m depth and to establish a representative stacked record for the Kaolinovo site.
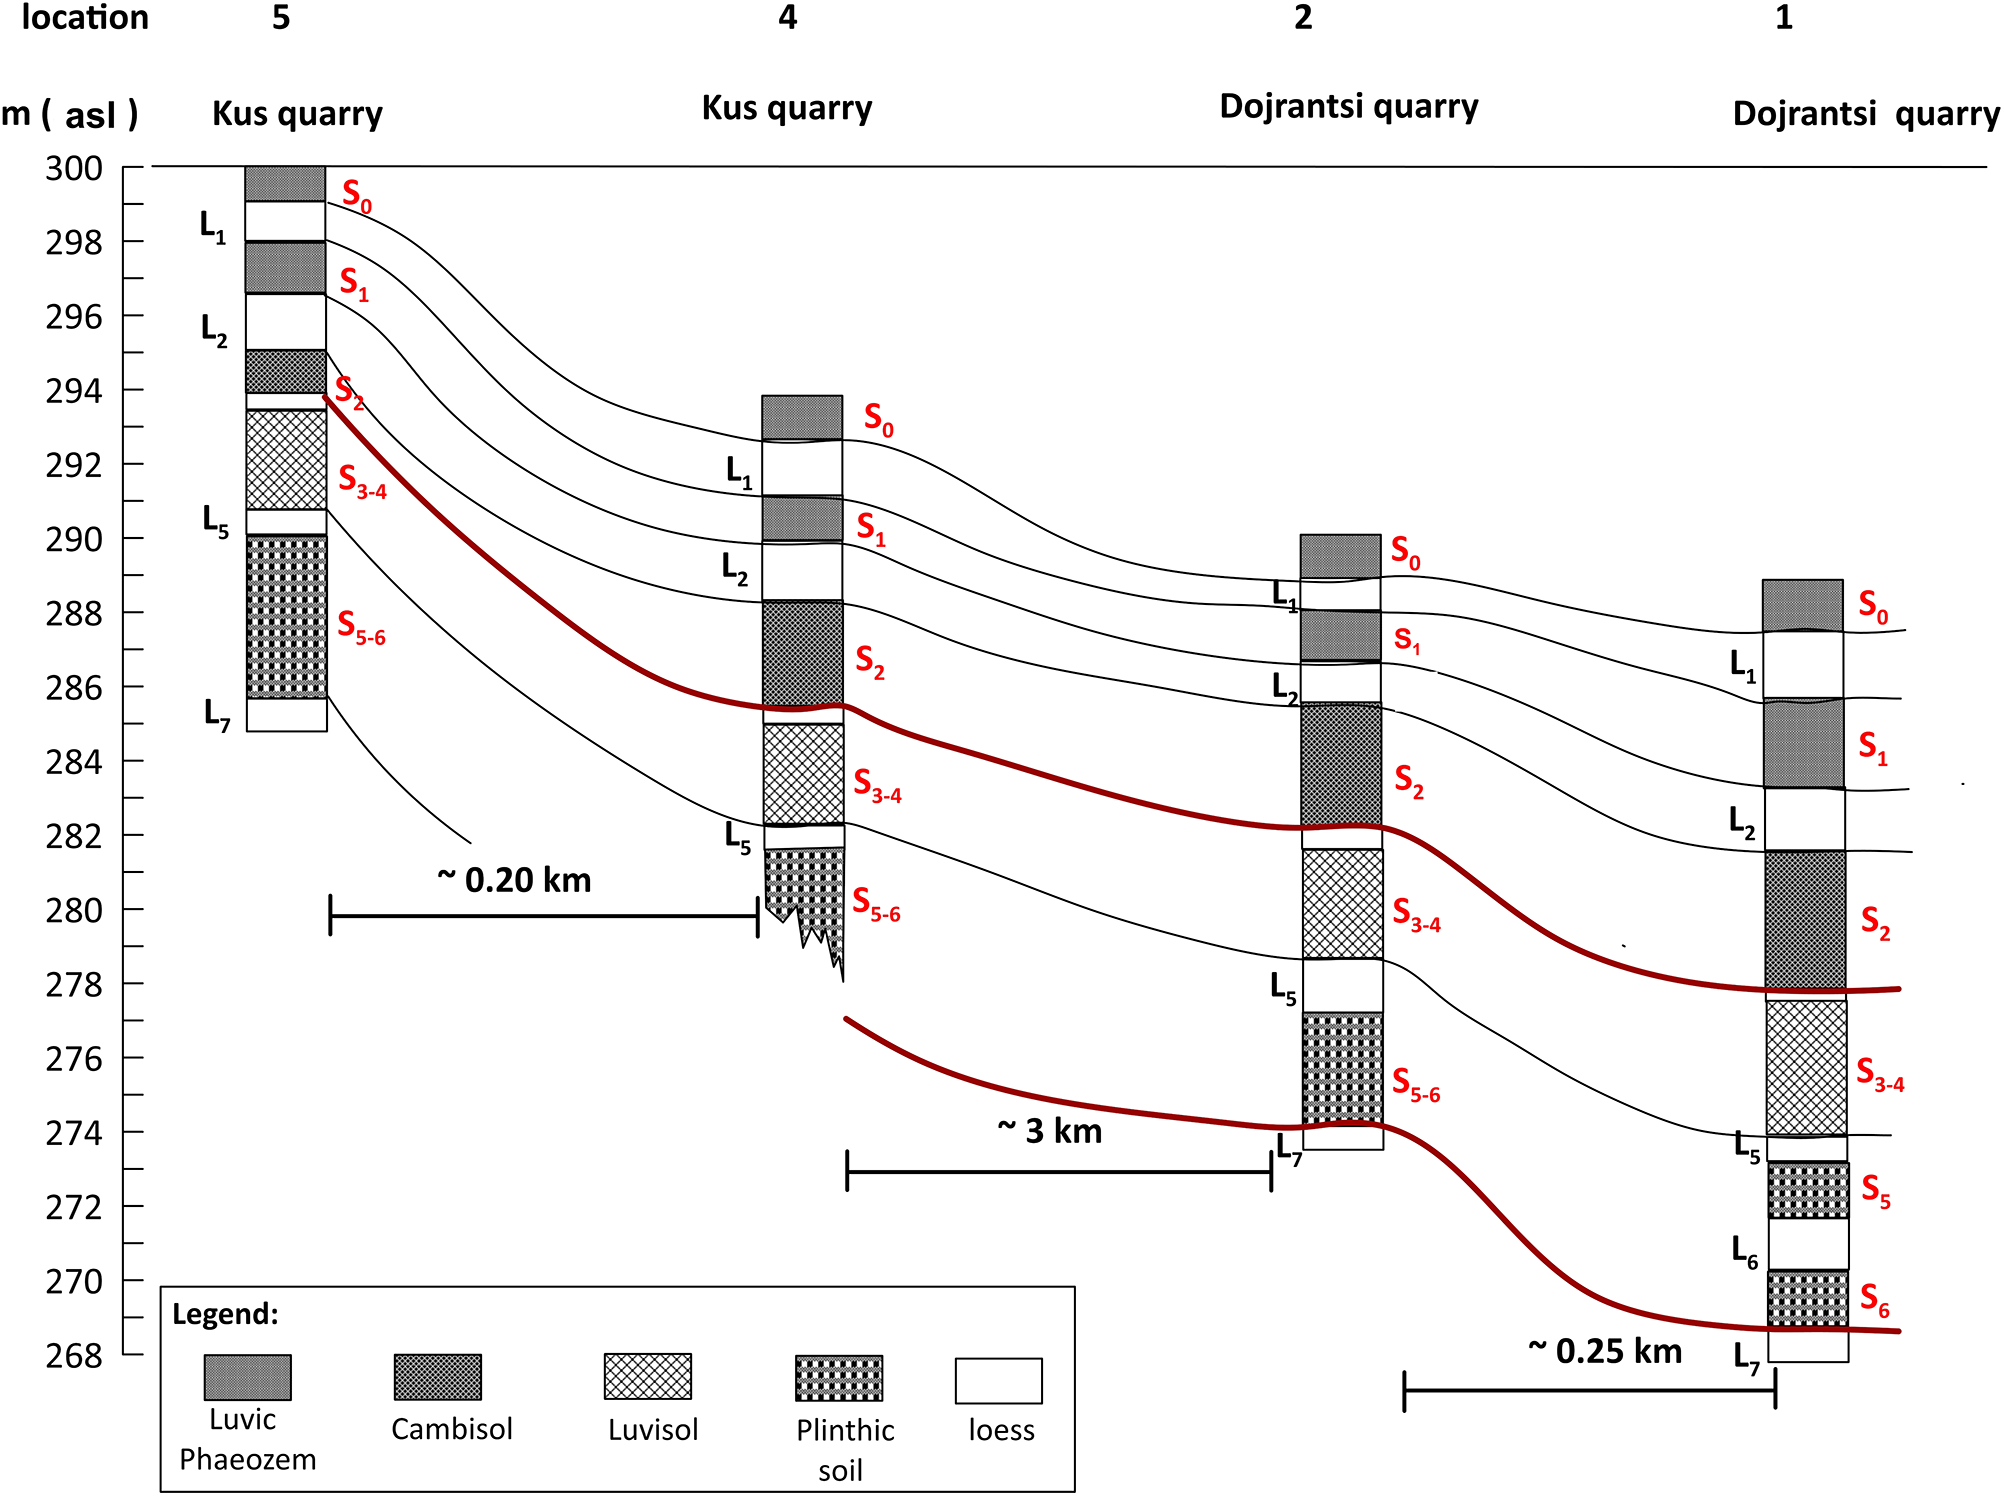
A summary of the stratigraphic units, their nomenclature, characteristics, and correlations to major MIS stages is presented in Table 1. Figure 3 shows the lithological columns of the studied profiles and their absolute altitudes at locations 1, 2, 4, and 5. Considering the landscape position of the four locations and their positions in the local relief, location 1 is characterized by the highest sedimentation rates, especially for the older part of the profile up to the second loess L2. Mineral magnetic and pedologic characteristics of the profile at location 2 are presented and discussed in Jordanova et al. (Reference Jordanova, Simon, Balescu, Jordanova, Ishlyamski, Georgieva, Bourlès, Duvivier and Cornu2022b). In the present study, only the record of mass specific magnetic susceptibility at location 2 is utilized again for presenting profile correlations at Kaolinovo area.
Description of the stratigraphic units, sampled at locations 1–5 and their presumed correlation with MIS stages according to Lisiecki and Raymo (Reference Lisiecki and M.E2005).

Stratigraphic columns of the loess paleosol sequences at locations 1–5. Solid lines delineate depth correlations of the loess (L) and paleosol (S) horizons.
Present day climate in the study area is characterized by mean annual temperature of 10.6°C with monthly maximum in July–August and monthly minimum in January–February. Mean annual precipitation is 589 mm, with maximum in May–June and minima in March and September. Vegetation cover is variable, including patchy forests, shrubs, and meadows. The combination of present day continental climate regime, forest/shrubs land cover, and undulating relief results in environmental conditions under which Luvic Phaeozems have developed.
Methods
Sampling was continuous with resolution of 5-cm intervals from locations 1 and 3, while 2-cm resolution was applied for locations 2, 4, and 5. Bulk susceptibility measurements were performed on all samples from locations 1, 2, 3, 4, and 5.
Powder material of about 300 g weight was air dried in the laboratory, gently crushed, and passed through a 2-mm sieve. Magnetic susceptibility of the bulk material was measured on MFK–1A susceptibility bridge (AGICO, Czech Republic) at 200 A/m field and two working frequencies: 976 Hz and 15616 Hz. The material was filled into standard 10 cm3 plastic cylinders. Low-field mass specific magnetic susceptibility (χ) was calculated using the sample weight and the measured susceptibility at the lower frequency. Frequency-dependent magnetic susceptibility χfd was calculated as a difference between the measured susceptibilities at low (χlf) and high (χhf) frequency of the kappa bridge. Percent frequency-dependent magnetic susceptibility was calculated as: χfd% = 100* (χlf−χhf)/χlf (Thompson and Oldfield, Reference Thompson and Oldfield1986). For direct comparison of the obtained values with the phenomenological model of Dearing et al. (Reference Dearing, Hay, Baban, Huddleston, Wellington and Loveland1996), correction of the obtained χfd% values for matching the frequency range of Bartington susceptibility meter was applied according to Hrouda (Reference Hrouda2011).
The following magnetic measurements and analyses were applied to samples from location 1 only and are discussed in the manuscript.
Laboratory magnetic remanences were imparted on 396 cubic samples with standard 2×2×2 cm size. The samples were prepared by mixing 2g of dry powdered material with gypsum and water and left to harden in plastic forms, which were subsequently removed.
Anhysteretic remanent magnetization (ARM) was imparted using a Molspin AF demagnetizer with a tumbling mechanism and ARM attachment employing a 100 mT maximum amplitude of the alternating field and a superimposed DC field of 0.1 mT. Isothermal remanent magnetizations (IRMs) in 2T forward and 100 mT back fields were acquired along the z-axis in IM-10-30 pulse magnetizer (ASC Scientific, USA). The magnetic remanences were measured on JR-6A automatic spinner magnetometer (AGICO, Czech Rep.) with a sensitivity of 2×10⁻⁶ A/m.
The basic magnetic measurements described above give useful and sensitive information on the concentration, changes in magnetic grain size distribution, and stability of iron oxides present in loess and paleosol samples. Table 2 briefly outlines their main significance in paleoenvironmental research.
List of the main magnetic parameters and ratios utilized in this study as proxies for changes in concentration, mineralogy, and effective magnetic grain size of the carriers of magnetic signal.

Stepwise thermal demagnetization of composite IRM was carried out for a representative set of 29 samples from different stratigraphic units at location 1. The samples were saturated in a DC field of 5 Tesla along the x-axis and subsequently re-magnetized along z-axis by a weaker DC field of 0.6 Tesla utilizing IM-10-30 pulse magnetizer (ASC Scientific, USA). In this way, two remanence components were defined: “soft,” acquired in a field of 0.6 T and “hard,” aligning magnetic moments in fields between 0.6 and 5 Tesla DC field. Thus, low-coercivity magnetic minerals of magnetite type as well as part of hematite grains with lower coercivities will contribute mostly to the “soft” component (Roberts et al., Reference Roberts, Zhao, Heslop, Abrajevitch, Chen, Hu, Jiang, Liu and Pillans2020), while high-coercivity antiferromagnetic minerals (single domain hematite, goethite) will be separated in the “hard” component (Lowrie, Reference Lowrie1990; Dunlop and Özdemir, Reference Dunlop and Özdemir1997; Roberts et al., Reference Roberts, Zhao, Heslop, Abrajevitch, Chen, Hu, Jiang, Liu and Pillans2020). Samples were demagnetized at 18 temperatures in a shielded furnace MMTD (Magnetic Measurements Ltd, UK) from room temperature up to 700°C. Unblocking temperatures of the two components indicate remanence-carrying minerals (Dunlop and Özdemir, Reference Dunlop and Özdemir1997).
Thermomagnetic analysis of magnetic susceptibility was carried out using a CS-23 furnace attached to KLY-2 Kappabridge (AGICO, Brno) for identification of magnetic mineralogy. A fast heating rate of 11°C/min and heating in air were applied. Possible bias of the obtained Tcs’ higher than magnetite’s Curie temperature of 580°C (Petersen and Bleil, Reference Petersen, Bleil, Beblo, Berktold, Bleil, Gebrande, Grauert, Haack and Haack1982; Petrovský and Kapička, Reference Petrovský and Kapička2006) may arise from this heating in air, resulting from laboratory oxidation of the originally present magnetite (Muxworthy et al., Reference Muxworthy, Turney, Qi, Baker, Perkins and Abdulkarim2023).
Magnetic hysteresis loops and back-field remanent magnetization measurements were carried out for 63 samples from the profile at location 1. Hysteresis loops were acquired up to a maximum applied field of 1 Tesla using VSM MicroMag 3900 instrument (Lake Shore Cryotronics, USA). Magnetic parameters coercive force (Bc), saturation magnetization (Ms), and saturation remanence (Mrs) were calculated after correction of the high-field portion of the loops for the paramagnetic component. Coercivity of remanence (Bcr) was determined from back-field remanence measurements.
Low-temperature magnetic measurements were carried out for characterization of iron oxides in concretions from loess unit L6 from location 1. Saturation isothermal remanence was acquired at room temperature in a field of 2.5T using Quantum Design XL-5 EverCool Magnetic Properties Measurement System (MPMS) at Institut de Physique du Globe de Paris (IPGP). The sample was cycled from 300 to 10 K and back to 300 K in zero field and remanence was measured at 5 K increments. Room temperature saturation isothermal remanent magnetization (RT-SIRM) experiments were performed as well. A 2.5-T field was applied at room temperature (RT), subsequently the sample was cycled from 300 to 10 K (cooling) and back to 300 K (warming) at a 5-K/min sweep rate in zero field and the remanent magnetization monitored at 5-K increments. Low-temperature (LT) SIRM after zero-field-cooled (ZFC) and field-cooled (FC) treatments from 300 to 10 K were imparted at 10 K. The ZFC and FC warming curves were acquired up to 300 K. Frequency-dependent magnetic susceptibility at low temperatures was monitored at three working frequencies: 10, 100, and 1000 Hz, with an applied field of 160 A/m.
The diffuse reflectance spectra (DRS) of 64 powdered samples from loess-paleosol profile at location 1 were measured using Cary 5000 UV-VIS-NIR spectrophotometer (Varian Inc., California, USA) equipped with a Polytetrafluoro-ethylene- (PTFE-) coated integrating sphere (Torrent and Barrón, Reference Torrent and Barrón2003, Reference Torrent, Barrón, Ulery and Drees2008). The spectra were acquired at intervals of 0.5 nm in the range of 380–2500 nm. The second derivative of the Kubelka–Munk remission functions (K–M functions) [(1−R)2/2R] (R is the reflectance) (Torrent and Barrón, Reference Torrent, Barrón and Somasundaran2002) were obtained using 3-points smoothing spline of the spectra. Goethite (Gt) presence was ascribed to the minima at around 424 nm, while hematite (Hm) was identified using minima at 535 nm on the second derivative K–M functions (Scheinost et al., Reference Scheinost, Chavernas, Barrón and Torrent1998). The band intensity was calculated as a difference between minimum and the subsequent maximum on the second derivative curves. In this way, relative amounts of Gt and Hm were estimated.
Dithionite (Fed) and oxalate (Feo) extractable iron were measured for 33 selected samples from the profile at location 1 using the protocols described in Mehra and Jackson (Reference Mehra and Jackson1960) and Schwertmann (Reference Schwertmann1964), respectively. Determinations of dithionite and oxalate extractable iron pools give important information on the amounts of free iron oxides in crystalline and amorphous forms, resulting from pedogenic transformations of the parent material (Parfitt and Childs, Reference Parfitt and Childs1988; Schwertmann, Reference Schwertmann, Stucki, Goodman and Schwertmann1988).
Results
Similarities and discrepancies in magnetic records among the studied locations
Depth variations of mass specific magnetic susceptibility (χ) along each of the studied profiles and their stratigraphic correlation are shown in Figure 4. The Holocene soil (S0), sampled at three locations (1, 2, and 4) exhibits persistent and uniform variability of χ with a maximum at a depth of ∼50 cm and smooth decrease towards the underlying first loess (L1). The maximum enhancements of magnetic susceptibility values in S0 for the three locations are remarkably similar: 60.2×10⁻⁸ m3/kg; 68.5×10⁻⁸ m3/kg, and 66.7×10⁻⁸ m3/kg. The signature with depth of the first loess is also identical, replicating even the weakest features and having minimum χ values between 36.3 and 40.2×10⁻⁸ m3/kg. Dotted lines in Figure 4 mark the isochrones in the records as well as the expression of a cryptotephra layer in the second loess L2, which serves as a time marker for stratigraphic correlations.
Depth variations of magnetic susceptibility along profiles sampled at locations 1–5 (see Figure 2a). Loess horizons are numbered as L, paleosol horizons indicated by S. Dashed lines represent spatial correlation of the loess and paleosol units sampled in different localities.

The next two loess–paleosol couplets (S1–L2 and S2–L3) have been studied in locations 1 and 2, which are exposed on the two opposite (N-facing and S-facing) vertical walls of Dojrantsi quarry. Although the localities are very close laterally (∼250 m), there are stronger dissimilarities in the observed thickness and magnetic enhancement for the couplets (S1–L2) and (S2–L3). Generally, the first paleosol S1 is ∼50 cm thicker at location 1, while the thickness of the loess L2 is similar (Fig. 4). In both locations, the presence of the cryptotephra layer in L2 is well visible as local maxima in χ at 560 cm and 430 cm depths at locations 1 and 2, respectively. However, its strength is higher at location 1. The lower lying couplet S2–L3 also has a similar signature, emphasizing the sampling gap at location 1, which occurred due to change from an upper to a lower step of the quarry walls. This gap most probably is not related to an existing hiatus in the stratigraphic record but rather to inaccuracy in depth translation during the fieldwork. Nevertheless, variations in magnetic susceptibility clearly suggest that S2–L3 loess–paleosol couplet is also thicker at location 1 as compared to location 2. Especially dissimilar is the behavior of magnetic susceptibility within the L3 loess thickness with stronger enhancement at location 1.
The following lower stratigraphic unit, represented by the pedocomplex S3–S4 and the underlying loess unit L5, shows the most striking differences at locations 1 and 2 (Fig. 4). At the same time, at laterally more distant locations (2, 3, and 4), the magnetic expression of this part of the record is highly consistent. The thickness of the couplet (∼300 cm) is similar in all locations. The most significant difference is observed in the magnetic enhancement at location 1 as compared to the rest of the sites. Obvious destruction of the strongly magnetic pedogenic minerals have led to a weakly magnetic signal for the S3–S4 pedocomplex, comparable with the magnetic susceptibility of the underlying loess L5. The observed heavy clayey texture, pale olive colors (5Y 6/3; Munsell Color, 2010)), and the occurrence of numerous Mn, Fe, and Ca coatings and concretions indicate the occurrence of persistent seasonal water saturation events. No distinct loess layer (L4) between the two paleosols (S3 and S4) was observed at all sites; only a laterally continuous layer of large hard CaCO3 concretions appeared in all records. The maximum magnetic enhancement in S3–S4 units is significantly lower than that of the younger S2 paleosol at all locations, reflecting the change in the soil type from a Chernozem-like soil for S0, S1, and S2 to a forest-type (Cambisols, Luvisols) soil (Buggle et al., Reference Buggle, Glaser, Zoller, Hambach, Marković, Glaser and Gerasimenko2008; Balescu et al., Reference Balescu, Jordanova, Brisson, Hardy, Huot and Lamothe2020).
The oldest part of the stratigraphic record in the area was sampled at locations 1 and 4. As seen in Figure 4, there is considerable difference in the stratigraphy at the two sites—clear separation between S5 and S6 paleosols with loess L6, having a thickness of 150 cm at location 1 and the presence of only a thick pedocomplex S5–S6 at location 4. If we consider the heavy clayey red bottom part of S5 as a marker horizon, it appears that at location 4 we observe a thicker upper part of S5 and a thinner red horizon. In addition, the main contrast is in the well- expressed magnetic enhancement of the S5 red unit at location 1 and the absence of such at location 4.
Magnetic mineralogy
The previous publication on magnetic and geochemical data for the Kaolinovo profile sampled in 2017/2019 (location 2 in this study) revealed that the main magnetic mineral phases along the sequence up to 12 m depth are magnetite, maghemite, and hematite in varying proportions (Jordanova et al., Reference Jordanova, Simon, Balescu, Jordanova, Ishlyamski, Georgieva, Bourlès, Duvivier and Cornu2022b). The identification of magnetic carriers in samples from the loess–paleosol profile at location 1 relies on data from the complementary magnetic and spectroscopic analyses. The results from laboratory stepwise thermal demagnetization of the composite isothermal remanence reveal the presence of several mineral components with different unblocking temperatures. The IRMsoft thermal demagnetization curves for all samples analyzed are characterized by a concave shape with smoothly decreasing amplitude up to the final Tub of 700°C. On the other hand, HIRM demagnetization curves suggest the presence of two mineral phases with high coecivities and unblocking temperatures at ∼120°C and 700°C (Supplementary Fig. 2S). The difference between the initial HIRM and the signal remaining after the 120°C temperature step is considered to be an approximation for the isothermal remanence carried by goethite (HIRM gt) as far as goethite Neel (unblocking) temperature is 120°C (Özdemir and Dunlop, Reference Özdemir and Dunlop1996).
Thermomagnetic analysis of magnetic susceptibility (Supplementary Fig. 3S) for the samples from different stratigraphic units of the profile from location 1 is dominated by thermal behavior of the strongly magnetic iron oxides that are present in the material. All samples show a smooth decrease of the signal in the temperature range 400–600°C. The sample from the first paleosol S1 (Supplementary Fig. 3Sa) is the only one characterized by a small bump on the heating curve between 320 and 400°C. The weakest signal is observed for the loess sample from unit L2 (Fig. 3Sb), which increases systematically up to 400°C, followed by a smooth decrease with final unblocking at 600°C. Weak alterations upon heating–cooling cycle are observed also for sample KaC 50 from strongly developed paleosol S5 (location 1) (Supplementary Fig. 3Sd, e). Only for the sample from L6 loess (Supplementary Fig. 3Sf) is a small signal remaining after 600°C, which is demagnetized at 700°C.
Detailed knowledge on the presence and relative contribution of antiferromagnetic weakly magnetic iron oxides is obtained from the analysis of DRS spectra. Representative examples of spectra typically obtained for loess and paleosol samples are given in Supplementary Figure 4S. Depth changes in the intensities of the goethite and hematite peaks, calculated from the 2nd derivative of the K–M function (Jiang et al., Reference Jiang, Liu, Roberts, Dekkers, Barrón, Torrent and Li2022) are shown in Supplementary Figure 5S along with the mass specific magnetic susceptibility and the intensity of HIRM magnetization assigned to goethite. All variables follow the stratigraphic sub-division between loess and paleosol horizons.
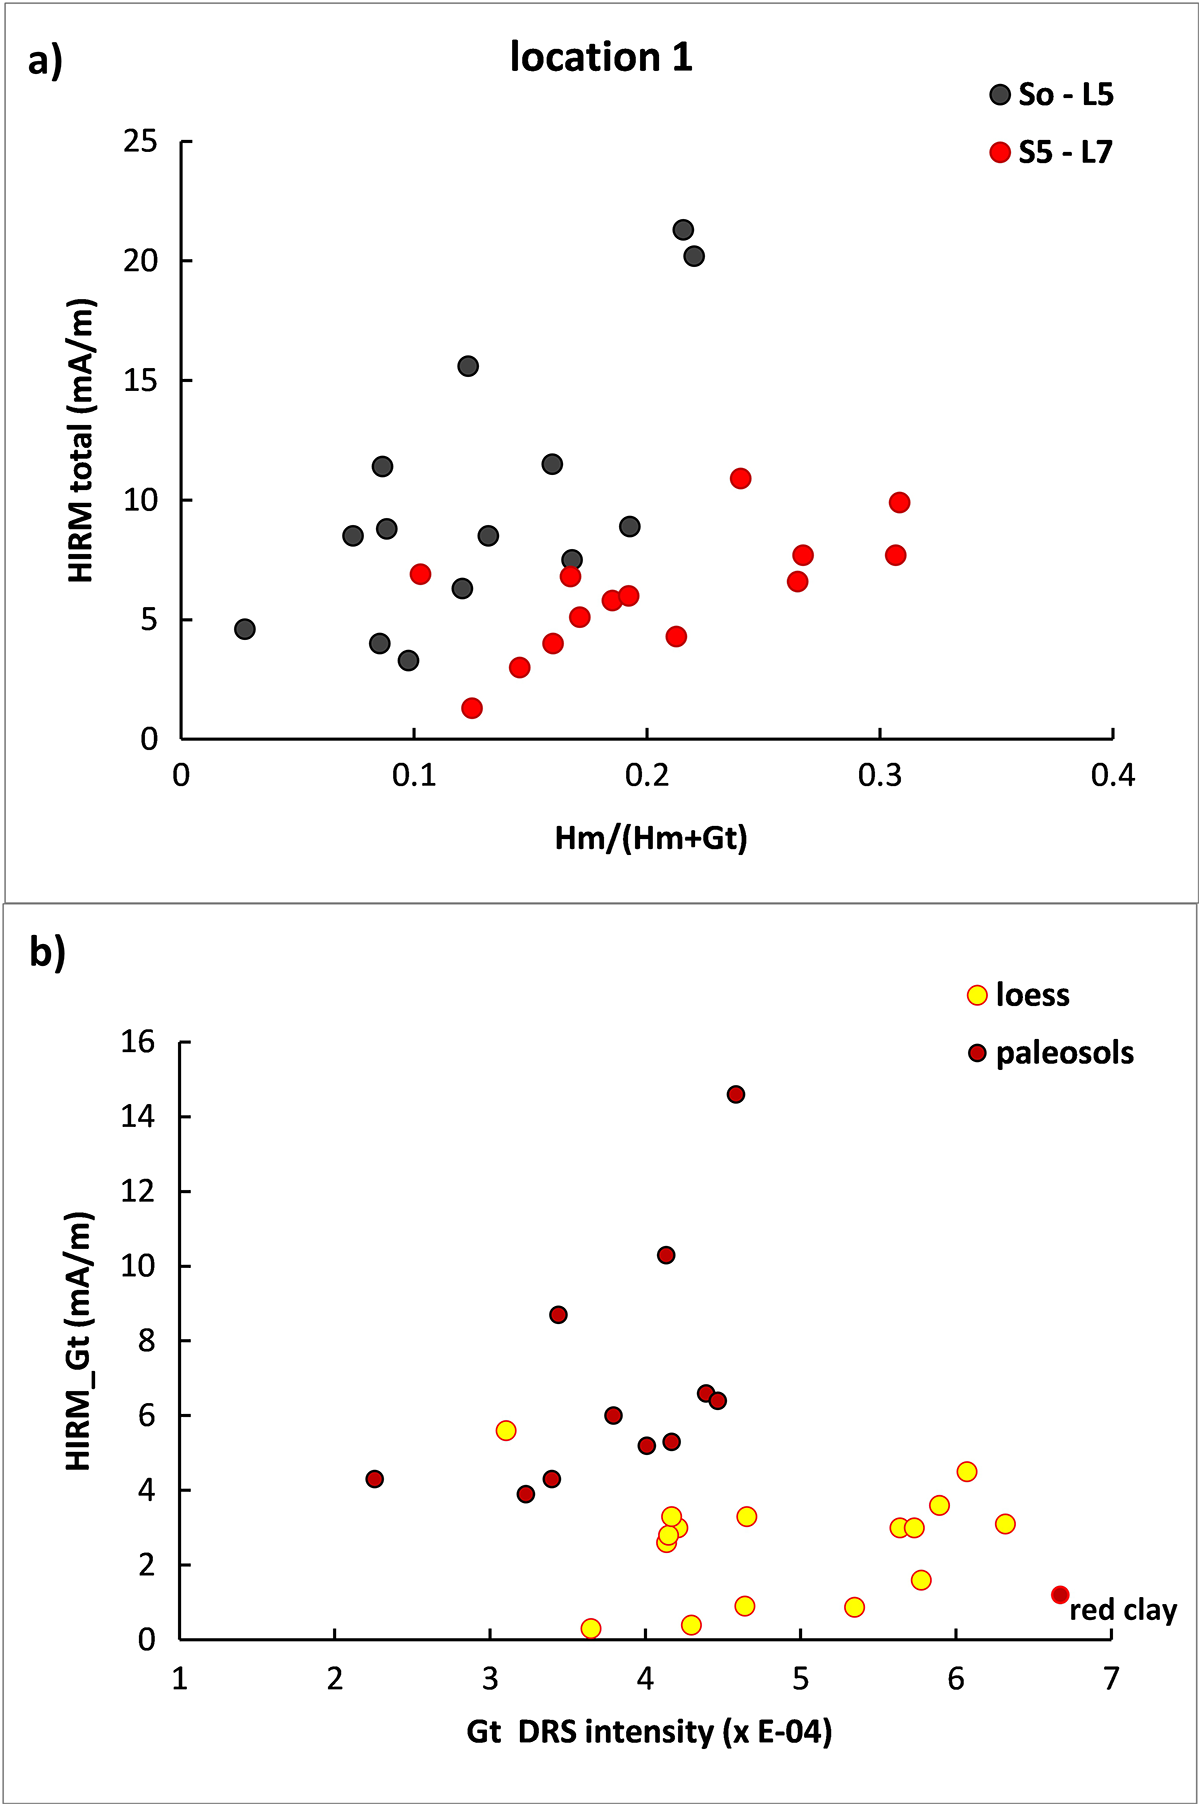
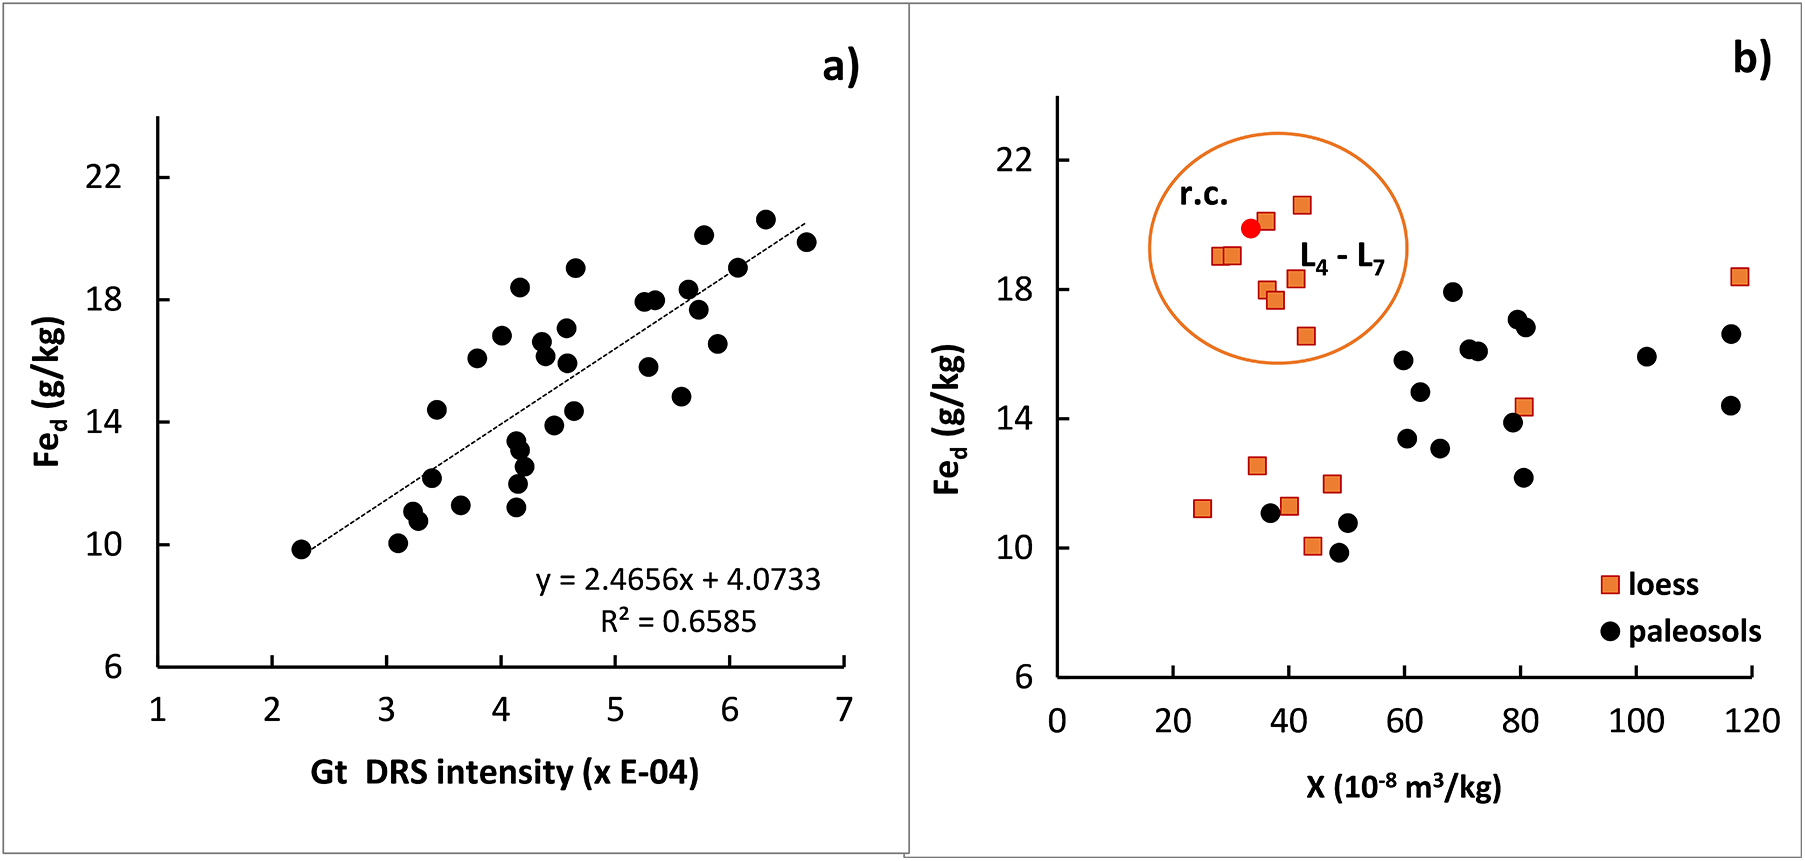
The high values of magnetic susceptibility in paleosol units are accompanied by high HIRM_Gt remanent magnetization and high DRS_Hmt intensity. In addition, DRS_Gt intensity is enhanced in the loess horizons, especially those from the older part of the sequence (L4–L7). The relationship between DRS_Gt intensities and the amount of HIRM_Gt is shown in Figure 5b. The strongest intensities of the goethite DRS band are obtained for samples from the loess layers, in particular older ones (L6, L7), which are accompanied by a very weak HIRM_Gt signal. The highest intensity of the Gt peak is observed in the sample from the red clays below the loess–paleosol complex. On the other hand, higher HIRM_Gt intensities and linear relationship between the two parameters are observed for the paleosol samples (Fig. 5a). The contrasting properties of hematite within the upper 13 m (S0 to L5 units) compared to the older part of the section (S5–L7) is shown in Figure 5a, where two different trends of the relationship between the intensity of the total HIRM and the relative content of hematite (Hm/(Hm+Gt)) are established. The dominant contribution of Gt to the amount of dithionite extractable iron pool is revealed by the significant correlation (R 2 = 0.576) between DRS_Gt intensity and Fed content (Fig. 6a). A similar relationship is valid for the crystalline iron pool (Fe_cryst = Fed − Feo).
(a) Relationship between the intensity of the Hard Isothermal Remanence (HIRM) and the ratio Hematite/(Hematite + Goethite) obtained from diffuse reflectance spectra (DRS) data for samples from location 1. (b) Relationship between HIRM, carried by goethite (HIRM_Gt), and the intensity of the goethite band from DRS.

(a) Bi-plot of the intensity of DRS band of goethite versus content of dithionite extractable iron (Fed). (b) Fed versus magnetic susceptibility.

On the contrary, no correlation between Fed content and DRS_Hmt intensity or Hm/(Hmt+Gt) ratio is found. A weak relationship between Fed content and magnetic susceptibility of paleosol samples is observed, while the highest Fed amounts are characteristic for the samples from the older loess horizons (L4–L7) with lower susceptibilities (Fig. 6b). Inspection of the bulk material from loess L6, characterized by strong Gt intensity and one of the highest Fed contents measured, revealed the presence of large mm-sized concretions (Supplementary Fig. 6S). The particular concretion shown in Supplementary Figure 6S was extracted from sample KaF 50, corresponding to depth of 15.7 m in the loess unit L6.
Phase identification of the main mineral magnetic carrier in the concretion was obtained by low-temperature magnetic measurements (Fig. 7). The FC–ZFC experiment showed a typical slightly concave shape of the FC curve with six-fold higher intensity of the remanence as compared to ZFC curve (Fig. 7a). Overlapping of the cooling and heating curves between 300K and 10K of room temperature SIRM, acquired in 2.5T field is also observed (Fig. 7b). The in-phase susceptibility (χ’) decreases smoothly without indications of thermal unblocking of SP grains (Fig. 7c).
Low temperature magnetic analyses of big concretion from loess unit L6 at location 1. (a) FC–ZFC (field-cooled–zero-field-cooled) curves; (b) zero field cooling–heating of room temperature (RT) saturation isothermal remanent magnetization (SIRM); (c) variations of in-phase magnetic susceptibility measured at three frequencies during heating from 5 to 300 K. In-phase susceptibility measured using an Alternating current (AC) and field strength (h) of 1 Oersted.

Changes in relative abundance, crystallinity, and effective magnetic grain size of iron oxides
A number of magnetic parameters and ratios (such as frequency-dependent magnetic susceptibility; hysteresis parameters as coercive force Bc; coercivity of remanence Bcr; ratios Mr/Ms, Bcr/Bc; S-ratio, ARM/IRM100mT; SIRM/χ, and others) are sensitive indicators of the changes in effective magnetic grain size and relative abundance of different co-existing iron oxides in natural materials (Dunlop and Özdemir, Reference Dunlop and Özdemir1997; Liu et al., Reference Liu, Roberts, Larrasoaña, Banerjee, Guyodo, Tauxe and Oldfield2012). Strongly magnetic magnetite and oxidized magnetite, evident from thermal demagnetization experiments of remanences and magnetic susceptibility, are major contributors to absolute values and variabilities of χfd% and ARM/IRM100mT (Thompson and Oldfield, Reference Thompson and Oldfield1986). Figure 8a depicts the relationship between these two parameters in different lithological units of the LPS at location 1. The loess and paleosol samples from the upper 9 m of the profile (encompassing S0, L1, S1, L2, and S2 horizons) define a linear relationship with relatively low values of the ratio ARM/IRM100mT. A systematic increase of ARM/IRM100mT and χfd% is observed in progressively older loess and paleosol units (Fig. 8a). The roles of weakly magnetic hematite and goethite in the total magnetic signature were explored utilizing the relationship between coercive force (Bc) and the intensity of the hematite peak on 2nd derivative of K–M functions (Fig. 8b). A systematic decrease of Bc is observed with increasing intensity of the Hmt band. However, different slopes of the relationship between frequency-dependent susceptibility χfd and the intensity of Hmt band (Fig. 8c) are obtained for the younger (S0–L5) and the older (S5–L7 plus red clay) parts of the profile at location 1. As seen in Supplementary Figure 5S, Gt band intensity has maxima mostly in the loess horizons.
(a) Bi-plot of the ratio of anhysteretic remanent magnetization (ARM) to isothermal remanence acquired in 100mT field (IRM100mT) versus percent frequency-dependent magnetic susceptibility (χfd%). (b) Hematite (Hmt) diffuse reflectance spectra (DRS) band intensity versus coercive force (Bc) for samples from location 1. (c) Hematite DRS band intensity versus frequency-dependent magnetic susceptibility (χfd).

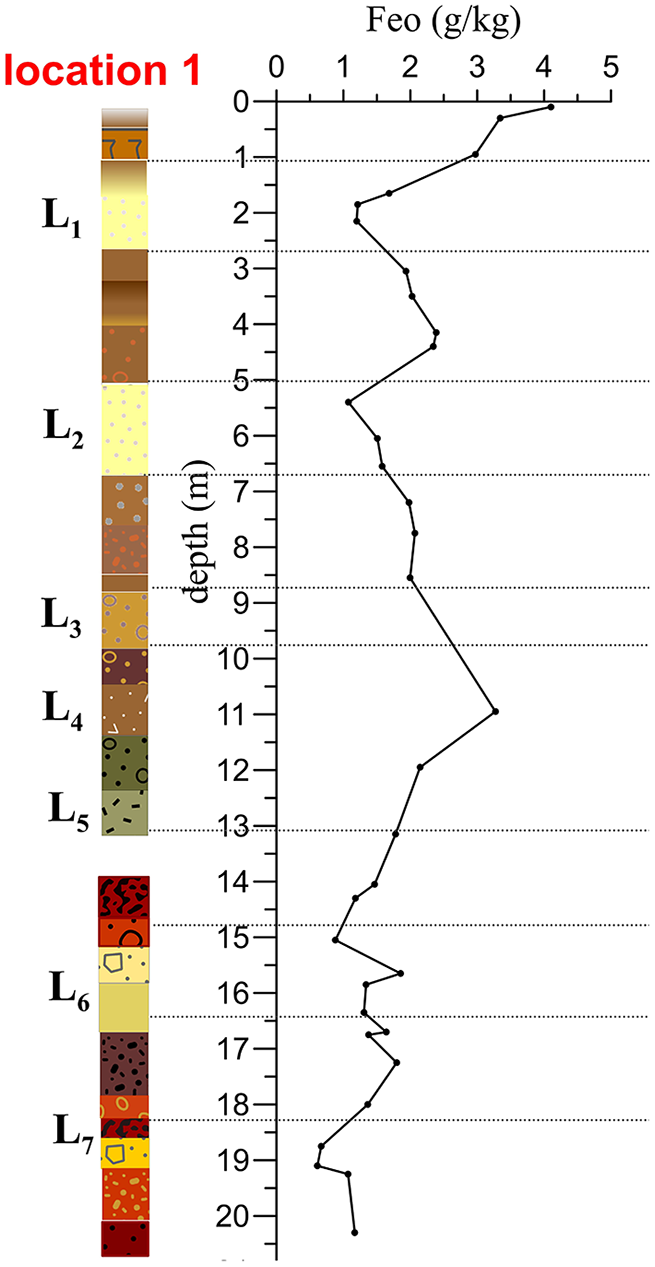
The amount of oxalate–extractable iron (Feo) is another important marker for the occurrence and fate of amorphous and weakly crystalline Fe-containing phases (Parfitt and Childs, Reference Parfitt and Childs1988; Cornell and Schwertmann, Reference Cornell and Schwertmann2003; Rennert et al., Reference Rennert, Dietel, Heilek, Dohrmann and Mansfeldt2021). Figure 9 presents depth variations of the content of Feo. Except for commonly observed higher values in the Holocene soil, the local well-expressed maximum is obtained at a depth of 11 m, corresponding to the levels severely affected by seasonal water logging and weak magnetic enhancement at location 1.
Depth variations of the content of oxalate extractable iron (Feo) along depth of the loess–paleosol profile at location 1.

Discussion
Paleo-landscape inheritance and loess sedimentation
The presence of several adjacent loess–paleosol profiles from the loess complex near Kaolinovo (NE Bulgaria) offers a good opportunity to explore and discriminate the roles of local and regional factors on variations in stratigraphy, mineralogy of iron oxides, and formation of the magnetic signal. The primary role of the original topography of the paleo-surface, on which aeolian sedimentation took place during glacial periods (Xiong and Tang, Reference Xiong and Tang2019), is clearly outlined in our stratigraphic records. Particularly helpful is the available vertical cross section of the kaolinitic deposits at Dojrantsi quarry (Tonov et al., Reference Tonov, Vangelova and Vangelov2016) (Fig. 2c) where the overlying loess complex at locations 1 and 2 was sampled (Fig. 2a, b). The position of location 1 corresponds to the most negative point of the paleosurface next to the rising topography of the limestone uplift and is inherited by all of the younger sedimentary units above (Fig. 2c). Thus, at the quarry scale, the thickest loess complex is preserved at this point. Visual field inspection confirmed this consideration, leading to the choice of location 1 for the first sampling campaign.
Variations of magnetic susceptibility with depth (Fig. 4) clearly outline the presence of thicker paleosols S1 and S2 at location 1 with a clear high rate of colluvial sedimentation at the base of the S2 paleosol. An enhanced accumulation of colluvium may be triggered by intensified rains during the initial amelioration of the climate of interglacial stages, which washed out unconsolidated material from the still bare uphill positions (Pye, Reference Pye1995; Xiong and Tang, Reference Xiong and Tang2019). The location of the sampled profiles in the present day relief (Fig. 2b) supports such a supposition because location 1 in particular is situated in a local depression defined by the hilly area to the south and the local rise of the paleorelief from the west (Fig. 2b). Strong depletion of the magnetic susceptibility in S3–S4 pedocomplex at location 1 is further evidence that this local depression was occupied by seasonal stagnant water during the period of pedocomplex formation (e.g., MIS 9–11; see Table 1). Moreover, depletion of strongly magnetic pedogenic iron oxides suggests that such conditions may have caused preferential formation of goethite and/or lepidocrocite (Cornell and Schwertmann, Reference Cornell and Schwertmann2003) at the expense of magnetite/maghemite. High amounts of dithionite extractable iron (Fed) in this part of the profile together with high intensity of DRS_Gt peaks (Fig. 6a) discard the possibility of destruction of Fe oxides and the removal of dissolved iron from the profile.
The oldest part of the loess–paleosol complex (S5, L6, S6, L7) was sampled only in locations 1 and 5 (Fig. 2a, b). The presence of well-developed and strong magnetic enhancement of paleosols S5 and S6 at location 1 diverge from the observed pedocomplex S5–S6 at location 5 with a weakly enhanced S5 paleosol. Additionally, the thickness of this lower part of the LPS at location 1 is ∼ 6 m and only ∼4 m at location 5. Considering the position of the sampled locations in the landscape (Figs. 2b, 3), location 5 is characterized by the highest present day elevation. The main wind direction in NE Bulgaria is from NNE, transporting dust particles from the source area (Danube alluvium) to the site (Evlogiev, Reference Evlogiev2007). However, the elevated terrain south from the sampling locations (Fig. 2b) can be considered a topographic barrier, against which enhanced dust sedimentation occurred (Pye, Reference Pye1995; Goossens, Reference Goossens2006). Thus, higher elevation sites will be characterized by relatively lower dust sedimentation, but at a landscape scale wind erosion is most significant at higher-elevation geomorphological positions (Zhou et al., Reference Zhou, Zhang, Zou, Zhang and Zhang2020). As seen in Figure 4, very low or absent sedimentation at location 5 is typical for the period of L6 formation (e.g., glacial period MIS 18; Table 1). As a result, the oldest paleosols S5 and S6 form a pedocomplex, in which non-weathered L6 is missing (Fig. 4). In contrast, at location 1, which has a lower elevation, the sixth loess is preserved as a separate 120-cm-thick unit.
This high variability in stratigraphy of the oldest deposits may be linked to the persistence of moist and warm climate conditions in Eurasia during the glacial MIS 18 (Sánchez Goñi et al., Reference Sánchez Goñi, Extier, Polanco-Martínez, Zorzi, Rodrigues and Bahr2023). Observed differences in the thicknesses of different horizons (loess and paleosols) among the studied locations occur within an absolute altitudinal interval of 10 m at the present-day relief but increase up to ∼20 m for the oldest units (Fig. 3). The most divergent thickness is observed for S2 paleosol, which developed during MIS 7. The interglacial corresponding to MIS 7 is characterized by weaker interglacial conditions as compared to the younger or older interglacials after the Mid-Brunhes event (Past Interglacials Working Group of PAGES, 2016).
Depth variations of magnetic susceptibility for the sampled locations near Kaolinovo (Fig. 4) allow straightforward correlation among the profiles, based on the following stratigraphic markers: (1) presence of the well-expressed peak corresponding to the cryptotephra layer in the second loess L2, recently dated at 159 ka (Fernandez et al., Reference Fernandez, Giaccio, Costa, Monaco, Nomade, Albert and Pereira2024; Jordanova and Jordanova, Reference Jordanova and Jordanova2024); (2) regionally consistent presence of an incipient paleosol (Buggle et al., Reference Buggle, Hambach, Glaser, Gerasimenko, Marković, Glaser and Zoller2009; Marković et al., Reference Marković, Stevens, Kukla, Hambach, Fitzsimmons, Gibbard and Buggle2015) on the top of the second paleosol S2, which is commonly identified as systematically enhanced in magnetic susceptibility curves; and (3) strongly reproducible and characteristic behavior of magnetic susceptibility in the S3–S4 pedocomplex, which is characterized by remarkably consistent thickness of 250 cm in all locations near Kaolinovo except where local dissolution of pedogenic oxides due to stagnant water in the profile occurs (Fig. 4). This is partly due to the absence of significant neotectonic activity in the area, which may cause vertical movements and active erosion as shown in case of the Paks area (Novothny et al., Reference Novothny, Barta, Végh, Bradak, Surányi and Horváth2020).
Paleoenvironmental implications of changes in magnetic properties
Magnetic mineralogy
Magnetic enhancement in the paleosol horizons, which is a typical property for well-drained soils (Maher, Reference Maher1998), is widely utilized for establishment of detailed correlations between LPS among laterally distant locations (Marković et al., Reference Marković, Stevens, Kukla, Hambach, Fitzsimmons, Gibbard and Buggle2015; Maher, Reference Maher2016). This enhancement is explicitly outlined in the variations of magnetic susceptibility (χ) along the studied profiles (Fig. 4). The observed unblocking temperatures on both χ(T) and stepwise thermal demagnetization of IRMsoft (Supplementary Figs. 2S, 3S) in the range 580–600°C demonstrate the dominance of magnetite and/or oxidized magnetite (Dunlop and Özdemir, Reference Dunlop and Özdemir1997) as a major carrier of the magnetic signal in the studied loess–paleosol sequences.
The presence of thermally unstable maghemite, which converts to weakly magnetic hematite (Gendler et al., Reference Gendler, Shcherbakov, Dekkers, Gapeev, Gribov and McClelland2005) during laboratory heating, is evinced only in the sample from the first paleosol S1 (Supplementary Fig. 3Sa) accompanied by 4-fold increase in susceptibility at room temperature on cooling. This suggests that newly created hematite is reduced to magnetite at temperatures higher than 600°C as a result of organic matter combustion (Hanesch et al., Reference Hanesch, Stanjek and Petersen2006) or interactions between hematite and chlorite clay minerals (Zhang et al., Reference Zhang, Paterson and Liu2012). It should be kept in mind, however, that laboratory heating in air during thermomagnetic analysis of magnetic susceptibility may hamper this effect for older paleosol samples, for which organic matter content gradually decomposes with time (Galluzzi et al., Reference Galluzzi, Plaza, Priori, Giannetta and Zaccone2024). Another possibility is that pedogenically synthesized maghemite has a certain amount of Al substitutions, which generally stabilize its thermal behavior (da Costa et al., Reference da Costa, Laurent, de Grave, Vandenberghe, Dyar, McCammon and Schaefer1996). Considering the observed final thermal demagnetization of the IRM600mT remanence at 620°C for some of the samples (Supplementary Fig. 2Sd, f) except the observed hematite Neel temperature of 680°C, such a possibility is not excluded.
High-coercivity iron oxides such as goethite and hematite are ubiquitous in sedimentary environments (Roberts et al., Reference Roberts, Zhao, Heslop, Abrajevitch, Chen, Hu, Jiang, Liu and Pillans2020) and represent important environmental markers in loess–paleosol research (Ji et al., Reference Ji, Balsam, Chen and Liu2002; Torrent et al., Reference Torrent, Liu, Bloemendal and Barrón2007). However, they are weakly magnetic and their identification and quantification by the use of magnetic measurements is hampered (Jiang et al., Reference Jiang, Liu, Roberts, Dekkers, Barrón, Torrent and Li2022). For that purpose, complementary data on the amounts of fine-grained hematite and goethite deduced from analysis of the DRS spectra give valuable insights into the relative variations in the total amounts of both iron oxyhydroxides throughout the depth of the profile at location 1. The obtained higher intensities of the HIRM remanences together with maxima in the intensities of the hematite band from DRS analyses in paleosol horizons and lower values in the loess units (Fig. 5S) suggest that soil formation is accompanied by increased production of hematite as well. The capability of this hematite to carry magnetic remanence differs for the upper and lower parts of the profile—higher HIRMs are typical for units So–L5, while lower HIRMs at higher relative contributions of hematite characterize older deposits (S5–L7; Fig. 5a). Non-overlapping distributions for the two groups (Fig. 5a), even for the samples from loess horizons, support a hypothesis for a changing source of the primary aeolian dust, which has different mineralogical composition (e.g., varying hematite and goethite, both contributing to HIRMtotal content).
Figure 5b shows that the intensity of goethite DRS band (I424) for loess samples from older part of the section (L4–L7) is higher than that for all paleosols, while the remanence-carrying (HIRM) fraction increases in paleosols. This relationship suggests that pedogenic goethite in paleosol horizons is saturated in the applied maximum DC field of 5 Tesla, while the prevailing part of goethite in loess horizons (as deduced from DRS spectra) does not contribute to HIRM remanence. One possible reason for this observation is that the goethite fractions in the loess horizons possess higher coercivity, thus they are not saturated in the maximum applied field of 5T (Rochette and Fillion, Reference Rochette and Fillion1989). Such a supposition is in line with the observed linear relationship between the amount of dithionite extractable iron Fed and the intensity of Gt_DRS band (Fig. 6a). A similar relationship is neither seen between Hmt_DRS intensity and Fe_d, nor for Gt_DRS–Feo.
Consequently, the major mineral contributing to Fed is goethite. Systematically higher intensities of Gt_DRS band as compared to Hmt (generally about one order of magnitude) suggest that goethite dominates in the total amount of Fe (oxy)hydroxides in the studied collection. The non-trivial question about the origin of this goethite being either primary (detrital) or secondary needs special consideration.
As seen in Figure 6b, except for the well-defined group of loess samples from the older portion of the profile with high Fed content, the rest of the loess and paleosol samples show increasing Fed with increasing χ. Due to the very weak magnetic signal (magnetic susceptibility and remanence) of goethites (Dekkers, Reference Dekkers1989; Dunlop and Özdemir, Reference Dunlop and Özdemir1997), the observed relationship may be due to: (1) contribution from pedogenic (fine-grained) hematite, and (2) dissolution of non-pedogenic (e.g., detrital) iron oxides due to the major role of grain size on the effectiveness of the DCB-extraction method (Yang et al., Reference Yang, Li, Han, Wang, Zhao, Yi and Lu2022).
The presence of goethite in concretions (Supplementary Fig. 6S) in loess horizon L6 is evinced by the low-temperature magnetic measurements (Fig. 7). The intense alterations of the sixth loess horizon L6 at Kaolinovo are confirmed by the reported high values of the CIA weathering index, reaching 83.5 (Jordanova and Jordanova, Reference Jordanova and Jordanova2024), which are comparable with CIA values typical for paleosols. Thus, goethite content in weathered loess horizons, which is characterized by strong DRS-Gt intensities but weak HIRM_Gt remanent magnetization, originates not only from primary lithogenic input but also has a component of secondary origin that is related to the formation of nodules.
The observed relative intensities and concave shapes of the FC–ZFC curves suggest that the goethite is present as micron-sized crystals without Al substitutions (Liu et al., Reference Liu, Yu, Torrent, Roberts, Pan and Zhu2006). Comparison of the magnetizations at 5K for the studied concretion with published data from Guyodo et al. (Reference Guyodo, Mostrom, Penn and Banerjee2003) on synthetic needle-shaped micro-goethites with length of 350 nm shows very similar values. This suggests that goethite is not only present as a film on quartz (or other sand-sized) grains, but also built up the entire volume.
Goethite and carbonate concretions in soil profiles are typical features of changing hydromorphic conditions and ground water table fluctuations during warm sub-tropical climate (Zhao et al., Reference Zhao, Ma, Lui, Luo and Shao2018; Sipos et al., Reference Sipos, Kovács, Tóth, Németh and Demény2025). The depth at which goethitic concretions were found (15.35 m) is about 150 cm below the transition from L6 to the upper paleosol S6 (Fig. 4). This suggests intense processes of leaching and strong vertical migration of leached iron in the soil solution (i.e.. high values of annual precipitation). However, most of the paleoclimate proxy records suggest that interglacial conditions during MIS 15 were relatively mild (Past Interglacials Working Group of PAGES, 2016). An alternative hypothesis is that goethitic concretions formed during moist interstadials representing millennial climate variability within the glacial stage MIS 16 (Hodell et al., Reference Hodell, Crowhurst, Lourens, Margari, Nicolson, Rolfe and Skinner2023).
Origin and environmental implications of the variations in the type and concentration of iron oxides
Fine-grained superparamagnetic (SP) particles of magnetite and/or maghemite make the biggest contributions to the bulk χ values, which are revealed by the obtained high χfd% values (8–12%) in the pedogenized units (Fig. 8a). According to the phenomenological model of Dearing et al. (Reference Dearing, Hay, Baban, Huddleston, Wellington and Loveland1996), such values suggest that more than 70% of the grains contributing to χ are in the SP domain state. The magnetic ratio ARM/IRM100mT is the remanence-based parameter, which is sensitive to the presence of stable SD grains (Geiss et al., Reference Geiss, Egli and Zanner2008). The observed different relationships, defined by samples from different stratigraphic units on the bi-plot of χfd% versus ARM/IRM100mT (Fig. 8a) suggest changing mineralogy and grain size of the parent loess material or changing paths of pedogenic magnetic enhancement.
The upper 9 m of the profile, consisting of the first three loess–paleosol couplets (S0–L1; S1–L2; S2–L3) follow a single trend, characterized by linear increase of ARM/IRM100mT up to values of 0.12 with increasing χfd%. The calculated regression does not plot through the origin, so that at χfd% = 0, non-zero value of the ratio ARM/IRM100mT is obtained. This finding suggests that in the absence of pedogenic transformation, reflected by zero χfd%, there is still non-zero contribution from stable SD grains, contributing to ARM/IRM100mT. Consequently, one plausible hypothesis is to suppose that there is a fraction of fine-grained detrital magnetites, which contribute to ARM intensity.
Considering that SD grain-size range for magnetite particles is constrained between about 30 nm and 70 nm (Maher, Reference Maher1988), the non-zero contribution from the fine-grained aeolian fraction, brought by long distance transport from Fennoscandian ice sheet and/or Sahara dust, can be proposed (Stuut et al., Reference Stuut, Smalley and O’Hara-Dhand2009; Obreht et al., Reference Obreht, Hambach, Veres, Zeeden, Bösken, Klasen and Brill2017). Experimental data for the older couplets (S3–S4–L5) define a linear trend with a completely different slope passing through the origin (Fig. 8a). This behavior suggests absence of a fine-grained (long-distance) detrital fraction and a purely pedogenic origin of the superparamagnetic (SP) and larger SD magnetic carriers in these units. The values of the ratio ARM/IRM100mT vary from 0.1 to 0.18, thus being systematically higher as compared with those for the younger part of the profile, while χfd% changes between 6 and 8%. Consequently, in terms of effective magnetic grain sizes, pedogenic fraction in S3–S4 pedocomplex is dominated by more SD-like carriers.
Data for older paleosols (S5 and S6) do not follow a linear relationship but rather group around the highest values of ARM/IRM100mT and χfd% obtained for paleosols, except for the red clays unit (Fig. 8a). This implies that the content of larger SD/vortex grains dominate in mature paleosols, formed under warmer conditions, and favor growth from SP to larger SD sizes of the pedogenic magnetites (maghemites) (Long et al., Reference Long, Ji and Balsam2011). Consequently, the climate of older interglacials favored pedogenic production of higher amounts of SD strongly magnetic iron oxides.
This result is in line with similar studies showing that soil magnetic enhancement is not restricted only to the superparamagnetic fraction, but extends to larger viscous, SD and even PSD magnetic grain sizes (Liu et al., Reference Liu, Roberts, Larrasoaña, Banerjee, Guyodo, Tauxe and Oldfield2012). In fact, this variability results from the observed strong sensitivity of the grain size of pedogenic iron oxides (either produced inorganically or biologically mediated) on a number of factors, including availability of Fe2+ in solution; reaction temperature; and foreign ions such as Al3+ (Taylor et al., Reference Taylor, Maher and Self1987; Cornell and Schwertmann, Reference Cornell and Schwertmann2003; Melton et al., Reference Melton, Swanner, Behrens, Schmidt and Kappler2014). Under increased temperatures, effective growth of the pedogenic strongly magnetic magnetite/maghemite from SP to SD (Liu et al., Reference Liu, Barrón, Torrent, Eeckhout and Deng2008; Long et al., Reference Long, Ji, Balsam, Barron and Torrent2015; Yang and Jia, Reference Yang and Jia2021) sizes may also explain the strong increase in ARM/IRM100mT ratio in the older part of the loess–paleosol sequence and the red clays below (Fig. 8a).
Along with these observations for younger loess–paleosol horizons, the oldest paleosols S5 and S6 contain systematically higher amounts of hematite (Fig. 8c). According to the results presented in Figure 5a, this hematite does not carry remanence (as far as HIRM values are systematically lower than that for the younger part of the profile). Field observations point to Plinthic characteristics of S5 and S6 paleosols (Table 1), which may suggest that further transformation of pedogenic maghemites to hematite occurred under warmer paleoclimates during MIS 13–15 and MIS 17–19 long interglacials.
On the contrary, the older part of the profile is characterized by similar χfd%, but at the same time shows permanently higher ARM/IRM100mT values. This ratio is at a maximum in the levels with enhanced content of stable SD grains, which most efficiently acquire an anhysteretic remanent magnetization (ARM) (Maher, Reference Maher1988). The pedogenic origin of fine-grained hematite, which causes the intense reddening of paleosols in the loess–paleosol sequences (Deaton and Balsam, Reference Deaton and Balsam1991; Balsam et al., Reference Balsam, Ji and Chen2004; Torrent et al., Reference Torrent, Liu, Bloemendal and Barrón2007) is further revealed in our data by the consistent relationships between the intensity of hematite DRS band and coercive force (Bc) (Fig. 8b) as well as frequency-dependent susceptibility χfd (Fig. 8c). The lowest Bc values are found in the paleosol horizons, where intensity of Hmt peaks are the highest due to the SP domain state of the pedogenic hematites or, alternatively, to the dominant role of soft magnetic minerals on the coercivity of the mixture (Frank and Nowaczyk, Reference Frank and Nowaczyk2008). Increased amounts of hematite are identified in the paleosol horizons, which are also enriched with SP pedogenic magnetites/maghemites (giving rise to χfd) (Fig. 7d) especially for older parts of the profile. The increased content of pedogenic hematite along with high content of SD magnetites/maghemites in the lower part of Kaolinovo profile indicate that most probably the finest-grained SP pedogenic fraction was oxidized to hematite in a warmer climate. The study of Long et al. (Reference Long, Ji, Balsam, Barron and Torrent2015) describes similar climate-driven changes in grain size and mineralogy of pedogenic magnetic fraction in red Ferralsols.
The increasing content of hematite in paleosols S5 and S6 (Figs. 8c, 2S) suggests that older interglacials were characterized by warmer climates. Similar results are reported for the loess–paleosol profiles from Stari Slankamen (Serbia) and Mircea Voda (Romania) (Buggle et al., Reference Buggle, Hambach, Müller, Zöller, Marković and Glaser2014; Necula et al., Reference Necula, Dimofte and Panaiotu2015). Pedogenic hematites originated from 2-line ferrihydrite transformation at higher ambient surface temperatures and are further promoted by the close association with clay minerals (Schwertmann et al., Reference Schwertmann, Friedl, Stanjek and Schulze2000; Soltis et al., Reference Solits, Feinberg, Gilber and Penn2016; Jiang et al., Reference Jiang, Liu, Roberts, Barrón, Torrent and Zhang2018). Bilardello et al. (Reference Bilardello, Banerjee, Volk, Soltis and Penn2020) reported laboratory ferrihydrite transformation at ambient temperatures that produced a low-coercivity fraction represented by groundmass ferrihydrite, nano-hematite, and maghemite, which supports our interpretation. The obtained results (Figs. 5–7) also suggest a significant shift in environmental conditions from unit L5 downward. Two underlying reasons may explain the observed change: (1) a major shift in the source of aeolian dust, deposited before MIS 12, leading to different properties of the parent loess material; and (2) different environmental conditions during older interglacials.
Good consistency in the obtained experimental data is seen with the published magnetic and pedologic study of the Kao2017 profile (Jordanova et al., Reference Jordanova, Simon, Balescu, Jordanova, Ishlyamski, Georgieva, Bourlès, Duvivier and Cornu2022b) (location 2 in this study), which covers the upper 12 m of the section (So–L5 units) and the results for location 1, described here. The observed systematic decrease in coercivity of the hematite fraction starting from L3 downward for location 2 (Jordanova et al., Reference Jordanova, Simon, Balescu, Jordanova, Ishlyamski, Georgieva, Bourlès, Duvivier and Cornu2022b, Fig. 3) is also seen in the decreasing intensity of the hard remanence component (HIRM) for the older part of the profile at location 1 (Fig. 5).
Even though the depth interval, covering L3–L5 horizons at location 1 (this study), is strongly affected by dissolution of a strongly magnetic pedogenic fraction due to stagnant water, well-expressed local maximums in the variations of the oxalate–extractable iron Feo (Fig. 9) corresponds with the obtained variations of Feo along the Kao2017 profile (Jordanova et al., Reference Jordanova, Simon, Balescu, Jordanova, Ishlyamski, Georgieva, Bourlès, Duvivier and Cornu2022b, Fig. 7). This observation, as already discussed in Jordanova et al. (Reference Jordanova, Simon, Balescu, Jordanova, Ishlyamski, Georgieva, Bourlès, Duvivier and Cornu2022b), may be related to systematic mixing of loess with volcanic tephra, spread as a result of increased volcanic activity in the Mediterranean region during the oxygen isotope stages MIS 7–12 (Leicher et al., Reference Leicher, Giaccio, Zanchetta, Wagner, Francke, Palladino, Sulpizio, Albert and E.L2019; Vakhrameeva et al., Reference Vakhrameeva, Wulf, Koutsodendris, Tjallingii, Fletcher, Appelt, Ludwig, Knipping, Trieloff and Pross2019). Tephra weathering would result in increased amounts of Feo due to ferrihydrite or crystalline oxyhydroxides formation depending on climate parameters (Dahlgren et al., Reference Dahlgren, Dragoo and Ugolini1997; Rassmussen et al., Reference Rasmussen, Dahlgren and Southard2010).
Establishing the stacked stratigraphic record of Kaolinovo site using mass specific magnetic susceptibility variations with depth from the sections studied
Close proximity of the sampled sections allows combining the records in one stacked archive covering the total thickness of the loess–paleosol sequence in the area and representing the most complete and undisturbed paleoenvironmental archive at that site. Moreover, comparing the variations of magnetic susceptibility along overlapping stratigraphic intervals could reveal valuable insights on differences in the local geomorphological and edaphic conditions, which influence the degree of pedogenesis and pedogenic magnetic enhancement (Jenny, Reference Jenny1941; Schaetzl and Anderson, Reference Schaetzl and Anderson2009; Geiss and Moses, Reference Geiss and Moses2019).
Depth profiles of magnetic susceptibility from the studied locations, except that at location 1 (Fig. 4), reveal very high consistency in the records down to the fifth loess L5. The younger part of the loess–paleosol complex, represented by the loess–paleosol couplets S0–L1, S1–L2, and S2–L3, is best preserved at location 2 (profile Kao2017), which avoids the disturbing colluvial sedimentation that is clearly visible in the record from location 1. The oldest part of the loess–paleosol complex, comprising the couplets S5–L6 and S6–L7, is represented in the sampled profiles at location 1 and location 5 (Fig. 4). The most obvious difference between the two records is the absence of the sixth loess (L6) at location 5 and weaker magnetic enhancement in the reddish pedogenic horizon of S5 at that site. This most probably was caused by the upland position of the location in the (ancient) landscape (Fig. 2b, c), reducing sedimentation rates and resulting in palimpsest soil formation. The latter is responsible for a less-detailed and less-representative proxy record for the past environmental changes. A similar study is presented in Monger and Bronnikova (Reference Monger and Bronnikova2025). Thus, in the stacked record, the lower part of the loess complex is considered to be best preserved in the depth interval 14–21 m at location 1. The non-sampled upper part of paleosol S5 at location 1 is amended by the interval 9.5–12.5 m sampled at location 5 (Fig. 4). Variations of magnetic susceptibility of the constructed stack record are shown in Figure 10a.
Correlation between the established stack record of magnetic susceptibility (χ) for (a) Kaolinovo with variations of χ along (b) Viatovo (VIA), (c) Suhia kladenetz (SK), and (d) Koriten (KOR) profiles.

Stratigraphic correlation of the Kaolinovo stack with other studied LPS from Central and NE Bulgaria (Suhia kladenetz (SK), Viatovo (VIA), and Koriten (KOR)) using magnetic susceptibility variations reveals the roles of local and regional factors on magnetic records. The three youngest loess–paleosol couplets (S0–L1, S1–L2, and S2–L3) exhibit straightforward and consistently uniform χ variabilities. Correlation tie points utilized represent breakpoints of magnetic susceptibility variations, marking the boundaries between loess and paleosol units, which reflect the terminations of the glacial stages and inception of the interglacials in paleoclimate records (Palacios et al., Reference Palacios, Hughes, Sánchez-Goñi, García-Ruiz, Andrés, Palacios, Hughes, García-Ruiz and Andrés2023). The marker (crypto)tephra layer in loess L2 is clearly present in the profiles, except at Koriten. The incipient paleosol on top of unit S2 is another unambiguous marker horizon, facilitating lateral correlation among the profiles (Fig. 10). The major difference occurs in the thickness of the loess horizons in the four records. Except for loess L6, the other loess units at Kaolinovo are the thinnest ones, suggesting lower sedimentation rates at that site. This observation is consistent with the most southerly position of Kaolinovo with respect to Danube River in Bulgaria (Fig. 1b). The exceptional thickness of the sixth loess (L6) at Kaolinovo is related to the effects of local topography (as discussed above), given that the thicknesses of L6 at the other locations in the area are significantly smaller (Fig. 10).
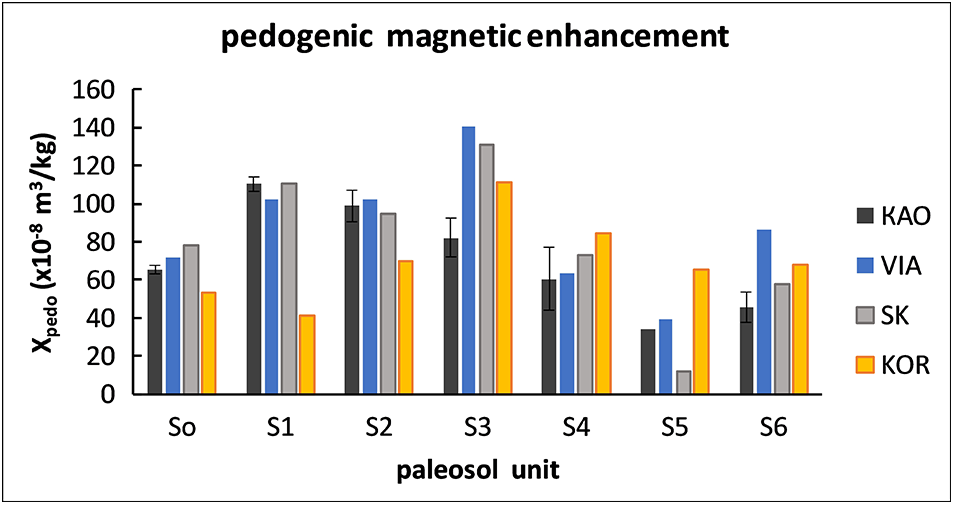
Remarkably, the thicknesses of the first three paleosols among the sites is similar—the Holocene soil (S0) at all locations has a thickness of 1–1.2 m, while S1 and S2 have thicknesses of ∼2 m (Fig. 10). Consequently, pedogenesis during interglacials after the mid-Brunhes climate transition (MBT) (Barth et al., Reference Barth, Clark, Bill, He and Pisias2018) was characterized by wide uniformity and generally weak or absent erosional events. The absolute maximum magnetic enhancement of magnetic susceptibility (χpedo = χmax_soil − χmin_loess) (Maher et al., Reference Maher, Thompson and Zhou1994) was estimated for revealing the changes in paleoclimate conditions among the sites during the interglacials of the last 800 ka (Fig. 11). Present-day, long-term average mean annual temperature (MAT) and mean annual precipitation (MAP) for the sites included in the comparison are quite similar for KAO, VIA, and SK (MAT 10.4–11.6°C and MAP 578–611 mm), while KOR is characterized by more arid conditions (MAT = 10.7°C and MAP = 556 mm) (Kjutchukova, Reference Kjutchukova1983; Koleva and Peneva, Reference Koleva and Peneva1990). This is readily reflected in the very similar values of magnetic enhancement obtained for the three sites (KAO, VIA, and SK) and lower value for KOR site including the Holocene soil S0, but also for paleosols S1 and S2 (Fig. 11). Changing patterns of the magnetic enhancement of older paleosols suggest increased variabilities in paleoenvironmental conditions, including climatic as well as edaphic categories. Special consideration should be paid to the magnetic signature of the fifth paleosol (S5), which developed during the interglacials MIS 13–MIS 15.
Pedogenic magnetic susceptibility for different paleosol horizons for sites from Figure 10. Mean and standard deviation of the values for Kaolinovo were obtained using corresponding values measured from different profiles at locations 1–5.

As seen in Figure 10, very different variations of magnetic susceptibility with depth in S5 are observed, in contrast to the uniformity of the youngest paleosols. As revealed in previous studies (Jordanova et al., Reference Jordanova, Laag, Jordanova, Lagroix, Georgieva, Ishlyamski and Guyodo2022a, Reference Jordanova, Laag, Jordanova, Lagroix, Georgieva, Ishlyamski and Guyodob) and the present analysis, there is strong evidence to suggest frequent additions of tephra material during the formation of older stratigraphic horizons at SK and KAO. As a result, subsequent weathering of the volcanic ash incorporated into the soil column would have resulted in specific changes in iron mineralogy and pedogenic development (Bonatotzky et al., Reference Bonatotzky, Ottner, Erlendsson and Gísladóttir2021).
Conclusions
The magnetic records along several loess–paleosol profiles at Kaolinovo area show firmly repeatable patterns. At lateral distances of 2–3 km between quarries the obtained differences in the variations of the magnetic characteristics are related to the effects of local landscape. The depleted zone at location 1 indicates redoximorphic alterations of Fe oxides due to local waterlogging at filled micro-depressions.
The fraction of free crystalline iron oxides (Fe_crys = Fed − Feo) is linearly related to the estimated by DRS spectroscopy relative content of goethite, showing maxima in older loess horizons (L4–L7). Large concretions consisting of crystalline goethite in the sixth loess imply that goethite may have not only detrital but also secondary (weathering related) origin.
The content of pedogenic hematites, identified by magnetic and spectroscopic analyses, increases systematically towards older paleosols, accompanied by a decrease in their effective magnetic grain size towards superparamagnetic state. This indicates increased paleo-temperatures.
At a regional scale, highly consistent and uniform variabilities in magnetic susceptibility are observed for the loess–paleosol records covering the last three glacial–interglacial cycles (MIS 1–4, MIS 5–6, and MIS 7–8). The calculated pedogenic magnetic enhancement for paleosols S0, S1, and S2 reflects changes in climate humidity. Older deposits incorporate various numbers and amounts of tephra layers, which influence and probably distort the paleoclimatic signals.
Supplementary material
The supplementary material for this article can be found at https://doi.org/10.1017/qua.2025.10036.
Acknowledgments
This research was supported by bilateral cooperation programme PHC RILA 2024 (France – Bulgaria) through project KP-06-RILA/3 of the Bulgarian National Science Fund. We gratefully acknowledge the possibility to carry out low temperature magnetic measurements at IPGP (Paris, France).
Competing interests
All authors declare no competing interests related to this manuscript.