Introduction
Zygotic genome activation (ZGA) is crucial for preimplantation embryo development. During this process, histone variants and their methylation status influence chromatin accessibility for transcriptional factors and thereby regulate the expression of zygotic genes (Lee et al., Reference Lee, Bonneau and Giraldez2014), which play a key role in transferring developmental control from maternal RNA/proteins to the zygote genome (Schultz et al., Reference Schultz, Stein and Svoboda2018). In mice, minor ZGA occurs between the S phase of the one-celled stage and the G1 phase of the two-celled stage, and major ZGA occurs in the middle and late phases of the two-celled stage (Tadros and Lipshitz, Reference Tadros and Lipshitz2009; Xue et al., Reference Xue, Huang, Cai, Cai, Jiang, Feng, Liu, Zeng, Cheng, Sun, Liu, Horvath and Fan2013). The developmental block often observed in two-celled mouse embryos cultured in vitro demonstrates that successful ZGA is vital for the development of an embryo to term (Svoboda, Reference Svoboda2018).
Chromatin accessibility to transcription factors that activate gene expression is regulated by nucleosome position and configuration, which is influenced by modifications of histone variants and tails (Biterge and Schneider, Reference Biterge and Schneider2014). Histone methylation is associated with either activation or repression of transcription depending on its location. Methylation on lysine 4, 36, or 79 in histone H3 (H3K4me3, H3K36me3, or H3K79me3) is commonly linked to active transcription, whereas methylation on lysine 9 or 27 in histone H3 (H3K9me3 or H3K27me3) or lysine 20 in histone 4 (H4K20me3) is associated with repression of transcription (Lachner and Jenuwein, Reference Lachner and Jenuwein2002).
Somatic cell nuclear transfer (NT) is a technology that efficiently reprogrammes terminally differentiated somatic cells to a totipotent state to enable further development into specific animal species (Gurdon, Reference Gurdon1962). Since the first cloned mammal, ‘Dolly’ the sheep, was born (Campbell et al., Reference Campbell, McWhir, Ritchie and Wilmut1996), more than 20 cloned mammalian species have been successfully generated (Van Thuan et al., Reference Van Thuan, Kishigami and Wakayama2010; Matoba and Zhang, Reference Matoba and Zhang2018). However, the cloning efficiency of somatic cell NT is still much lower than that of in vitro fertilization (Matoba and Zhang, Reference Matoba and Zhang2018). The recipient oocyte is believed to have not only powerful reprogramming ability but also shows its inefficiency to the reprogramming barrier present in differentiated donor cells, leading to abnormal enrichment of epigenetic histone modifications and the expression of corresponding genes in cloned embryos (Matoba et al., Reference Matoba, Wang, Jiang, Lu, Iwabuchi, Wu, Inoue, Yang, Press, Lee, Ogura, Shen and Zhang2018). In addition, NT embryos show a developmental block during maternal-to-zygotic transition resulting from incomplete epigenetic remodelling in somatic genomes and developmental defects that are considered consequences of aberrant global epigenetic modifications and reprogramming barriers in somatic genomes, such as X-chromosome inactivation (Inoue et al., Reference Inoue, Kohda, Sugimoto, Sado, Ogonuki, Matoba, Shiura, Ikeda, Mochida, Fujii, Sawai, Otte, Tian, Yang, Ishino, Abe and Ogura2010), H3K4me3 (Liu et al., Reference Liu, Liu, Wang, Gao, Gao, Kou, Zhao, Li, Wu, Xiu, Wang, Yin, Liu, Cai, Wang, Zhang and Gao2016), H3K9me3 (Matoba et al., Reference Matoba, Liu, Lu, Iwabuchi, Shen, Inoue and Zhang2014), H3K27me3 (Matoba et al., Reference Matoba, Wang, Jiang, Lu, Iwabuchi, Wu, Inoue, Yang, Press, Lee, Ogura, Shen and Zhang2018; Zhou et al., Reference Zhou, Wang, Zhang, Su, An, Liu, Zhang, Wang, Liu and Zhang2019), and DNA hypermethylation (Gao et al., Reference Gao, Wang, Gao, Xiu, Chen, Kou, Zhao, Liao, Bai, Qiao, Yang, Wang, Zang, Liu, Jia, Li, Zhang, Yin, Wang, Wan, Zhang and Gao2018).
Dynamic patterns of H3K4me3, H3K9me3, and H3K27me3 in fertilized and NT embryos have been observed at some embryonic stages (Bao et al., Reference Bao, Miyoshi, Okamoto, Jenuwein, Heard and Azim Surani2005; Santos et al., Reference Santos, Peters, Otte, Reik and Dean2005; Wang et al., Reference Wang, Kou, Zhang and Gao2007; Zhang et al., Reference Zhang, Wang, Kou, Zhang and Gao2009; Deng et al., Reference Deng, Chen, Liu, Cai, Wan, Zhou and Wang2020). Such epigenetic modifications are dynamically remodelled during ZGA, which in turn regulates the ZGA process (Barski et al., Reference Barski, Cuddapah, Cui, Roh, Schones, Wang, Wei, Chepelev and Zhao2007). Importantly, developmental defects in NT embryos, which are often associated with dysregulated epigenetic modifications, typically first occur during ZGA (Matoba et al., Reference Matoba, Liu, Lu, Iwabuchi, Shen, Inoue and Zhang2014). However, epigenetic modifications in fertilized, parthenogenetically activated (PA), and NT embryos have not been systematically compared, especially during the pronuclear (PN) and ZGA transition stages. Furthermore, the dynamic pattern of methylation changes in PA embryos during the ZGA process is currently unknown.
In the present study, we characterized the dynamic patterns of H3K4me3, H3K9me3, and H3K27me3 in fertilized, PA, and NT embryos during PN stages and early cleavage (i.e. up to the four-celled stage). We found that NT embryos exhibited overmodification of H3K4me3 and H3K9me3 and undermodification of H3K27me3 compared with fertilized embryos during early ZGA.
Materials and Methods
Unless otherwise stated, all chemicals were obtained from Sigma Chemical Co. (St. Louis, MO, USA).
Ethical approval
All animal care and use procedures were approved by the Animal Care and Use Committee of Nanjing Normal University (IACUC-20201209) and performed according to United States National Institutes of Health guidelines.
Superovulation and collection of oocytes and fertilized embryos
Fertilized zygotes and two- and four-celled embryos were collected from mated females in vivo and served as controls. To obtain fertilized embryos at different PN stages (PN1–PN5), sex-matured ICR female mice (7–8 weeks old, Yangzhou University, Jiangsu, China) were superovulated by injection of 5 IU pregnant mare serum gonadotropin (San-Sheng Pharmaceutical Co. Ltd., Ningbo, China) followed by 7.5 IU human chorionic gonadotropin (hCG, Ningbo Second Hormone Factory, China) 48 h later, after which they were mated with a male overnight. Copulation plugs were checked on the following morning. Female donor mice were sacrificed 14–22 h post-hCG injection, and zygotes at different PN stages were collected from the oviduct. Fertilized one-celled zygotes were classified as PN1, PN2, PN3, PN4, or PN5 based on the relative positions of maternal and paternal pronuclei (Adenot et al., Reference Adenot, Mercier, Renard and Thompson1997). Two- and four-celled embryos were collected 1.5 and 2 days, respectively, post-coitum. Metaphase II (MII) oocytes were collected from unmated superovulated females 16 h after hCG injection. Oocytes and embryos underwent in vitro culture (IVC) in K-modified simplex optimized medium (KSOM; Millipore, Burlington, MA, USA) in a humidified atmosphere containing 5% CO2 at 37°C prior to immunofluorescence (IF) microscopy.
Donor cell preparation, nuclear transfer, and parthenogenetic activation
Cumulus cells collected from B6D2F1 female mice were used as donor cells for NT as previously described (Wakayama et al., Reference Wakayama, Kishigami and Wakayama2019). Briefly, cumulus cells were removed from cumulus–oocyte-complexes using 0.1% hyaluronidase and washed several times in HEPES-CZB (HCZB). Cumulus cell were then resuspended with HCZB containing 1% polyvinyl pyrrolidone (360 kDa) and stored at 4°C prior to NT.
NT micromanipulations were performed as described previously (Markoulaki et al., Reference Markoulaki, Meissner and Jaenisch2008). Briefly, oocytes were collected from the oviduct 14–15 h after hCG injection and enucleated with a blunt Piezo-driven pipette under an inverted microscope (Olympus IX71, Japan) in HCZB supplemented with 5 μg/ml cytochalasin B (C6762). The nuclei of donor cells were transferred into enucleated oocytes and cultured in KSOM for 2 h, which was associated with the formation of premature chromosome condensation. Some reconstructed embryos were collected at this time point, whereas others were activated by 5 h incubation in 5 mM SrCl2 in Ca2+-free CZB with 5 μg/ml cytochalasin B. After PN formation was checked, embryos were collected, thoroughly washed, and cultured in KSOM at 37°C under 5% O2, 90% N2, and 5% CO2 for IVC. One-celled embryos were collected 6 or 12 h post-IVC, two-celled embryos were collected 24 h post-IVC, and four-celled embryos were collected 40 h post-IVC. Different pseudo-PN (PPN) stages of one-celled NT embryos were defined based on the size and location of the two pseudo-pronuclei similar to that of maternal and paternal pronuclei in fertilized embryos.
PA oocyte collection and IVC was performed in the same manner as that for NT oocytes except without nuclear transfer.
Immunofluorescence staining, microscopy, and intensity analysis
Oocytes, donor cells, fertilized embryos, PA embryos, and NT embryos at different stages were fixed with fresh 4% paraformaldehyde for 10 min, washed, and kept in DPBS at 4°C until immunostaining. Permeabilization was performed by treatment with 0.5% Triton X-100 for 15 min and washing in 0.1% DPBS/Tween 20 (PBST) for 15 min at room temperature (RT), followed by blocking with DPBS containing 2% fetal bovine serum for 1 h at RT. Immunostaining was performed by incubation with primary monoclonal antibody against H3K4me3 (Abcam, cat. no. Ab6000, dilution 1:1000), H3K9me3 (CST, cat. no. 5327T, dilution 1:100), or H3K27me3 (Abcam, cat. no. Ab6002, dilution 1:200) overnight at 4°C. After washing for 15 min in PBST, samples were incubated with secondary antibody Alexa Fluor 488 goat anti-mouse IgG (Fcmacs, Nanjing, China, cat. no. Msaf48801, dilution 1:200) in the dark for 1 h at RT. Samples were then washed in PBST several times, stained with 4,6-diamidino-2-phenylindole (DAPI; 100 ng/ml; D9564) for 10 min, and mounted on slides. Images of staining were obtained using fluorescence microscopy (Olympus BX53, Japan) with an exposure time of 500 ms. ImageJ software (v.1.8.0; National Institutes of Health) was used to perform intensity analysis by calculating the cumulative optical density of the total nuclear region minus background optical density (i.e. nuclear area times the average optical density per unit area of an embryo). Briefly, images were converted to 16-bit greyscale, the background value was eliminated by the background subtract function, and the nuclear intensities of integrated fluorescence images were measured and compared among NT, PA, and fertilized embryos.
Statistical analysis
One-way analysis of variance (ANOVA) was used to compare H3K4me3, H3K9me3, and H3K27me3 staining intensity among NT, PA, and fertilized embryos at different stages using SPSS 18.0. Statistical significance was defined as a P-value < 0.05.
Results
In total, 562 fertilized and in vivo-derived embryos (without IVC) (421 PN zygotes, 74 two-celled embryos, and 67 four-celled embryos), 338 NT embryos (218 PPN zygotes, 69 two-celled embryos, and 51 four-celled embryos), and 359 PA embryos (227 PPN zygotes, 71 two-celled embryos, and 61 four-celled embryos) were used in the experiments.
H3K4me3 dynamics in mouse zygotes and PA and NT embryos during ZGA
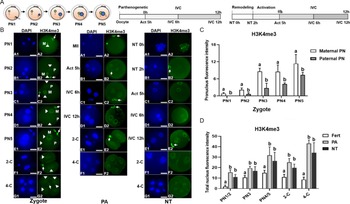
Fertilized mouse zygotes were classified as PN1, 2, 3, 4, or 5 according to the size and location of maternal and paternal pronuclei (Fig. 1A). Maternal and paternal pronuclei in fertilized embryos showed asymmetric changes in H3K4me3 staining from PN1 to PN5. H3K4me3 staining was present in the maternal pronucleus and polar body and increased over time as the pronucleus became larger (intensity of 0.8 and 11.4 at PN1 and PN5, respectively) (Fig. 1B). H3K4me3 staining was not present in the paternal pronucleus at PN1 but appeared at PN2 and gradually increased through PN5 (intensity of 0.6 and 7.4 at PN2 and PN5, respectively), but the intensity was lower than that of maternal PNs (P < 0.05) (Fig. 1C). Fertilized two-celled (2-C) and four-celled (4-C) embryos continued to show H3K4me3 staining.
Dynamic patterns of H3K4me3 at different stages of fertilized, PA, and NT embryo development to the four-celled stage. (A) Fertilized mouse zygotes were classified as PN1, 2, 3, 4, or 5 according to the relative position of maternal (M) and paternal (P) pronuclei (left). Time schedules for PA (middle) and NT (right). (B) H3K4me3 staining in maternal and paternal pronuclei/nuclei (arrowheads) and polar body (arrows) at different stages of fertilized (left), PA (middle), and NT (right) embryo development. Scale bars, 30 μm. (C) Asymmetrical distribution of H3K4me3 staining intensity in maternal and paternal pronuclei (PN) in fertilized embryos (PN1 n = 16, PN2 n = 28, PN3 n = 26, PN4 n = 23, PN5 n = 25). (D) H3K4me3 staining intensity in fertilized (Fert; PN1/2 n = 44, PN3 n = 26, PN4/5 n = 47, 2-C n = 24, 4-C n = 22), PA (PN1/2 n = 25, PN3 n = 23, PN4/5 n = 25, 2-C n = 23, 4-C n = 17), and NT (PN1/2 n = 25, PN3 n = 23, PN4/5 n = 25, 2-C n = 23, 4-C n = 16) embryos. Pseudo-pronuclei at Act 5 h, IVC 6 h, and IVC 12 h were defined as PPN1/2, PPN3, and PPN4/5, respectively. 2-C was represented as two-celled and 4-C as four-celled embryos. a,bDifferent letters indicate statistically significant differences between groups (P < 0.05).

H3K4me3 staining was present in the polar body and metaphase plate (intensity of 9.3) of PA oocytes at MII (Fig. 1B). At 5 h after PA, oocytes possessed two pseudo-pronuclei with increased H3K4me3 staining (Act 5 h, intensity of 20.5). Strong H3K4me3 staining was maintained at 6 h IVC (IVC 6 h, intensity of 19.6) and was further increased at 12 h IVC (IVC 12 h, intensity of 31.8). 2-C (intensity of 30.1) and 4-C (intensity of 43.2) embryos continued to show strong H3K4me3 staining.
H3K4me3 staining was lower in transferred donor cell nuclei 2 h after nuclear remodelling (NT 2 h, intensity of 1.2) than in donor cells prior to NT (NT 0 h, intensity of 6.8) (Fig. 1B). However, H3K4me3 staining increased in the PPN stage from Act 5 h (intensity of 8.6) to IVC 12 h (intensity of 16.9 and 26.5 at IVC 6 h and 12 h, respectively).
H3K4me3 staining intensity in fertilized, PA, and NT embryos at similar PN/PPN stages was compared according to pronuclei size and location, with Act 5 h defined as PPN1/2, IVC 6 h defined as PPN3, and IVC 12 h defined as PPN4/5 (Fig. 1D). NT and PA embryos showed higher H3K4me3 staining intensity than fertilized embryos from PN, 2-C and 4-C stages during ZGA (P < 0.05) (Fig. 1D).
H3K9me3 dynamics in mouse zygotes and PA and NT embryos during ZGA
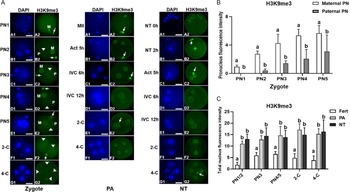
H3K9me3 staining was present in the maternal pronucleus and polar body of fertilized oocytes and increased over time as the pronucleus became larger (intensity of 1.0 and 5.7 at PN1 and PN5, respectively) (Fig. 2A,B). H3K9me3 staining in the paternal pronucleus appeared at PN2 and gradually increased through PN5 (intensity of 0.4 and 3.1 at PN2 and PN5, respectively) (Fig. 2A,B). 2-C (intensity of 4.8) and 4-C (intensity of 3.8) embryos continued to show H3K9me3 staining (Fig. 2A,C).
Dynamic patterns of H3K9me3 at different stages of fertilized, PA, and NT embryo development. (A) H3K9me3 staining in maternal and paternal pronuclei/nuclei (arrowheads) and polar body (arrows) at different stages of fertilized (left), PA (middle), and NT (right) embryo development. Scale bars, 30 μm. (B) Asymmetrical distribution of H3K9me3 staining intensity in maternal and paternal pronuclei (PN) in fertilized embryos (PN1 n = 17, PN2 n = 22, PN3 n = 22, PN4 n = 25, PN5 n = 27). (C) H3K9me3 staining intensity in fertilized (Fert; PN1/2 n = 39, PN3 n = 22, PN4/5 n = 52, 2-C n = 24, 4-C n = 21), PA (PN1/2 n = 25, PN3 n = 25, PN4/5 n = 24, 2-C n = 24, 4-C n = 20), and NT (PN1/2 n = 22, PN3 n = 24, PN4/5 n = 22, 2-C n = 23, 4-C n = 17) embryos. Pseudo-pronuclei at Act 5 h, IVC 6 h, and IVC 12 h were defined as PPN1/2, PPN3, and PPN4/5, respectively. 2-C was represented as two-celled and 4-C as four-celled embryos. a,bDifferent letters indicate statistically significant differences between groups (P < 0.05).

H3K9me3 staining was present in the polar body and metaphase plate (intensity of 7.2) of PA oocytes at MII (Fig. 2A). PA oocytes possessed two pseudo-pronuclei with increased H3K9me3 staining (intensity of 11.1) at Act 5 h, which was further increased at IVC 6 h (intensity of 12.8) and IVC 12 h (intensity of 14.7). 2-C (intensity of 17.1) and 4-C (intensity of 15.3) PA embryos continued to show H3K9me3 staining (Fig. 2A,C).
H3K9me3 staining was higher in NT 2 h oocytes (intensity of 11.5) than in NT 0 h oocytes (intensity of 1.2) and was maintained from Act 5 h (intensity of 13.1) to IVC 12 h (intensity of 14.5 and 13.9 at IVC 6 h and 12 h, respectively) (Fig. 2A). H3K9me3 staining was slightly higher in 2-C (intensity of 15.0) and 4-C (intensity of 16.3) embryos.
Maternal and paternal pronuclei in fertilized embryos showed asymmetric changes in H3K9me3 staining from PN1 to PN5. Intensity analysis showed that zygotes displayed persistent and increasing maternal pronuclear H3K4me3 staining from PN1 to PN5, whereas paternal nuclei showed H3K4me3 staining that began at PN2 and gradually increased through PN5 (P < 0.05) (Fig. 2B). NT and PA embryos showed higher H3K9me3 staining intensity than fertilized embryos during ZGA (P < 0.05) (Fig. 2C).
H3K27me3 dynamics in mouse zygotes and PA and NT embryos during ZGA
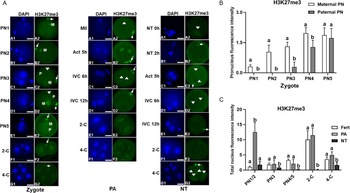
H3K27me3 staining was present in the maternal pronucleus and polar body of fertilized oocytes and increased over time as the pronucleus became larger (intensity of 0.3 and 2.0 at PN1 and PN4, respectively) (Fig. 3A). H3K27me3 staining in the paternal pronucleus appeared at PN3 and increased through PN5 (intensity of 0.3 and 1.7 at PN3 and PN5, respectively). H3K27me3 staining dramatically increased in 2-C embryos (intensity of 10.2), but was lower in 4-C embryos (intensity of 3.6).
Dynamic patterns of H3K27me3 at different stages of fertilized, PA, and NT embryo development. (A) H3K27me3 staining in maternal and paternal pronuclei/pseudo-pronuclei/nuclei (arrowheads) and polar body (arrows) at different stages of fertilized (left), PA (middle), and NT (right) embryo development. Scale bars, 30 μm. (B) Asymmetrical distribution of H3K27me3 staining intensity in maternal and paternal pronuclei (PN) in fertilized embryos (PN1 n = 16, PN2 n = 20, PN3 n = 21, PN4 n = 21, PN5 n = 23). (C) H3K27me3 staining intensity in fertilized (Fert; PN1/2 n = 36, PN3 n = 21, PN4/5 n = 44, 2-C n = 23, 4-C n = 22), PA (PN1/2 n = 26, PN3 n = 24, PN4/5 n = 23, 2-C n = 23, 4-C n = 20), and NT (PN1/2 n = 25, PN3 n = 22, PN4/5 n = 24, 2-C n = 22, 4-C n = 18) embryos. Pseudo-pronuclei at Act 5 h, IVC 6 h, and IVC 12 h were defined as PPN1/2, PPN3, and PPN4/5, respectively. 2-C was represented as two-celled and 4-C as four-celled embryos. a,bDifferent letters indicate statistically significant differences between groups (P < 0.05).

H3K27me3 staining was weak in the metaphase plate (intensity of 1.2), but strong in the polar body at MII phase (Fig. 3A). Act 5 h PA oocytes showed a dramatic increase in H3K27me3 staining (intensity of 12.5) that returned to low levels at IVC 6 h (intensity of 2.0) and IVC 12 h (intensity of 2.1). H3K27me3 staining dramatically increased again in 2-C embryos (intensity of 11.5) and was lower in 4-C embryos (intensity of 5.0).
H3K27me3 staining was present in NT 0 h oocytes (intensity of 2.7), but absent in NT 2 h oocytes (Fig. 3A). H3K27me3 staining returned at low levels in Act 5 h (intensity of 1.8), IVC 6 and 12 h (intensity of 0.2 at both time points), 2-C (intensity of 0.1), and 4-C (intensity of 1.7) embryos.
Maternal and paternal pronuclei in fertilized embryos showed asymmetric changes in H3K27me3 staining intensity from PN1 to PN4. Intensity analysis showed that fertilized embryos exhibited persistent and increasing maternal pronuclear H3K27me3 signals from PN1 to PN5, whereas paternal nuclei showed H3K27me3 staining that began at PN3 stage and increased through PN5 (P < 0.05) (Fig. 3B). PA oocytes exhibited much higher H3K27me3 staining intensity than NT and fertilized oocytes at PN1/2 (P < 0.05) (Fig. 3C). However, PA and fertilized embryos showed similar H3K27me3 staining intensity that was higher than that of NT embryos at PN3, PN4/5, 2-C, and 4-C stages (P < 0.05).
Discussion
We characterized the dynamic patterns of H3K4me3, H3K9me3, and H3K27me3 in early-stage fertilized mouse embryos compared with NT and PA embryos during ZGA. Maternal and paternal pronuclei in fertilized embryos exhibited asymmetric changes in H3K4me3, H3K9me3, and H3K27me3, whereas the maternal pronucleus exhibited all three epigenetic modifications with increasing intensity throughout PN development. These modifications were delayed in the paternal pronucleus. This delay may be explained in that when a sperm penetrates the zona pellucida and enters the cytoplasm of an oocyte, the nucleus initiates paternal genome reprogramming via catalyzing protamine phosphorylation, which is followed by a dramatic replacement of protamine by histone proteins (Gou et al., Reference Gou, Lim, Ma, Aubol, Hao, Wang, Zhao, Liang, Shao, Zhang, Meng, Li, Zhang, Xu, Li, Rosenfeld, Mellon, Adams, Liu and Fu2020). Therefore, post-translational modifications occur normally in the maternal pronucleus but are delayed in the paternal pronucleus due to the time needed for methyltransferases to convert from mono-methylation to di-methylation and tri-methylation on the newly replaced histone H3 (Balakrishnan and Milavetz, Reference Balakrishnan and Milavetz2010).
Previous studies have shown the presence of the active marker H3K4me3, but a lack of the repressive markers H3K9me3 and H3K27me3 in the paternal pronucleus (Lepikhov et al., Reference Lepikhov, Wossidlo, Arand and Walter2010). Other studies have also reported an asymmetric pattern of H3K9me3 in parental pronuclei (Santos et al., Reference Santos, Peters, Otte, Reik and Dean2005; Hou et al., Reference Hou, Liu, Zhang, Cui, Yan, Guan, Chen and An2008) and extensive reprogramming of H3K4me3 on the paternal pronucleus (Zhang et al., Reference Zhang, Zheng, Huang, Li, Xiang, Peng, Ming, Wu, Zhang, Xu, Liu, Kou, Zhao, He, Li, Chen, Li, Wang, Ma, Yin, Kee, Meng, Gao, Xu, Na and Xie2016). Asymmetric histone H3 modifications in paternal and maternal genomes are associated with different functions, which begin to provide a chromatin-based explanation for the paternal-specific active DNA demethylation and maternal-specific protection that may be involved in subsequent ZGA (Wang et al., Reference Wang, Kou, Zhang and Gao2007). The H3K9me3-independent accumulation of HP1 in the paternal pronucleus (Tardat et al., Reference Tardat, Albert, Kunzmann, Liu, Kaustov, Thierry, Duan, Brykczynska, Arrowsmith and Peters2015) indicates the important role of paternal chromatin in regulating epigenetic asymmetry between maternal and paternal pronuclei of mouse embryos in the first cell cycle (Ho et al., Reference Ho, Nguyen, Nguyen and Bui2019). Moreover, the existence of reprogramming factors mainly in the parental pronucleus in mouse zygotes reflects an asymmetric reprogramming capacity of somatic cells during NT (Liu et al., Reference Liu, Yin, Kou, Jiang, Gao, Zhao, Huang, He, Wang, Han and Gao2014), which is consistent with our observation of differing patterns of H3K4me3, H3K9me3, and H3K27me3 in parental pronuclei.
Developmental defects in NT embryos typically first appear during ZGA (Matoba et al., Reference Matoba, Liu, Lu, Iwabuchi, Shen, Inoue and Zhang2014) and are related to dysregulated epigenetic modifications. Consistently, we found that NT and PA embryos exhibited higher H3K4me3 and H3K9me3 intensity than fertilized embryos during PN stages and ZGA, which could mainly be due to differences in chromatin structure between NT oocytes and somatic cell genomes compared with zygotes (Wang et al., Reference Wang, Kou, Zhang and Gao2007). Similar to our findings, a previous study also showed greater H3K4me3 and H3K9me3 at the two-celled stage of cloned mouse embryos (Zhang et al., Reference Zhang, Wang, Kou, Zhang and Gao2009). This enrichment of histone H3 epigenetic modifications in NT and PA embryos through the second cell division (i.e. four-celled stage) could reflect either fast methylation or delayed demethylation (Liu et al., Reference Liu, Liu, Wang, Gao, Gao, Kou, Zhao, Li, Wu, Xiu, Wang, Yin, Liu, Cai, Wang, Zhang and Gao2016; Zhou et al., Reference Zhou, Zhang, Zhang, Wang, Ma, Wang, Wang, Huang and Zhang2020). Previous studies have knocked down methyltransferase or overexpressed demethylase at the RNA or protein level to reduce the presence of H3K4me3 in one-celled NT embryos (Hörmanseder et al., Reference Hörmanseder, Simeone, Allen, Bradshaw, Figlmüller, Gurdon and Jullien2017), but the literature reports conflicting outcomes. Whereas H3K4 demethylation promotes the development of mice, Xenopus, goats, and cows (Liu et al., Reference Liu, Liu, Wang, Gao, Gao, Kou, Zhao, Li, Wu, Xiu, Wang, Yin, Liu, Cai, Wang, Zhang and Gao2016; Hörmanseder et al., Reference Hörmanseder, Simeone, Allen, Bradshaw, Figlmüller, Gurdon and Jullien2017; Zhou et al., Reference Zhou, Zhang, Zhang, Wang, Ma, Wang, Wang, Huang and Zhang2020), overexpression of demethylase does not rescue ZGA defects in pig NT embryos (Liu et al., Reference Liu, Chen, Wang, Zhou, Li, Bu, Zhang, Yin, Wu, Dou, Xu, He, Zhu, Yu, Liu, Zhang, Chen and Miao2021). Furthermore, although aberrant H3K4me3 may not result in ZGA arrest of mouse NT embryos (Liu et al., Reference Liu, Liu, Wang, Gao, Gao, Kou, Zhao, Li, Wu, Xiu, Wang, Yin, Liu, Cai, Wang, Zhang and Gao2016), H3K4me3 hampers Xenopus nuclear reprogramming by maintaining the transcriptional memory of donor somatic cells (Hörmanseder et al., Reference Hörmanseder, Simeone, Allen, Bradshaw, Figlmüller, Gurdon and Jullien2017).
Aberrant modification of H3K9me3 is considered to be a major epigenetic barrier that impedes the developmental competence of NT embryos, particularly during the ZGA process (Matoba et al., Reference Matoba, Liu, Lu, Iwabuchi, Shen, Inoue and Zhang2014), and may be conserved across species (Matoba and Zhang, Reference Matoba and Zhang2018). Similar to previous studies (Weng et al., Reference Weng, Cai, Zhang, Liu, Liu and Liu2020), we found that H3K9me3 intensity was higher in mouse NT and PA embryos than in fertilized embryos during ZGA. However, injection of histone demethylase KDM4A, KDM4B, and KDM4D RNA, which specifically targets H3K9me3, has been shown to improve NT efficiency (Matoba et al., Reference Matoba, Liu, Lu, Iwabuchi, Shen, Inoue and Zhang2014; Chung et al., Reference Chung, Matoba, Liu, Eum, Lu, Jiang, Lee, Sepilian, Cha, Lee and Zhang2015; Liu et al., Reference Liu, Liu, Wang, Gao, Gao, Kou, Zhao, Li, Wu, Xiu, Wang, Yin, Liu, Cai, Wang, Zhang and Gao2016). Injecting KDM4D mRNA increases the developmental competence of cloned mouse embryos (Matoba et al., Reference Matoba, Liu, Lu, Iwabuchi, Shen, Inoue and Zhang2014) and removes H3K9me3 overmodification in human and pig NT embryos (Chung et al., Reference Chung, Matoba, Liu, Eum, Lu, Jiang, Lee, Sepilian, Cha, Lee and Zhang2015; Liu et al., Reference Liu, Chen, Wang, Zhou, Li, Bu, Zhang, Yin, Wu, Dou, Xu, He, Zhu, Yu, Liu, Zhang, Chen and Miao2021), and KDM4E reduces H3K9me3 modification in bovine NT embryos (Liu et al., Reference Liu, Luo, Deng, Wu, Wei, Jiang, Lu and Shi2018a). Furthermore, our observation that mouse NT and PA embryos showed higher H3K4me3 and H3K9me3 intensity than fertilized embryos at early cleavage stages supports the hypothesis that the reprogramming ability of the introduced somatic nucleus is mainly regulated by components in the cytoplasm of the recipient oocyte (Liu et al., Reference Liu, Wang, Gao, Su, Zhang, Xing, Zhou, Yao, An and Zhang2018b; Panda et al., Reference Panda, George, Saha, Sharma, Manik, Chauhan, Palta and Singla2011).
We found that PA and fertilized embryos showed similar patterns of H3K27me3 during ZGA except at PN1/2. By contrast, NT embryos showed very low H3K27me3 intensity at PPN3 and PPN4/5 and no further increase at the two-celled stage, implying the delayed activity of methyltransferase. Interestingly, PA embryos showed pronounced H3K27me3 intensity at PN1/2, suggesting that methyltransferase activity was high enough to convert H3K27me2 to H3K27me3 shortly after oocyte activation. Previous studies have reported conflicting findings regarding the presence of H3K27me3 during NT reprogramming. On the one hand, some studies have shown a lack of H3K27me3 in the inner cell mass of cloned mouse blastocysts (Zhang et al., Reference Zhang, Wang, Kou, Zhang and Gao2009) and that a loss of maternal H3K27me3 imprinting in NT embryos disrupted mouse post-implantation development, indicating its late and more complicated role as an epigenetic barrier (Matoba et al., Reference Matoba, Wang, Jiang, Lu, Iwabuchi, Wu, Inoue, Yang, Press, Lee, Ogura, Shen and Zhang2018). However, other studies have shown that overexpression of KDM6A, which reduces H3K27me3, improves the development of mouse NT embryos (Bai et al., Reference Bai, Song, Zhang, Huang, Huang, Sun and Lei2018) and that reducing H3K27me3 in two-celled embryos by injection of KDM6A mRNA improves the blastocyst formation rate (Yang et al., Reference Yang, Song, Liu, Bai and Li2018; Zhou et al., Reference Zhou, Wang, Zhang, Su, An, Liu, Zhang, Wang, Liu and Zhang2019). In addition, the methyltransferase inhibitor GSK126, which removes the H3K27me3 epigenetic barrier, restores the global transcriptome in porcine NT embryos (Liu et al., Reference Liu, Chen, Wang, Zhou, Li, Bu, Zhang, Yin, Wu, Dou, Xu, He, Zhu, Yu, Liu, Zhang, Chen and Miao2021). These discrepant results among studies may be explained by differences in donor cells and NT methods used within and between species. Therefore, more detailed studies are required to determine the role of H3K27me3 during the early development of mouse NT embryos, especially during ZGA.
In summary, we found that mouse NT embryos exhibited higher H3K4me3 and H3K9me3 and lower H3K27me3 compared with fertilized embryos during ZGA. Also, NT and PA embryos exhibited similar patterns of H3K4me3 and H3K9me3, supporting the hypothesis that reprogramming barriers can lead to developmental inferiority (Ho et al., Reference Ho, Nguyen, Nguyen and Bui2019). These findings help to unravel the epigenetic mechanisms of histone H3 modifications in early NT reprogramming, particularly during the ZGA process, and provide an insight into the role of histone H3 in the regulation of cell plasticity during natural reproduction and somatic cell NT.
Acknowledgements
This study was supported in part by the National Natural Science Foundation of China (NSFC) (Grant Nos. 31872353, 32072732, 31340041, and 31471388) to FD; NSFC Grant No. 31701285 to LA; Specialized Research Fund for Doctoral Programme of Higher Education (SRFDP, Grant No. 20133207110004), Major Programme of Natural Science Research of Jiangsu Higher Education Institutions of China (Grant Nos. 14KJA180003 and 14KJB180008), Priority Academic Programme Development of Jiangsu Higher Education Institutions, and China Spark Programme (Grant No. 2013GA690386) to FD.
Author contributions
Zhihui Liu: conceptualization, methodology, writing-editing; Jing Cui: visualization, analysis; Weiguo Wang: visualization; Mingyangn Li: visualization, analysis; Zhisong Wang: visualization, analysis; Giorgio Antonio Presicce: validation, discussion; Xiuchun (Cindy) Tian: validation, discussion; Liyou An: conceptualization, supervision; Fuliang Du: supervision, writing-review, writing-editing, funding acquisition.
Conflict of interest
The authors declare no conflict of interest relevant to this study.