


INTRODUCTION
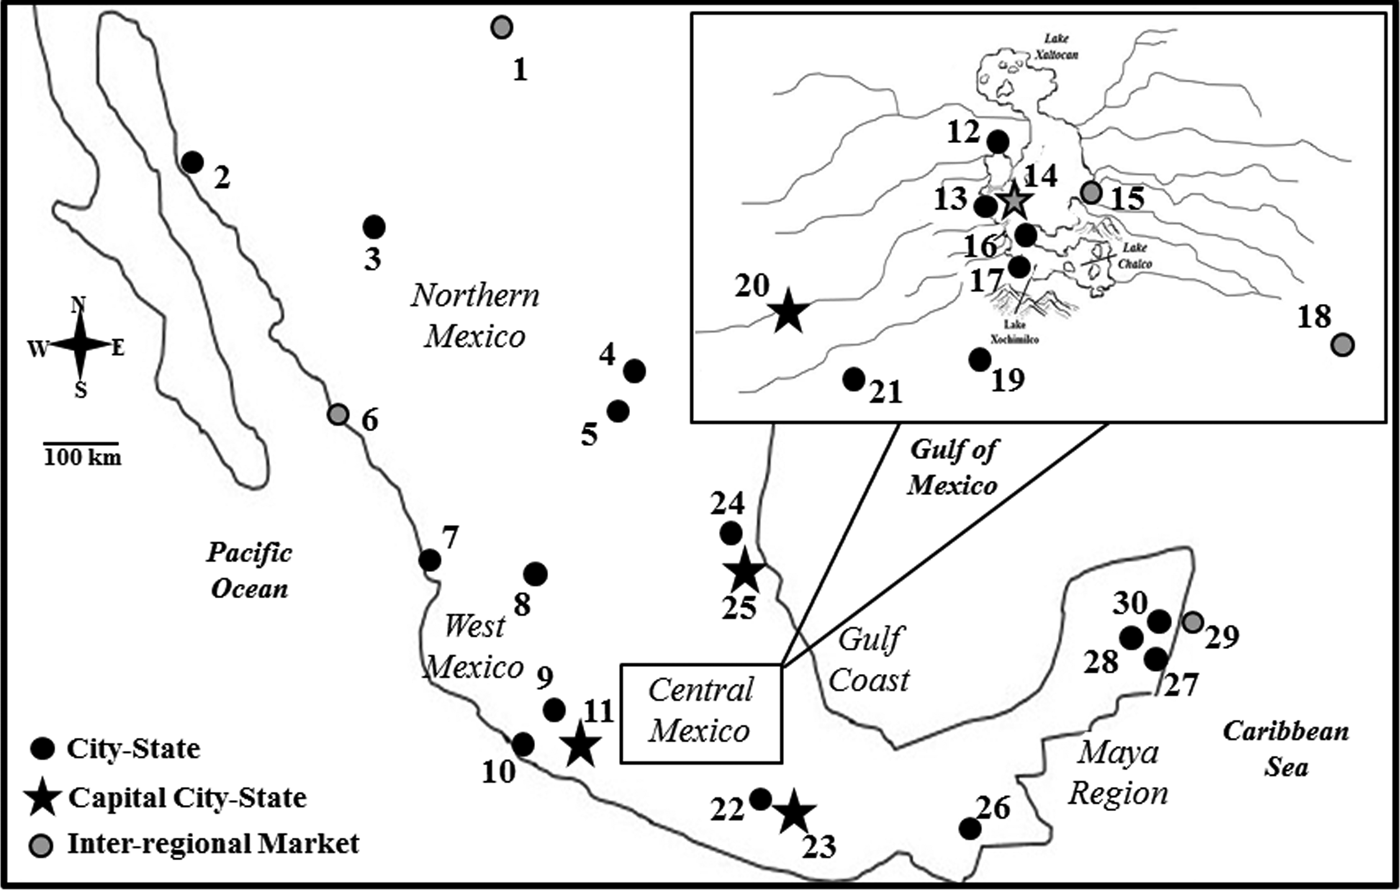
The archaeological record for pre-contact Mesoamerica is extensive. Much of what is known about Mesoamerican populations is derived from material culture, architectural patterns, settlement data, and, in some cases, written accounts (Balkansky Reference Balkansky2006; Beekman Reference Beekman2010; Nichols and Pool Reference Nichols, Pool, Nichols and Pool2012; Pool Reference Pool2006; Smith and Schreiber Reference Smith and Schreiber2006). Among the major geographic regional networks in Mesoamerica are central Mexico, West Mexico, the Huasteca, and Maya region (see Figure 1). This study focuses on populations in Mexico, not all of Mesoamerica. Northern Mexico is often considered part of the American Southwest, separate from Mesoamerica (Kirchhoff Reference Kirchhoff and Graham1981). This region is included in the present study, however, because of shared cultural characteristics and economic exchange among groups in this region and other regions in Mexico (Ericson and Baugh Reference Ericson and Baugh1993; Weigand Reference Weigand, Webster and McBrinn2008). The central question addressed in this study is how different economic, political, and religious strategies influenced regional population structure in these areas.
Map of archaeological sites represented by samples and major regional networks in Mexico during the Postclassic period. 1 = Paquime; 2 = Tayopa; 3 = Nararachic; 4 = Cuatro Ciénegas ; 5 = Candelaria-Paila; 6 = Guasave; 7 = Chalpa-Tecualilla; 8 = Huejuquilla; 9 = Zacapu; 10 = Autlan-Tuxcacuesco; 11 = Tzintzuntzan; 12 = Tlatelolco-Tenochtitlan; 13 = Tenayuca. 14 = Huexotla; 15 = Azcapotzalco; 16 = Culhuacan; 17 = Xochimilco; 18 = Cholula; 19 = Teopanzolco; 20 = Texcaltitlan ; 21 = Teotenango; 22 = Yagul; 23 = Zaachila; 24 = Tamtok; 25 = Vista Hermosa; 26 = Chicoasen; 27 = Tulum; 28 = Coba; 29 = San Gervasio-Cozumel; and 30 = Playa del Carmen. Map by author.

Since archaeological and ethnohistoric data provide a wealth of information about cultural interaction among the populations within these regions, Postclassic-period Mexico is an ideal environment to investigate the relationship between biology and culture among prehistoric human groups. In this study, dental morphological observations from skeletal samples throughout Mexico are used to examine how cultural and political processes at the regional and site levels affect population structures. Population structure refers to the amount of phenotypic (morphological) variation within and among groups. I hypothesize that central Mexico, west Mexico, and the Huasteca/Maya region will show evidence of more genetic exchange than will northern Mexico, since populations throughout the former three regions experienced higher frequencies of contact through trade and political interaction at the within their respective regions. I further hypothesize that samples that represent important economic, political, or religious centers in all regions will show higher within group variation relative to other samples, since these centers would potentially allow for more migratory opportunities.
REGIONAL INTERACTION IN POSTCLASSIC MEXICO
The Postclassic period in Mexico (a.d. 900–1519) is characterized as a time of rapid population growth, high frequency of interregional trade, and endemic warfare (Berdan Reference Berdan and Stuart1989; López Austin and López Luján Reference López Austin and López Luján2001; Smith Reference Smith and Alcock2001; Smith and Berdan Reference Smith and Berdan2000, Reference Smith and Berdan2003). During this time, groups throughout Mexico were organized into city-state cultures, with a capital city controlling nearby towns or cities (Smith Reference Smith and Alcock2001). Economically, trade was facilitated through a complex system of markets, including small-scale local, regional, and large interregional markets (Berdan Reference Berdan and Stuart1989; Hirth Reference Hirth, Nichols and Pool2012; Smith and Berdan Reference Smith and Berdan2003). Several of the interregional markets around Mexico were not city-state capitals, and trade existed across political borders (Berdan Reference Berdan2004, Reference Berdan2014; Hirth Reference Hirth, Nichols and Pool2012; Smith Reference Smith1990; Smith and Berdan Reference Smith and Berdan2000, Reference Smith and Berdan2003). Major religious centers and pilgrimage sites existed all over Mexico during the Postclassic period and drew worshippers from throughout each region. Economic and political relationships varied across geographic regions throughout Mexico during the Postclassic period. For this reason, a regional approach to investigating the effects of cultural interaction on population structure is employed here.
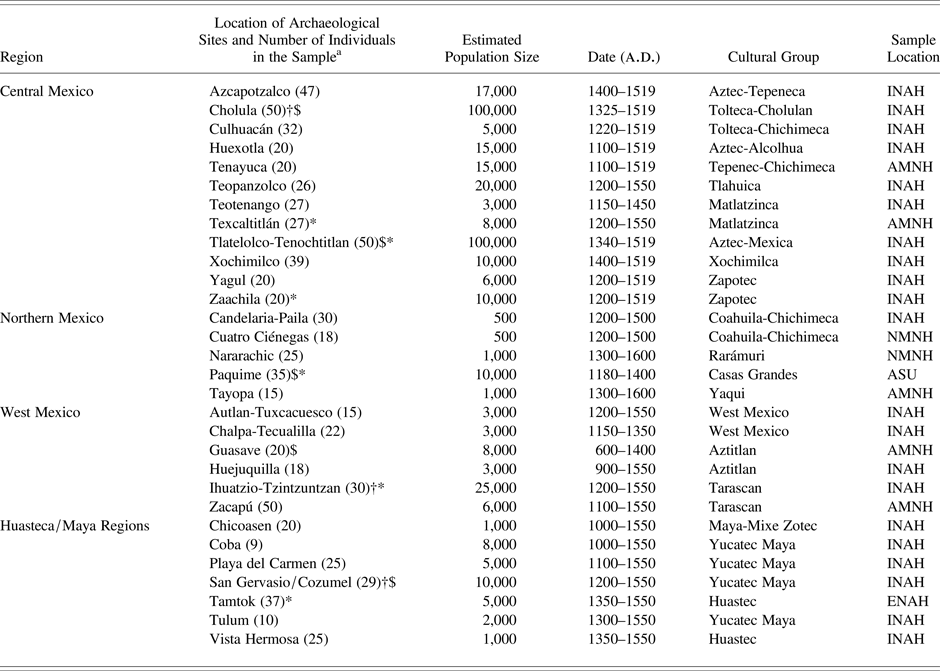
A list of archaeological sites represented by samples, as well as economic and political structure of each site is provided in Table 1. A brief overview of economic and political structure for each region considered in this study is provided below.
Samples used in this study. Sample location abbreviations: Instituto Nacional de Antropología e Historia (INAH), Escuela Nacional de Antropología e Historia (ENAH), National Museum of Natural History (NMNH), American Museum of Natural History (AMNH), and Arizona State University (ASU).

aKey to abbreviations: † indicates a major religious center; $ indicates an inter-regional trade center; and * indicates a political capital.
Central Mexico
Central Mexico is considered the center for widespread trade and political expansion during the Postclassic period (Hodge and Smith Reference Hodge and Smith1994; López Austin and López Luján Reference López Austin and López Luján2001; Melgar and Ciriaco Reference Melgar Tisoc and Solis Ciriaco2009; Smith Reference Smith and Alcock2001). During much of the Middle-Late Postclassic period (a.d. 1200–1519), the Aztec Triple Alliance, led by the Mexica in the Valley of Mexico, grew in power and achieved dominance over much of Mexico (Evans Reference Evans2004; López Austin and López Luján Reference López Austin, Lopéz Luján, Brumfiel and Feinman2008). Although many city-state political capitals existed throughout central Mexico, the Aztec Triple Alliance maintained centers for imperial control in Tenochtitlan, Texcoco, and Tlacopan. The Aztecs also maintained the center of economic exchange, with a large interregional market at Tlatelolco. The market served an estimated 20,000 to 25,000 people daily (Anonymous Conquerer 1971). A large, interregional market was also present at the city of Cholula (Gasco and Berdan Reference Gasco, Berdan, Smith and Berdan2003; McCafferty Reference McCafferty1996). In addition to interregional markets, regional markets with specialized goods and labor were also present in the Valley of Mexico (Berdan Reference Berdan and Stuart1989). These include markets at the sites of Azcapotzalco, Xochimilco, Teopanzolco, and Zaachila.
West Mexico
The Tarascans were the major political power in west Mexico during the Postclassic period. Like the Aztecs, the Tarascans maintained a large empire, extracting tribute of minerals and luxury items from cities within their range of control (Beekman Reference Beekman2010; Pollard and Vogel Reference Pollard, Vogel, Hodge and Smith1994). Unlike the Aztecs, the Tarascan elite maintained firm political and economic control within their domain, controlled by a major political capital at Tzintzuntzan. Additionally, the Tarascan elite controlled specific raw materials such as copper, land, and retained control until the arrival of the Spanish in a.d. 1525 (Pollard Reference Pollard, Smith and Berdan2003). Outside of the imperial boundaries of the Tarascan Empire, many city-states in west Mexico were highly active in trade, particularly in metals and marine goods (Beekman Reference Beekman2010). The Aztitlan trade route was located along the Pacific coast of west Mexico, and was home to several small, densely populated cities and towns that were often fortified with defensive structures and high walls. The Tarascan capital of Tzintzuntzan maintained a regional market and trade throughout the Tarascan Empire was likely controlled through this imperial center (Gorenstein Reference Gorenstein, Adams and MacLeod2000; Pollard and Vogel Reference Pollard, Vogel, Hodge and Smith1994). Along the Pacific coast of west Mexico, particularly in Northwest Mexico, interregional trade occurred through sites such as Guasave (Beekman Reference Beekman2010). This area was frequently in contact with groups in northwest Mexico, and as far as the American Southwest (Kelley et al. Reference Kelley, MacWilliams, Stewart, Adams, Cunningham, Garvin, Maillol, Reimer and Zborover2012).
Huasteca/Maya Region
The Huastec populations inhabited the northern Gulf Coast in scattered relatively low density settlements, with larger concentrations of sites near the major rivers of the region (López Austin and López Luján Reference López Austin and López Luján2001). The Aztecs thought the Huastecs were savage barbarians (Sahagún Reference Sahagún, Anderson and Dibble1982), though their strong resistance to Aztec political expansion during the Late Postclassic period highlights their political/military organization (Hassig Reference Hassig1988). Groups in this area participated in widespread trade networks reaching from the Maya region to the Mississippi Valley in North America (Dávila Reference Dávila and Ocaña2009; López Austin and López Luján Reference López Austin and López Luján2001). Other populations along the Gulf Coast of Mexico, such as those in Veracruz, participated in widespread trade networks throughout Mesoamerica, including the Maya region (Daneels Reference Daneels, Nichols and Pool2012; Gasco and Berdan Reference Gasco, Berdan, Smith and Berdan2003; Pool Reference Pool2006; Zaragoza Ocaña Reference Zaragoza Ocaña2009).
In the Maya region during the Postclassic period, populations are characterized as independent states, engaged in long-distance trade and endemic warfare, with some of the more powerful states expanding their control of resources through conquest (Hammond Reference Hammond, Adams and MacLeod2000; López Austin and López Luján Reference López Austin and López Luján2001). Political power and control of resources shifted over time among dominant populations and their allies. Major trade and religious centers, such those at Cozumel (Freidel and Sabloff Reference Freidel and Sabloff1984; Ringle and Bey Reference Ringle, Bey, Nichols and Pool2012), existed along the coast of the Yucatan Peninsula. The Gulf Coast and Yucatan Peninsula were connected through trade and shared migration history (Diehl Reference Diehl1983; Stresser-Peán Reference Stresser-Peán1989). For this reason, and since samples are limited from the Huasteca, I combined the regions for regional analyses in this project.
Northern Mexico
The Coahuila-Chichimec groups in Northern Mexico occupied caves and open areas that had access to water and desert plains (Turpin Reference Turpin1997). These nomadic groups traveled great distances to participate in trade and settlements were primarily located near available resources. The Casas Grandes culture, centered at Paquime, traded with populations in Mesoamerican and American Southwest (Di Peso Reference Di Peso1974; Weigand Reference Weigand, Webster and McBrinn2008). Paquime served as an economic gateway between these two major cultural regions, exchanging goods such as cacao and macaws from southern Mexico and turquoise from the American Southwest (Crown and Hurst Reference Crown and Hurst2009; Weigand Reference Weigand, Webster and McBrinn2008; Woosley and Olinger Reference Woosley, Olinger, Di Peso and Ravesloot1993). It is also possible Paquime was involved in inter-group warfare for various groups around the Northern Mexico region (Walker Reference Walker2006).
PREVIOUS RESEARCH ON POPULATION STRUCTURE IN PRE-CONTACT MEXICO
There has been a recent increase in research investigating population structure in pre-contact Mexico. Using craniofacial measurements, Gonzales-Jose et al. (Reference González-José, Martínez-Abadías, González-Martín, Bautista-Martínez, Gómez-Valdés, Quinto and Hernández2007) found central Mexican samples to be similar to west Mexican samples, and different than earlier central or northern Mexican samples. These results supported a migration history from the Aztitlan region in west Mexico. Gómez-Valdéz (Reference Gómez-Valdés2008) investigated relationships among mostly west Mexican samples that mostly dated prior to the Postclassic period. He found samples from Tlatelolco in central Mexico similar to west Mexican samples, as well as to other central Mexican samples from the Classic period. Distances were especially low between Tlatelolco and the samples from the Aztitlan region of West Mexico. Ragsdale and Edgar (Reference Ragsdale and Edgar2014, Reference Ragsdale and Edgar2015) also found similarities between central, west, and north Mexican samples, providing supporting evidence for migrations from the north and west into central Mexico. Aubry (Reference Aubry2009) also compared populations from the Classic period (a.d. 300–900) and found several similarities between central Mexico groups over time, and with groups as far as the Maya region. These sources al indicate high levels of interregional migration throughout Mexico over time, especially in central Mexico. Finally, Scherer (Reference Scherer2007) used dental metrics among Classic period Maya groups to determine the amount of intra-regional, inter-group variation. Using a sample of 321 individuals in 12 samples, Scherer found low inter-group variation, with an FST estimate of 0.018 among all samples. Regional FST estimates ranged between 0.003 and 0.019, indicating high intra-regional variation among all tested sample sets. These results are indicative of high amounts of gene flow or migration among samples in the Maya region during the Classic period. The research presented here builds upon these analyses to other regions of Mexico during the Postclassic period.
Other, nonmorphological related studies involve analysis of ancient DNA. Kemp et al. (Reference Kemp, Reséndez, Román Berrelleza, Malhi and Glenn Smith2005) found that mtDNA from samples from Tlatelolco in central Mexico were more similar to various samples from central and southern Mexico, and were different from other Uto-Aztecan speaking groups in northern Mexico and the American Southwest. Additionally, Moreno-Estrada et al. (Reference Moreno-Estrada, Gignoux, Fernández-López, Zakharia, Sikora, Contreras, Acuña-Alonzo, Sandoval, Eng, Romero-Hidalgo, Ortiz-Tello, Robles, Kenny, Nuño-Arana, Barquera-Lozano, Macín-Pérez, Granados-Arriola, Huntsman, Galanter, Via, Ford, Chapela, Rodriguez-Cintron, Rodríguez-Santana, Romieu, Sienra-Monge, Rio Navarro, London, Ruiz-Linares, Garcia-Herrera, Estrada, Hidalgo-Miranda, Jimenez-Sanchez, Carnevale, Soberón, Canizales-Quinteros, Rangel-Villalobos, Silva-Zolezzi, Gonzalez Burchard and Bustamante2013) used DNA to calculate FST values for 511 modern indigenous Mexican individuals from 20 groups throughout Mexico. Their results show high FST values for most regions throughout Mexico. Moreno-Estrada and colleagues (Reference Moreno-Estrada, Gignoux, Fernández-López, Zakharia, Sikora, Contreras, Acuña-Alonzo, Sandoval, Eng, Romero-Hidalgo, Ortiz-Tello, Robles, Kenny, Nuño-Arana, Barquera-Lozano, Macín-Pérez, Granados-Arriola, Huntsman, Galanter, Via, Ford, Chapela, Rodriguez-Cintron, Rodríguez-Santana, Romieu, Sienra-Monge, Rio Navarro, London, Ruiz-Linares, Garcia-Herrera, Estrada, Hidalgo-Miranda, Jimenez-Sanchez, Carnevale, Soberón, Canizales-Quinteros, Rangel-Villalobos, Silva-Zolezzi, Gonzalez Burchard and Bustamante2013) also found genetic similarities between groups in Maya and Veracruz, as well as between lowland Maya and central Mexican groups, supporting a shared migration history based on linguistic similarities (Diehl Reference Diehl1983; Stresser-Peán Reference Stresser-Peán1989). These results are similar to those found through phenetic distance studies of the same populations as described above.
MATERIALS
Dental morphological trait frequencies were derived from observations on 811 human skeletons housed at various institutions in the United States and Mexico. Samples were selected to represent different geographic regional networks around Mexico, with varying economic and political structures. All samples date to the Middle to Late Postclassic periods (a.d. 1200–1519), with some sites possibly containing a few individuals from the Late Classic (a.d. 600–900), Early Postclassic (a.d. 900–1200), and Early Colonial (a.d. 1519–1600) periods. Twelve samples are derived from central Mexico (n = 378); six samples from West Mexico (n = 155); five samples from northern Mexico (n = 123); and seven samples from the Huasteca (n = 62) and Maya regions (n = 93). A list of samples is provided in Table 1, and the locations of archaeological sites are provided in Figure 1.
In central Mexico, the samples from Azcapotzalco, Culhuacan, Huexotla, Xochimilco, Tenayuca, Teopanzolco, Cholula, and Tlatelolco-Tenochtitlan represent the Valley of Mexico. We use Tlatelolco to represent a combined Tlatelolco-Tenochtitlan Aztec sample, in accordance with the history provided by the Codex Cozcatzin (García Lascuráin and Tena Reference García Lascuráin and Tena1994). Tlatelolco-Tenochtitlan was the political capital and economic center for the Aztec Empire. Cholula also maintained an interregional market, and additionally served as a religious pilgrimage center (Gasco and Berdan Reference Gasco, Berdan, Smith and Berdan2003). Teotenango, Texcaltitlan, Yagul, and Zaachila represent the Toluca Valley, west of the Valley of Mexico. Zaachila and Yagul are located in the Oaxaca Valley, south of the Valley of Mexico. Zaachila was a Zapotec political capital (Marcus and Flannery Reference Marcus, Flannery, Marcus and Flannery1983), and a strategic province of the Aztecs.
West Mexico is represented by the Tarascan samples from Zacapu and Ihuatzio-Tzintzuntzan, as well as samples from outside or on the periphery of the Tarascan Empire. Ihuatzio-Tzintzuntzan represents the political and economic capital of the Tarascan Empire. These samples were combined since there is no clear evidence of one particular site affiliation in the excavation records. Tzintzuntzan was also a major religious center in West Mexico (Gorenstein Reference Gorenstein, Adams and MacLeod2000). The other samples from West Mexico represent important mining and economic centers in West Mexico (Beekman Reference Beekman2010). These include Guasave, Chalpa-Tecualilla, Huejuquilla, and Autlan-Tuxcacuesco.
Tamtok and Vista Hermosa represent the Huastec of the northern Gulf Coast. The Maya region is represented by samples from Chicoasen, Coba, Tulum, Playa del Carmen and San Gervasio/Cozumel. Chicoasen is a small, isolated site in the Maya highlands, located in the modern Mexican state of Chiapas. Coba, Tulum, Playa del Carmen, and San Gervasio/Cozumel are all Maya sites located on the east side of the Yucatan peninsula. These sites were all likely involved in maritime trade networks that traded key items such as salt (MacKinnon and Kepecs Reference MacKinnon and Kepecs1989; Kepecs Reference Kepecs, Kohl, Smith and Berdan2003). Cities and towns located throughout the area were often connected by stone causeways, indicating a high amount of population contact, probably for economic exchange (Chase and Chase Reference Chase and Chase2001). Fortifications and watch towers at sites such as Tulum also suggest high levels of inter-site warfare (Sharer and Traxler Reference Sharer and Traxler2006; Webster Reference Webster1976). Cozumel was a major religious and economic center for the Maya (Freidel and Sabloff Reference Freidel and Sabloff1984). The Huasteca and Maya regions were combined into one regional network for this analysis due to limited sample availability for the Gulf Coast region.
The northern Mexico samples consist of Tayopa, Cuatro Ciénegas and Candelaria-Paila Caves, Paquime and Nararachic. Tayopa is located along the Pacific Coast of the Mexican state of Sonora. Several nomadic groups inhabited this area. The Cuatro Ciénegas and Candelaria-Paila Caves sites are representative samples of the nomadic Coahuila-Chichimec groups. Paquimé was the political and economic center for the Casas Grandes culture (Di Peso Reference Di Peso1974; Kelley Reference Kelley, Di Peso and Ravesloot1993; Woosley and Olinger Reference Woosley, Olinger, Di Peso and Ravesloot1993) and may have interacted with the semi-nomadic populations near the burial site of Nararachic.
METHODS
Dental Morphological Observations
We used dental morphology to study population structure among Postclassic Mexican populations. Dental morphology is an effective method for tracing intrapopulation variation, interpopulation relationships, and microevolution (T. Hanihara Reference Hanihara2008; Scott and Turner Reference Scott and Turner1997; Willermet and Edgar Reference Willermet and Edgar2009). Dental morphological studies analyze observations of standardized morphological characteristics found on the crown surfaces of teeth. These characteristics are relatively unaffected by sexual dimorphism and aging (Scott and Turner Reference Scott and Turner1997; Smith Reference Smith1977) and may be adjusted for asymmetry. These traits are observable even with moderate attrition, provide large sample sizes for archaeological populations, provide a high recording replicability, are associated with low inter-trait correlations (K. Hanihara Reference Hanihara1976; T. Hanihara Reference Hanihara2008), possess a high genetic component (Scott and Turner Reference Scott and Turner1997; Townsend et al. Reference Townsend, Hughes, Luciano, Bockmann and Brook2009), and evolve slowly (Turner et al. Reference Turner, Nichol and Scott1991). For these reasons, dental morphological observations are ideal for analyzing population structure.
We made observations on a maximum of 62 maxillary and mandibular dental morphological traits on observable adult teeth. Traits were not recorded in cases of damaged teeth, severe dental wear, or large carious lesions. Traits were scored on both left and right antimeres to account for asymmetry, with the higher score representing the maximum expression of the trait in each individual. The trait expressions were scored on a graded scale in accordance with the Arizona State University Dental Anthropology System (Turner et al. Reference Turner, Nichol and Scott1991). Breakpoints were drawn primarily from Scott and Turner (Reference Scott and Turner1997) and were used to divide trait expressions into presence and absence for use in regional biological distance analyses. In some cases, breakpoints were adjusted based on previous analyses of pre-contact Mexican groups (Ragsdale and Edgar Reference Ragsdale and Edgar2014). Traits for which breakpoints were adjusted include maxillary shoveling (upper central and lateral incisors), mandibular shoveling (lower central incisors), and protostylid on the mandibular molar (lower first and second molars). Shoveling on the maxillary and mandibular incisors is present at high frequencies (over 0.90) for all of the samples used here, so an adjusted breakpoint was necessary for analysis. For protostylid, the foramen caecum molaris (score of “1”) was not included as present, as the use of this expression is controversial. Dichotomized data was used for intra-regional variation analyses, and raw, nondichotomized data was used for intra-group variation analyses. Complete lists of traits used in the final analyses are provided in Supplementary Tables 1–3.
Phenetic Distances
We calculated phenetic distance matrices for central Mexico, West Mexico, northern Mexico, and the Huasteca/Maya region. Phenetic distances are biological distances derived from morphological (phenotypic) data, such as dental morphological observations. The pseudo-Mahalanobis D2 statistic was used to obtain the distances matrices. Pseudo-Mahalanobis D2 extends the squared pseudo-Mahalanobis distance for use with dichotomized data by using z-scores and a tetrachoric correlation matrix in the calculation (Konigsberg Reference Konigsberg1990). The tetrachoric correlation matrix is a matrix of correlation coefficients computed for two normally distributed dichotomized variables and serves to account for inter-trait correlations. This statistic was used, as opposed to Smith's Mean Measure of Divergence (MMD), because it allows for the use of correlated traits, and can be used in the calculation of FST (see below). Studies comparing pseudo-Mahalanobis D2 and MMD show the two statistics are highly correlated, and both are useful in biological distance studies (Edgar Reference Edgar2004; Irish Reference Irish2010). Tetrachoric correlation matrices and pseudo-Mahalanobis D2 values were calculated using SAS Statistical Software. A principal component (PC) scatterplot was created from the pseudo-Mahalanobis D2 matrices to show the relationships between sites on two axes for each region. The PC analysis provides the percentage of variance among samples accounted for on each axis. These analyses were conducted using PAST (Hammer et al. Reference Hammer, Harper and Ryan2001).
FST
FST is a measure of genetic or population differentiation that represents the total variation among samples within a particular region (Relethford and Harpending Reference Relethford and Harpending1994). Low FST values indicate low variation among samples within a region; high FST values indicate high variation among samples. For example, an FST value of 0.10 means that 10 percent of the total variation exists in differences among samples within a region, while 90 percent of the variation is between individuals within and across samples. FST is useful in estimating the amount of gene flow and migration among populations within a region. If FST values in a particular region are low when compared to FST values derived from all samples across all regions, then there is a higher amount of gene flow and migration among the populations in that particular region. FST can be extended for use with morphological data when a distance matrix, relative population sizes, and heritability estimates are available (T. Hanihara Reference Hanihara2008; Irish Reference Irish2010; Relethford and Blangero Reference Relethford and Blangero1990).
Both scaled and unscaled FST values were calculated for central Mexico, West Mexico, northern Mexico, and the Huasteca/Maya region. For scaled FST estimates, population sizes based on settlement data were used to rank each population's size relative to all other populations regionally and interregionally (Relethford and Blangero Reference Relethford and Blangero1990; Scherer Reference Scherer2007). Settlement data for several sites used in this analysis are available from archaeological reports and analyses (Balkansky Reference Balkansky2006; Di Peso Reference Di Peso1974; Gorenstein Reference Gorenstein, Adams and MacLeod2000; Hodge and Smith Reference Hodge and Smith1994; Joyce Reference Joyce2010; Pool Reference Pool2006). For sites for which population sizes have not been previously estimated, population size was scaled based on the relative geographic size of the archaeological site. Population size estimates are provided in Table 1. As with many archaeological samples, reliable population size estimates are nonexistent for some of the groups used in this study. For this reason, an unscaled FST, which assumes all population sizes are equal, was also calculated.
Another element required to calculate FST using morphological data is a heritability estimate for the selected traits (Relethford and Blangero Reference Relethford and Blangero1990). Heritability is the proportion of genetic variance to the total variance. In this study, FST is based on broad sense heritability, or the ratio of total genetic variance to total phenotypic (morphological) variance. A conservative approach to calculating FST is to assume complete heritability (h2 = 1), which results in the minimum FST value. Heritability is a population specific value, and currently no heritability data exists for prehistoric Mexico, so calculating FST with multiple heritability estimates is a pragmatic approach. Studies of dental morphological trait heritability using monozygotic and dizygotic twins found the majority of trait heritabilities range from 0.5 to 0.9 (Bockmann et al. Reference Bockmann, Hughes and Townsend2010; Boraas et al. Reference Boraas, Messer and Till1988; T. Hanihara Reference Hanihara2008; Mizoguchi Reference Mizoguchi1977; Townsend et al. Reference Townsend, Hughes, Luciano, Bockmann and Brook2009). Since estimates range from 0.5 to 0.9 for nearly all of the dental morphological traits for which heritability has been estimated, I calculated FST values using both h2 = 0.5 and h2 = 0.9.
Nonmetric Multidimensional Scaling (MDS)
Nonmetric multidimensional scaling (MDS) analyses are useful in evaluating intraregional and intragroup variation. This technique allows a graphical representation of phenetic distances among individuals within a sample or set of samples (Kruskal and Wish Reference Kruskal and Wish1978). Nonmetric MDS allows for the comparison of a single line of data, in this case individuals within a site, with all other lines of data within a region. Recently, nonmetric MDS analyses using dental morphological data have been used to investigate intrasite variation among prehistoric human groups (Martinón-Torres et al. Reference Martinón-Torres, Bermúdez de Castro, Martin-Francés, Gracia-Téllez, Martinez, Luiz Arsuaga, Scott and Irish2013; Stojanowski et al. Reference Stojanowski, Johnson, Duncan, Scott and Irish2013). Here we use nonmetric MDS to evaluate patterns of intrasite variation among samples regionally.
Nonmetric MDS analyses were performed using raw, non-dichotomized data from maxillary and mandibular dental morphological traits for each region. Traits that exhibited very little (less than five percent) or no variation among samples were removed prior to analysis. Individuals with missing data were removed prior to computation, or were excluded from the analysis using pairwise deletion. Since skeletal samples from archaeological populations are often missing teeth or exhibit severe dental wear, several individuals were removed from each sample for these analyses. Gower (Reference Gower1971) similarity coefficients were used to perform the non-metric MDS since they are useful for mixed data types, in this case ordinal and binary data. A convex hull was determined for each sample. The convex hull is the smallest convex polygon that includes all individuals within a sample. This provides a visual representation of the distribution of each sample within a particular region. Samples that have high within-group variation have a larger distribution and a larger convex hull, compared to groups with low within-group variation. MDS were performed using PAST (Hammer et al. Reference Hammer, Harper and Ryan2001).
RESULTS
Phenetic Distances and FST
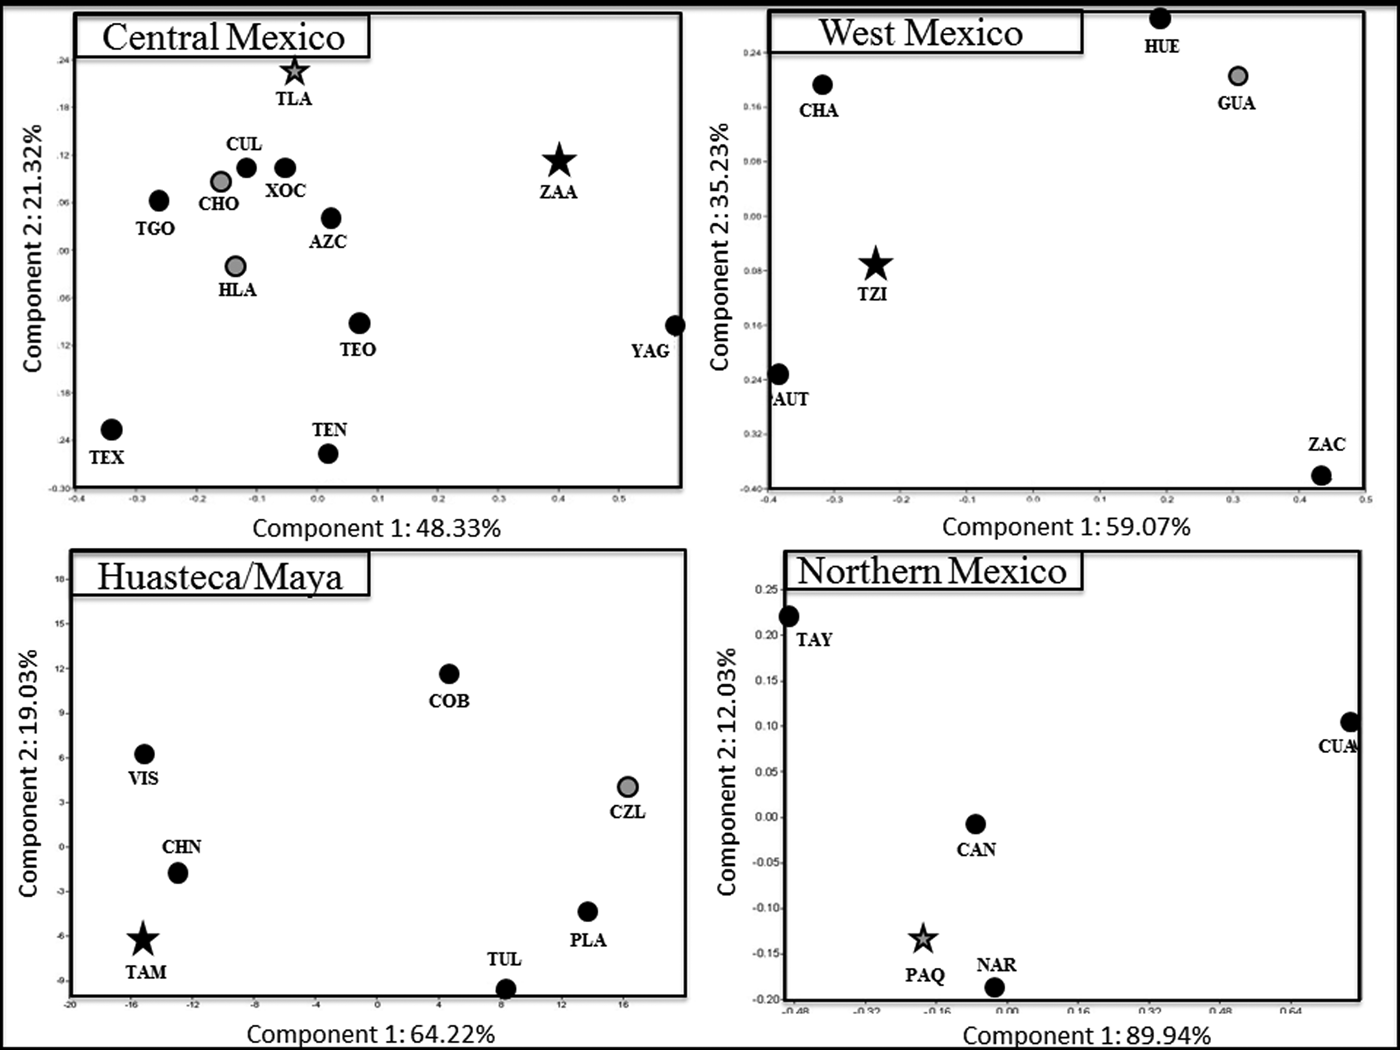
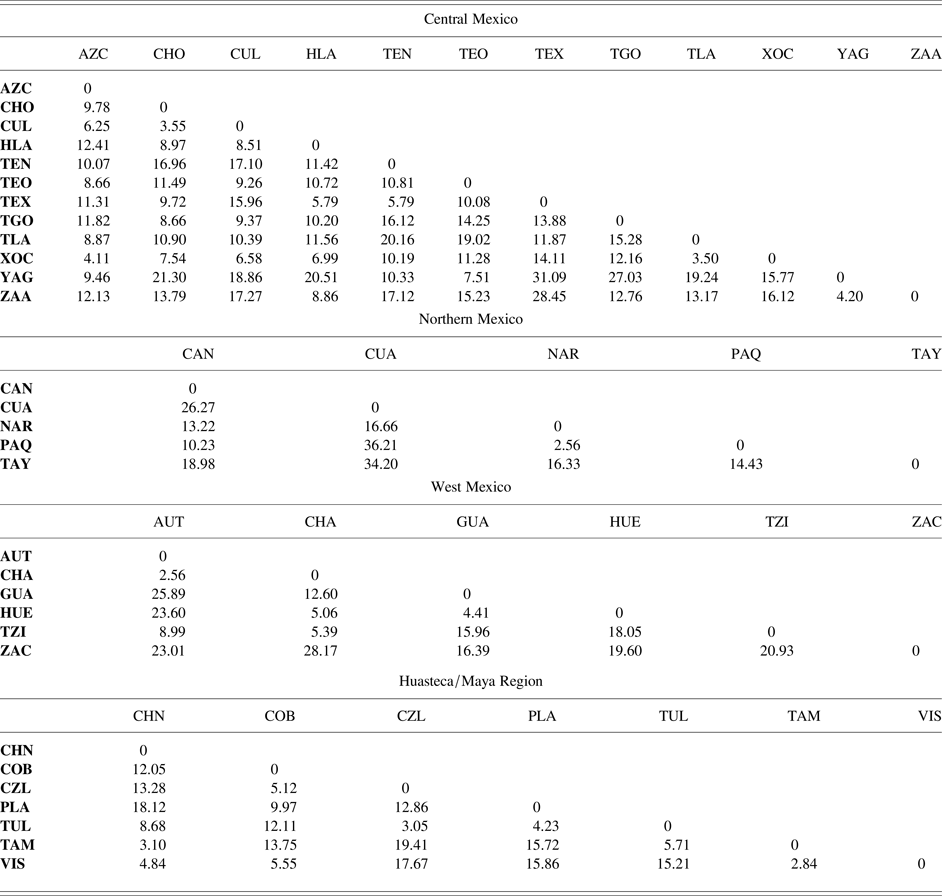
Pseudo-Mahalanobis D2 matrices for each region are provided in Table 2. PC scatterplots of the pseudo-Mahalanobis D2 distances are provided in Figure 2. In central Mexico, the pseudo-Mahalanobis D2 distances for the Valley of Mexico are relatively small. Some large distances are present with the samples from the Oaxaca Valley samples from Yagul (YAG) and Zaachila (ZAA) and several other samples, distinguishing this region from the Valley of Mexico and Toluca Valley. There are large distances between Tlatelolco-Tenochtitlan (TLA), and Texcaltitlan (TEX) and Tenayuca (TEN). There are small distances between the Oaxaca Valley samples, Culhuacán and Cholula (CHO), and between Tlatelolco-Tenochtitlan and Xochimilco (XOC).
Principle component analyses based on regional pseudo-Mahalanobis’ distance (D2) matrices for: AUT = Autlan-Tuxcacuesco; AZC = Azcapotzalco; CAN = Candelaria-Paila; CHA = Chalpa-Tecualilla; CHN = Chicoasen; CHO = Cholula; COB = Coba; CUA = Cuatro Ciénegas; CUL = Culhuacan; CZL = San Gervasio-Cozumel; GUA = Guasave; HLA = Huexotla; HUE = Huejuquilla; NAR = Nararachic; PAQ = Paquime; PLA = Playa del Carmen; TAM = Tamtok; TEN = Tenayuca; TEO = Teopanzolco; TEX = Texcaltitlan; TGO = Teotenango; TLA = Tlatelolco-Tenochtitlan; TUL = Tulum; TZI = Tzintzuntzan; XOC = Xochimilco; YAG = Yagul; ZAA = Zaachila; and ZAC = Zacapu. Stars indicate major political centers. Grey shading indicates a major economic center. Image by author.

Pseudo-Mahalnobis distance (D2) matrices for central, northern, and West Mexico and the Huasteca/Maya region. Abbreviations for sites: AUT = Autlan-Tuxcacuesco; AZC = Azcapotzalco; CAN = Candelaria-Paila; CHA = Chalpa-Tecualilla; CHN = Chicoasen; CHO = Cholula; COB = Coba; CUA = Cuatro Ciénegas; CUL = Culhuacan; CZL = San Gervasio-Cozumel; GUA = Guasave; HLA = Huexotla; HUE = Huejuquilla; NAR = Nararachic; PAQ = Paquime; PLA = Playa del Carmen; TAM = Tamtok; TEN = Tenayuca; TEO = Teopanzolco; TEX = Texcaltitlan; TGO = Teotenango; TLA = Tlatelolco-Tenochtitlan; TUL = Tulum; TZI = Tzintzuntzan; XOC = Xochimilco; YAG = Yagul; ZAA = Zaachila; and ZAC = Zacapu.

In general, most of the distances among central Mexican samples are small. In the PC scatterplot, most of the samples from the Valley of Mexico are grouped closely together on Components 1 (48.33 percent variance) and 2 (21.32 percent variance). The exceptions are with Tlatelolco-Tenochtitlan on Component 2, and Tenayuca on both components. The samples from the Toluca Valley, Teotenango (TGO) and Texcaltitlan are separated from the Valley of Mexico samples on Component 2, and the samples from the Oaxaca Valley are separated from all other samples on Component 1. Yagul is also separated from the Valley of Mexico samples on Component 2.
In West Mexico, most of the phenetic distances among samples are high. Relatively high distances are present between Zacapu (ZAC) and all other samples; Huejuquilla (HUE) and the other samples except Chalpa-Tecualilla CHA) and Guasave (GUA); and between Guasave and the other samples except Huejuquilla. Relatively low distances are present between Tzintzuntzan (TZI) and Chalpa-Tecualilla, Chalpa-Tecualilla and Huejuquilla, Chalpa-Tecualilla and Autlan-Tuxcacuesco (AUT), and between Huejuquilla and Guasave. The PC scatterplot shows most of the samples to be different from one another, with Guasave plotted closely with Huejuquilla on Components 1 (59.07 percent variance) and 2 (35.23 percent variance); Chalpa-Tecualilla, Autlan-Tuxcacuesco, and Tzintzuntzan are grouped together on Component 1 but are separated by Component 2; and Zacapu is different than all other samples on Components 1 and 2.
Most of the distances among the Huasteca and Maya groups are relatively small. Particularly small distances are present between Vista Hermosa (VIS) and Tamtok (TAM), Chicoasen (CHN) and Vista Hermosa, Chicoasen and Tamtok, Tulum (TUL) and Cozumel/San Gervasio (CZL), and between Tulum and Playa del Carmen (PLA). Some relatively large distances are present between Chicoasen and Playa del Carmen; Playa del Carmen and the Huastec samples from Tamtok, Vista Hermosa, Cozumel/San Gervasio and the Huastec samples from Tamtok and Vista Hermosa; and between Tulum and Vista Hermosa. The PC scatterplot shows two separate groups on Component 1 (62.22 percent variance). Vista Hermosa, Tamtok, and Chicoasen are grouped together; Cozumel/San Gervasio, Playa del Carmen, Tulum, and Coba are also grouped together. The similarity between the lowland Maya and Huastec samples is only on Component 2 (19.03 percent variance). Chicoasen is plotted between Tamtok and Vista Hermosa on Component 2. Coba (COB) is separated from most of the other Maya samples on Component 2, and is most similar to Vista Hermosa and Cozumel/San Gervasio.
Most of the phenetic distances are large in northern Mexico. The only small distance is between Paquime (PAQ) and Nararachic (NAR). Particularly large distances are present between Cuatro Ciénegas (CUA) and Tayopa (TAY), Cuatro Ciénegas and Paquime, and between Cuatro Ciénegas and Candelaria-Paila Caves (CAN). Results of the PC scatterplot show Paquime Nararachic, and Candelaria-Paila Caves are grouped together on Components 1 (59.07 percent variance) and 2 (35.23 percent variance). Tayopa and Cuatro Ciénegas is most similar to and Tayopa on Component 2. Cuatro Ciénegas is the furthest from all the other northern Mexico samples. The sample from Candelaria-Paila Caves is located in the center of all samples on both components.
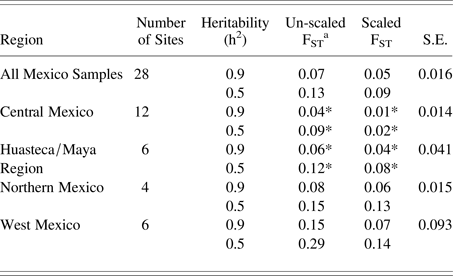
The results of the FST tests are consistent with the patterns found in the pseudo-Mahalanobis D2 distance matrices. Scaled and unscaled FST values for each region are provided in Table 3. The overall FST values for all samples at h2 = 0.9 and h2 = 0.5 (unscaled = 0.07, 0.13; scaled = 0.05, 0.09) are low. When viewed regionally, the unscaled FST values are low for central Mexico (0.04, 0.09) and the Huasteca/Maya regions (0.06, 0.12). FST values are higher for West Mexico (0.15, 0.29); northern Mexico values are intermediate (0.08, 0.15) regions. When FST values are scaled by estimated relative population size, FST values remain low for central Mexico (0.01, 0.02) and the Huasteca/Maya regions (0.04, 0.08); FST values remain relatively high for the west (0.07, 0.14) and northern Mexico (0.06, 0.13) regions.
FST for regional networks.

a * indicates regional FST lower or equal to total FST.
Nonmetric MDS
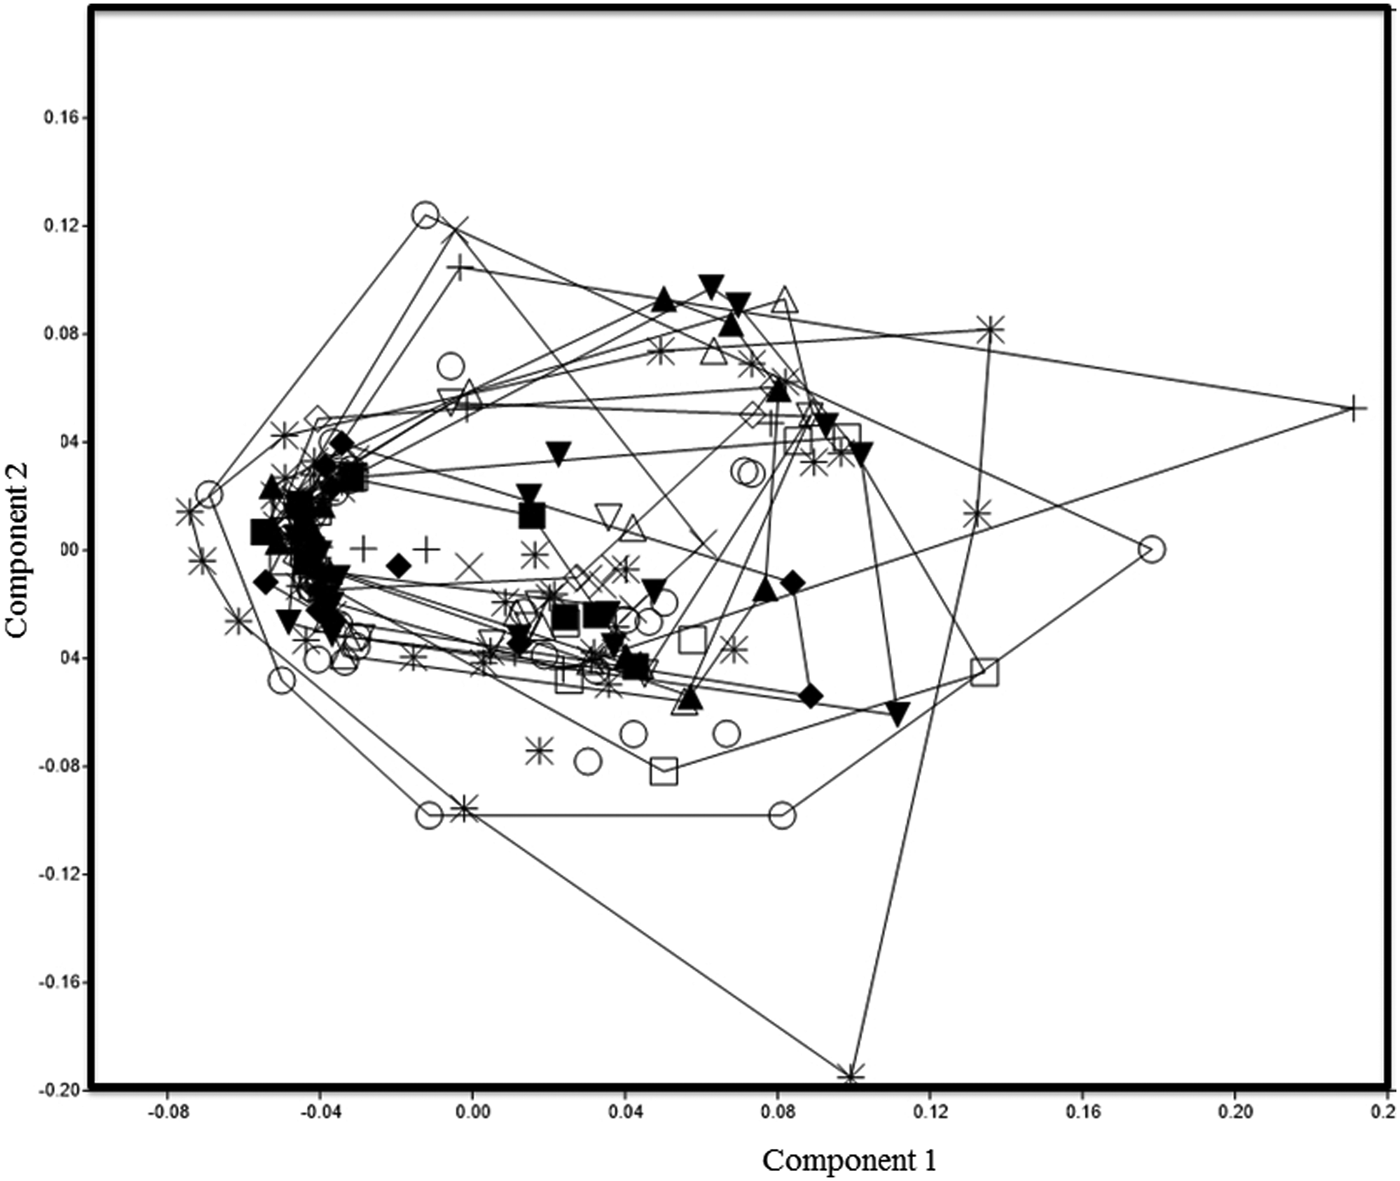
The results of the nonmetric MDS analyses are provided in Figures 3–6. All of the samples from central Mexico are similar, with individuals from all samples plotted close to each other. The distribution of individuals from Tlatelolco-Tenochtitlan, Cholula, and Zaachila are large on Components 1 and 2 compared to the other groups from central Mexico, indicating a high level of variation within site for these samples. All of the other samples are distributed in small ranges, indicating low variation within site.
Nonmetric multidimensional scaling for sites in central Mexico, including: Azcapotzalco (filled inverted triangle); Cholula (circle); Culhuacan (triangle); Huexotla (filled triangle); Teopanzolco (diamond); Tenayuca (filled diamond); Teotenango (square); Texcaltitlan (filled square); Tlatelolco-Tenochtitlan (asterisk); Xochimilco (inverted triangle); Yagul (X); and Zaachila (plus sign). Image by author.

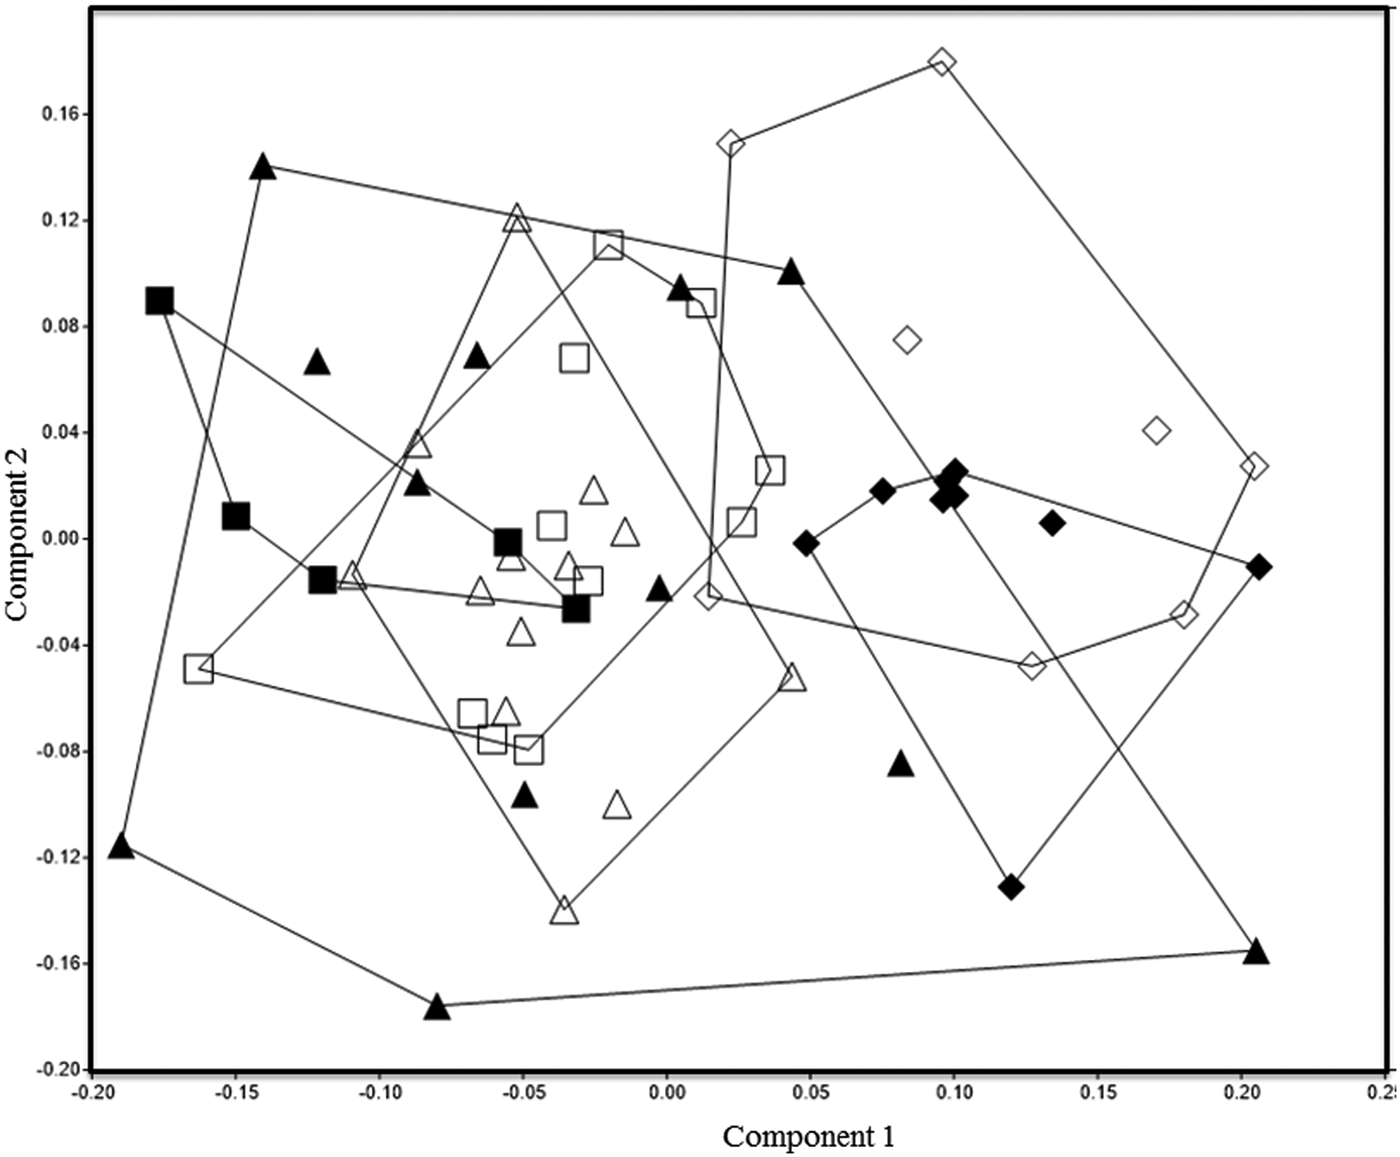
Nonmetric multidimensional scaling for sites in West Mexico, including: Autlan-Tuxcacuesco (filled square); Chalpa-Tecualilla (square); Guasave (diamond); Huejuquilla (filled diamond); Tzintzuntzan (triangle); and Zacapu (filled triangle). Image by author.

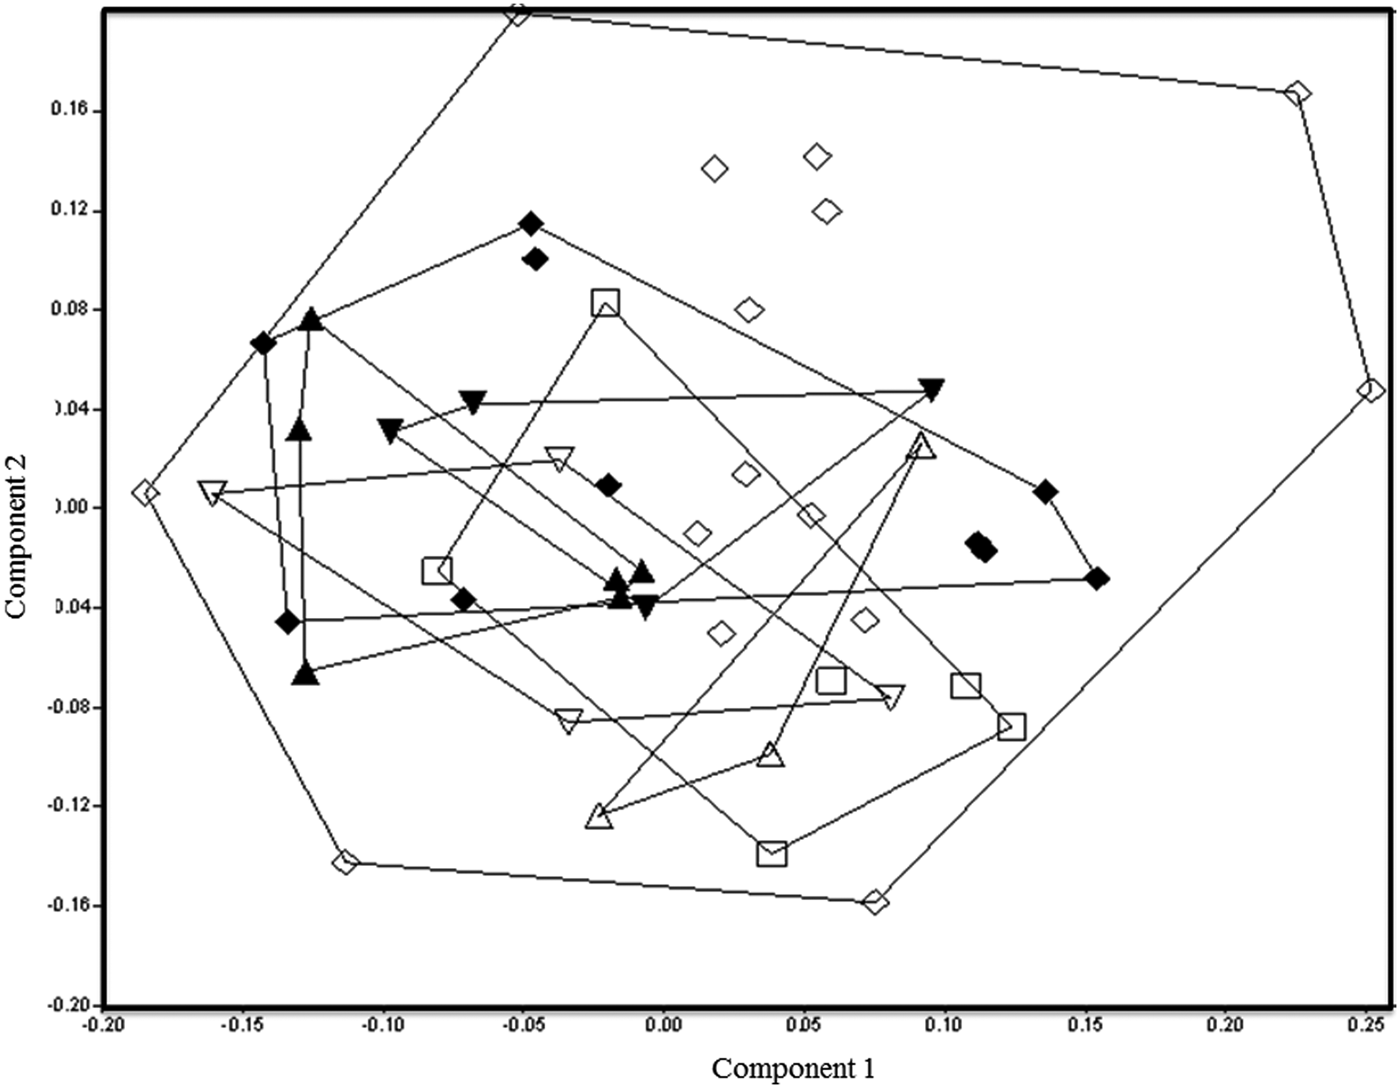
Nonmetric multidimensional scaling for sites in the Huasteca/Maya region, including: Chicoasen (square); Coba (triangle); Playa del Carmen (inverted triangle); San Gervasio-Cozumel (filled inverted triangle); Tamtok (diamond); Tulum (filled triangle); and Vista Hermosa (filled diamond). Image by author.

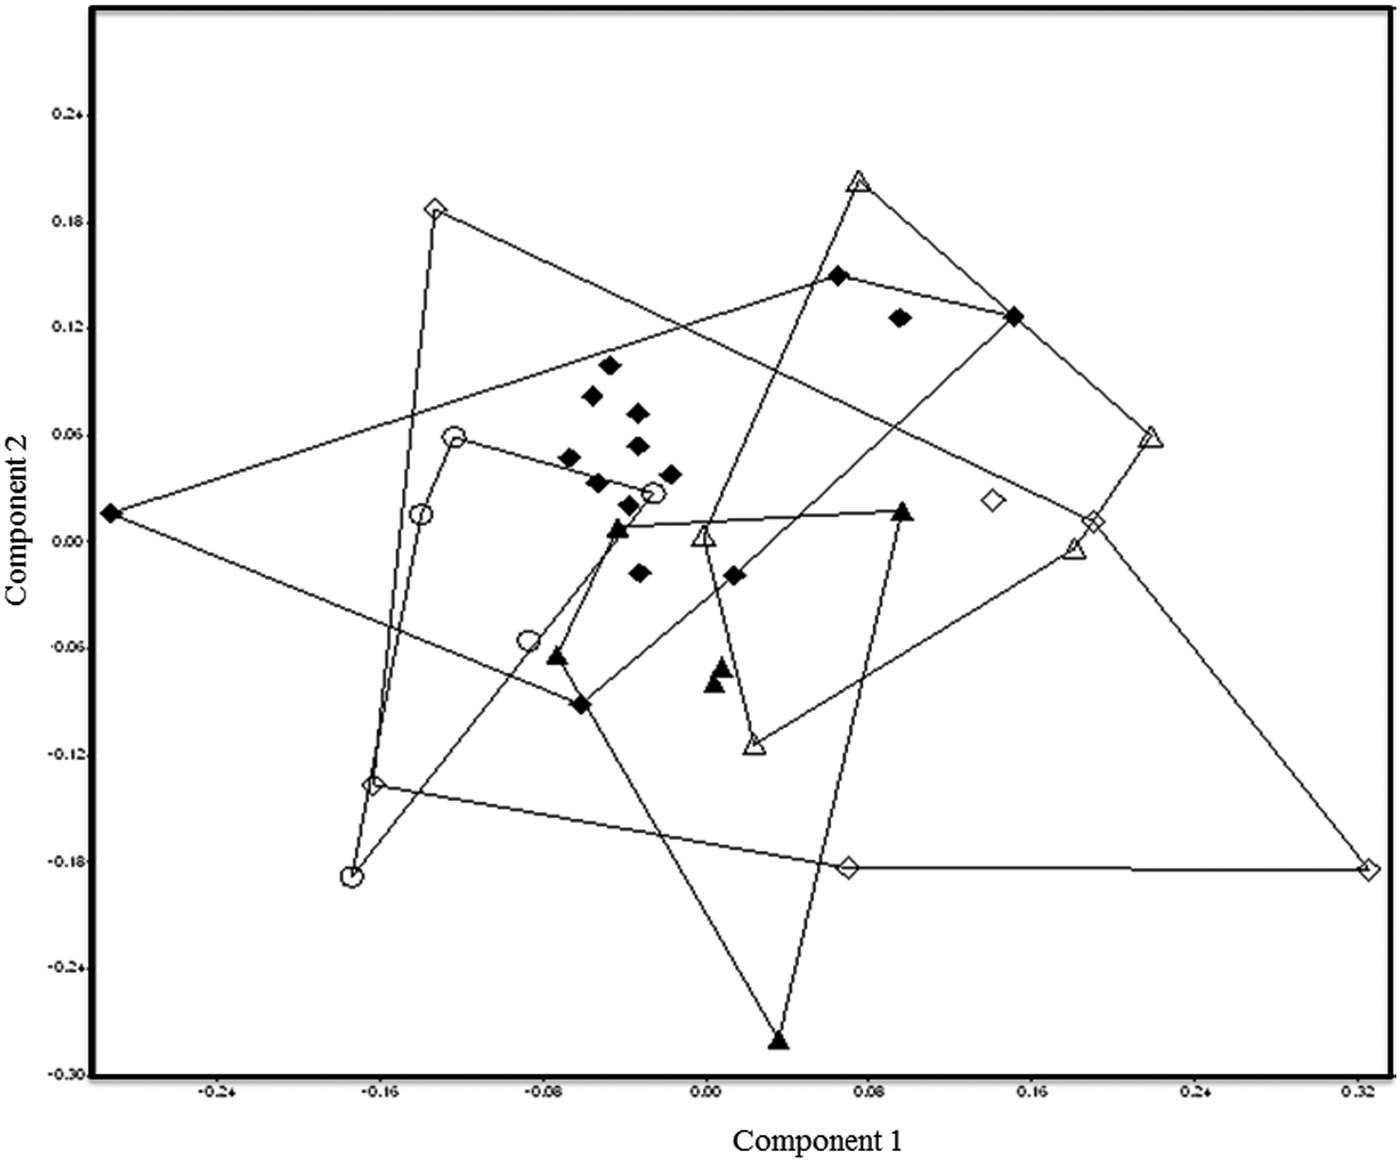
Nonmetric multidimensional scaling for sites in Northern Mexico, including: Candelaria-Paila (filled triangle); Cuatro Ciénegas (triangle); Nararachic (diamond); Paquime (filled diamond); and Tayopa (circle). Image by author.

In West Mexico, the patterns are much different than those from central Mexico. Guasave and Huejuquilla are noticeably different than the other samples from West Mexico. The sample from Zacapu is widely distributed, and many of the individuals are similar to the other samples. The other samples are distributed in small ranges, with overlaps between the samples of Autlan-Tuxcacuesco, Chalpa-Tecualilla, and Ihuatzio-Tzintzuntzan; and between Guasave and Huejuquilla.
In the Huasteca/Maya region all of the samples are similar to each other. All of the Maya samples are grouped together. The Huastec samples from Tamtok and Vista Hermosa also share some similarity with the Maya groups. Tamtok is largely distributed on Components 1 and 2, indicating a high level of within-group variation for this sample. Vista Hermosa seems widely distributed, but is actually separated into two groups on Component 1. Both groups are within the range of similarity of Tamtok, and are also plotted on the periphery of the individuals from the Maya samples.
Finally, in northern Mexico, patterns of population structure appear uncorrelated with economic or political complexity. The individuals from the Casas Grandes trade center of Paquime are very similar to each other, except for a few outliers. On the other hand, the small nomadic groups represented by the Nararachic, Cuatro Ciénegas, and Candelaria-Paila Caves are highly variable. This is particularly true for Nararachic, which is widely distributed around the range of variation of the other northern Mexican samples. The sample from Tayopa is similar to the Paquime and Nararachic samples, but different than the Cuatro Ciénegas, and Candelaria-Paila Caves samples. This result is expected, given the geographic location of the site.
DISCUSSION
The results presented here only partially support the first hypothesis that there will be more evidence of gene flow and population interaction in central Mexico, West Mexico, and the Huasteca/Maya region than in northern Mexico. The results also support the second hypothesis that there is more variation resulting from higher amounts of migration among sites that represent important economic, political, and religious centers. There is low between-site, and high within-site variation in central Mexico and the Huasteca/Maya regions, suggesting high levels of gene flow among groups facilitated through cultural interaction. During the time of the Aztec empire, much of central Mexico was incorporated into a complex system of trade, tribute, and warfare (Berdan Reference Berdan and Stuart1989, Reference Berdan2014; Berdan et al. Reference Berdan, Blanton, Boone, Hodge, Smith and Umberger1996). Large, interregional markets were located at sites such as Tlatelolco and Cholula (Berdan and Anawalt Reference Berdan and Anawalt1997; Gasco and Berdan Reference Gasco, Berdan, Smith and Berdan2003; McCafferty Reference McCafferty1996). Xochimilco and Teopanzolco also maintained active trade network and regional markets in central Mexico, independent of the Aztec Empire (Berdan Reference Berdan2014; Berdan et al. Reference Berdan, Blanton, Boone, Hodge, Smith and Umberger1996). These trade relationships extended to the Oaxaca Valley, particularly with Teopanzolco. With these relationships in mind, it is not surprising the samples from the Valley of Mexico are similar to one another. The low FST value for central Mexico argues further for frequent population interaction, facilitated through economic and political relationships. The FST values for central Mexico are low when compared with the overall FST values, and are the lowest regional FST values among the regions tested here. These results suggest gene flow and/or migration has a strong influence on population structure in central Mexico, particularly for sites with important political, economic, or religious centers.
The widely distributed sample from Tamtok indicates high levels of interregional migration and gene flow. This result is consistent with known patterns of interregional exchange based on archaeological findings at Tamtok (Córdova Tello et al. Reference Córdova Tello, Mora and Hernández Espinoza2012). All of the Maya samples are similar to each other. The high level of similarity among the Maya samples could represent gene flow and/or a shared migration history. The same is true for the similarities between the Huastec and Maya samples, although gene flow facilitated through trade would have been less direct due to geographic distance. There are no clear distinctions between the highland (Chicoasen) and lowland (Coba, Playa del Carmen, San Gervasio-Cozumel, and Tulum) Maya samples, or between the coastal or mainland samples in the nonmetric MDS analyses. Interestingly, some of the individuals from the Tulum sample are slightly different that the geographically proximate samples from Coba, Playa del Carmen, and San Gervasio-Cozumel. This result is similar to previous biological distance studies that found Tulum to be phenotypically different than samples from the Cancun region of Quintana Roo (Cucina and Tiesler Reference Cucina and Tiesler2008; Cucina et al. Reference Cucina, Ortega and Tiesler2008). These differences may be attributed to the burial population of Tulum, being excavated from palatial structures, and may represent a group of nonlocal merchants (Vargas Pacheco Reference Vargas Pacheco1982). More data from this site will help to further evaluate these interpretations in future research. The FST values for the Huasteca and Maya regions are slightly lower than the overall FST values. These results indicate there is a relatively high amount of gene flow among populations in this region, albeit not as high as in central Mexico. These results suggest at least some of the similarity among the Maya groups reflects population interaction and gene flow.
The patterns of population structure in west and northern Mexico are different than those in central Mexico and the Maya region. There are large distances between groups, as well as widely scattered and separate distributions of individuals. This result for West Mexico is surprising, since the region was also a major center for economic and political interaction. The Tarascan Empire expanded into much of West Mexico, and, unlike the Aztecs, maintained firm control of cities and resources within their imperial control (Gorenstein Reference Gorenstein, Adams and MacLeod2000; Pollard and Vogel Reference Pollard, Vogel, Hodge and Smith1994). In West Mexico, Huejuquilla and Guasave are particularly different from the other West Mexico samples. These samples are located in the West Mexico mining area, far north of the Tarascan capital of Tzintzuntzan (Gorenstein Reference Gorenstein, Adams and MacLeod2000; Weigand Reference Weigand, Webster and McBrinn2008). The sample from Chalpa-Tecualilla is also located in the mining area, but is more similar to the other West Mexico samples within and around the Tarascan Empire. The FST values are the highest for West Mexico of the four regions studied, further indicating limited gene flow among populations in this region. These similarities are consistent with archaeological evidence of high levels of interaction through trade relationships among the Pacific Coast and through Tzintzuntzan (Pollard Reference Pollard, Smith and Berdan2003; Weigand Reference Weigand, Webster and McBrinn2008). More samples from around the Patzcuaro Basin and Tarascan Empire will help further evaluate these relationships in West Mexico.
The FST values for northern Mexico are smaller than in West Mexico, but slightly larger than the overall FST values. This indicates there is some gene flow among the northern Mexico groups, but relatively low gene flow when compared with central Mexico and the Huasteca and Maya regions. The small distributions of most of the samples indicate slow within-site variation and low levels of gene flow among samples. This is particularly true for the northeast Mexican samples, where genetic drift may be the primary evolutionary force influencing phenotypic variation. In the MDS plot, Nararachic in northwest Mexico is the most widely distributed of the samples from this region. This result is surprising, since it is not a major economic or political center, although it is located along the Aztlan trade route. Migrants from both west and northwest Mexico could account for this variation. Equally surprising is the narrow distribution of most of the individuals from Paquime the center for the Casas Grandes culture, although some individuals are noticeably different than the rest of the sample. Future research incorporating more samples from the American Southwest may help to further evaluate the biological affinity of these individuals. There is also a high amount of similarity between the Paquime and Nararachic samples. The Casas Grandes culture dominated part of northwest Mexico economically (Di Peso Reference Di Peso1974; Kelley Reference Kelley, Di Peso and Ravesloot1993; Woosley and Olinger Reference Woosley, Olinger, Di Peso and Ravesloot1993), and there is evidence of warfare among the nomadic groups throughout the region (Anderson et al. Reference Anderson, Martin and Thompson2012). These relationships may have facilitated frequent interactions among these groups.
CONCLUSION
In this paper, I have attempted to evaluate the effects of political, economic, and religious structure on the evolutionary processes of gene flow and genetic drift among Postclassic Mexican populations using phenotypic data. The results show that cultural structures affect population structures, particularly in central Mexico and the Huasteca and Maya regions. This is also partially true for northern Mexico, particularly among northwest Mexican groups. Population structures in these regions are influenced by gene flow and migration. This is not true for West Mexico, based on the samples used in this study. Population structures in West Mexico, and to a lesser extent Northeast Mexico, are primarily influenced by genetic drift. These patterns are consistent with interpretations of regional population interaction based on archaeological findings. The political and economic complexity of central Mexico, particularly in the Valley of Mexico and the Maya region, likely facilitated high levels of population interaction. The similarity between the Huastec and Maya groups also support shared migration histories based on linguistic similarities (Diehl Reference Diehl1983; Stresser-Peán Reference Stresser-Peán1989). More data from the Huasteca region, as well as comparative data from other areas of the Gulf Coast will help evaluate this relationship further.
This work also highlights the importance of combining analyses of between-group and within-group variation using phenotypic data to investigate the relationship between cultural and evolutionary processes. It should be noted that the samples from central Mexico make up a large portion of the samples used to calculate the overall FST values. This could have an effect on the relatively low FST values for all samples. More data from regions outside of central Mexico, particularly from the Gulf Coast and West Mexico, will allow further evaluation of these results in future work. It is also important to note that political, economic, and religious strategies differed between central Mexico, the Maya region, and the Huasteca, though these regions appear to have similar patterns in population structure. There is not a single, regional strategy that was more favorable for migration than any other, since the different strategies employed in these regions appear to have facilitated population interaction. In light of these findings, I suggest the complex patterns of population structure in Mesoamerica are best understood when viewed through a synthesis of archaeological, ethnological, and biological data.
RESUMEN
La mayoría de lo que se conoce acerca de la estructura de la población en México durante el periodo posclásico (900 a 1520 d.C.) se basa en los datos arqueológicos. Durante este tiempo, las poblaciones estaban en contacto entre sí a través de redes comerciales que se extendían desde el suroeste de Estados Unidos a Centroamérica, y por medio de la expansión de los imperios poderosos en el centro y occidente de México. Aunque los datos arqueológicos ofrecen una gran cantidad de información acerca de estas relaciones, se sabe poco sobre los efectos de estos procesos sobre la estructura de la población y la variación biológica o si estos efectos varían según las regiones geográficas. En este estudio, observaciones morfológicas dentales se utilizan como sustituto de los datos genéticos para evaluar las diferencias en la estructura de la población entre las poblaciones regionales en todo México. Distancias biológicas y FST para las redes regionales muestran diferentes estructuras de población en el centro, oeste y norte de México, así como la región de la Huasteca / Maya. Mostramos hay una mayor similitud biológica entre los grupos en el centro de México y la región de la Huasteca / Maya, y la similitud biológica menor entre los grupos en el oeste y el norte de México. Además analiza el uso de escalamiento multidimensional no métrico indican importantes centros económicos, políticos o religiosos en el México central y la Husteca / Maya mantener alta la variación biológica entre los individuos, lo que indica una gran diversidad entre las poblaciones representadas por las muestras de entierro. La relación opuesta se encuentra en el oeste y el norte de México, aunque hay una cierta similitud entre las muestras desde el noroeste de México. Los resultados presentados aquí muestran que hay diferencias en la estructura de la población entre las regiones de todo México y que las estructuras de la población se ven afectados por los procesos económicos, políticos o religiosos. Nuestro estudio apoya las interpretaciones arqueológicas de estructura de la población a lo largo del posclásico en México y proporciona una valiosa contribución al estudio de los antiguos grupos mesoamericanos.
SUPPLEMENTARY MATERIAL
The supplementary material for this article can be found at https://doi.org/10.1017/S0956536117000013.
ACKNOWLEDGMENTS
The author is grateful to the individuals at the institutions from which data was collected for this study for their support and assistance: José Antonio Pompa y Padilla and David Volcanes, Instituto Nacional de Antropología e Historia; David Hunt, National Museum of Natural History; Estela Martinez, Guillermo Cordova, and their staff at the Escuela Nacional de Antropología e Historia; and Ian Tattersall and Gisselle Garcia, American Museum of Natural History. The author is grateful for the financial support provided by: Field Research Grants, Latin American and Iberian Institute, University of New Mexico; and the Research Collections Grant, American Museum of Natural History. The author also thanks Heather Edgar and Frances Berdan, as well as the anonymous reviewers for Ancient Mesoamerica for their valuable insights.