Introduction
Conservation resource allocation tends to be controversial due to what are often perceived as uncomfortably high levels of uncertainty about their benefits and costs (Ferraro & Pattanayak Reference Ferraro and Pattanayak2006). For example, species adapt to new environments, move to track suitable climates or go extinct as climates change (Lawler et al. Reference Lawler, Ruesch, Olden and McRae2013). Climate shifts may determine shifts in the future geographical ranges of species of conservation concern. Uncertainty of this type is important to incorporate when allocating conservation resources for biodiversity and ecosystem services because climate change poses an increasingly imminent threat to both (Woollings et al. Reference Woollings, Gregory, Pinto, Reyers and Brayshaw2012). Market fluctuations are another critical source of uncertainty related to programme costs and effectiveness because conservation cost is often tied to real estate markets (Cho et al. Reference Cho, Lee, Roberts, Yu and Armsworth2018).
Conservation resource allocation guided by historical benefit and cost data that ignore future uncertainty will adversely affect its cost efficiency (Shah et al. Reference Shah and Ando2016). To address this issue, risk-diversification strategies have been applied in the conservation literature to determine portfolios of target assets (i.e., species, sites and activities) in the context of conservation programmes that face mainly climate uncertainty but also, in part, market uncertainty (Sanchirico et al. Reference Sanchirico, Smith and Lipton2008, Ando & Mallory Reference Ando and Mallory2012, Eaton et al. Reference Eaton, Yurek, Haider, Martin, Johnson and Udell2019, Sierra-Altamiranda et al. Reference Sierra-Altamiranda, Charkhgard, Eaton, Martin, Yurek and Udell2020, Kang et al. Reference Kang, Sims and Cho2022). Despite progress in focusing on conservation risk management, conservation organizations are reluctant to interface risk-diversification strategies with their decision-making processes (Hunt & Fraschini Reference Hunt and Fraschini2020). One of the main reasons for this scepticism is that the empirical models used to develop risk-diversification strategies require the expected returns and their variances and covariances for the target assets as inputs, but the probabilities of occurrence of the scenarios needed to calculate those statistics are almost always unknown. For example, the occurrences of different climate scenarios are difficult to determine because their probabilities depend heavily on the implementation of climate change mitigation policies, which are uncertain (Ando & Mallory Reference Ando and Mallory2012).
Similarly, scenario analysis in general faces persistent controversy regarding the probabilities that should be assigned to scenarios and even whether probabilities should ever be assigned to scenarios (Millett Reference Millett2009). Studies on this subject acknowledge that determining scenario probabilities is challenging because the future is a combination of the known and the unknown or unknowable (Diebold et al. Reference Diebold, Doherty and Herring2010). Achieving consensus on plausible scenarios is rare, and thus scenario analysis should explore many possible future outcomes instead of just one (Wilson & Ralston Reference Wilson and Ralston2006). In addition, scenario analysis typically uses discrete probability distributions for scenarios because those distributions provide more deterministic solutions than continuous probability distributions (Schoemaker Reference Schoemaker1995, Maciel et al. Reference Maciel, Ballini and Gomide2018).
Not deviating widely from the scenario analysis literature, the literature on managing risk and uncertainty in systematic conservation planning employs randomly fixed probability distributions for scenario-specific target values. For example, Liang et al. (Reference Liang, Gao, Zeng, Hua, Zhong and Li2018) used a uniform probability distribution of climate scenarios in calculating target asset values to illustrate the optimal location for habitat restoration by coupling modern portfolio theory (MPT) with the Marxan model to help decision-makers build a conservation strategy for the lesser white-fronted goose. Likewise, Ando et al. (Reference Ando, Fraterrigo, Guntenspergen, Howlader, Mallory and Olker2018) applied a consistent stylized form of MPT to 26 heterogeneous conservation-investment decision cases and identified correlations between features of those cases and the success of MPT in mitigating future outcome uncertainty. The uniform probability distribution for climate scenarios is consistently used in calculating target asset values for MPT applications (Ando et al. Reference Ando, Fraterrigo, Guntenspergen, Howlader, Mallory and Olker2018).
Another branch of literature uses the estimated probabilities for the scenario-specific values of target assets. For example, Eaton et al. (Reference Eaton, Yurek, Haider, Martin, Johnson and Udell2019) estimated the probabilities of sea-level rise scenarios to calculate the expected conservation benefits and their variances and covariances under climate change risks using MPT to help allocate a budget for conservation planning strategies. Since the probabilities of scenarios in such cases are externally estimated, the optimization solutions are not subject to the random choice of probability distributions. However, collecting the needed information to estimate scenario probabilities, such as prior knowledge of conditions that might be related to the scenarios, is often challenging (Millett Reference Millett2009, Gaspars-Wieloch Reference Gaspars-Wieloch2019).
Other MPT approaches in the conservation literature assign different probability distributions to uncertainty scenarios as a sensitivity analysis (e.g., Ando & Mallory Reference Ando and Mallory2012, Dissanayake & Hennessey Reference Dissanayake and Hennessey2017). For example, Ando and Mallory (Reference Ando and Mallory2012) considered two sample probability distributions in the MPT framework for four climate scenarios (i.e., ‘no change likely’ that was weighted heavily towards historical conditions and ‘uniform’ that assumed each climate scenario is equally likely to occur). The authors then compared the optimal spatial targeting of conservation activity between the two sample probability distributions. This type of sensitivity analysis offers layers of optimal solutions with various probability distributions and allows a comparison of their implications for conservation decisions. Yet, conservation organizations need to go beyond comparing outcomes using multiple probability distributions as they give little attention to which probability distribution is most relevant to their conservation decision-making.
We examine how risk diversification for conservation is influenced by the probabilities assigned to uncertainty scenarios. We apply the MPT framework to estimate optimal portfolio weights, reflecting fractions of the total available resources to allocate to diverse locations, using the expected returns on investment (ROIs) for biodiversity conservation at the county level in the central and southern Appalachian region under climate and market uncertainties. We create probability density functions (PDFs) of the multiple optimal portfolio weights that are derived from MPT using bootstrapped probability distributions (referred to as ‘bootstrapped MPT’) of target counties at given risks. The PDFs created from the bootstrapped MPT are characterized and compared with optimal portfolio weights based on MPT with a fixed uniform probability distribution of uncertainty scenarios (referred to as ‘fixed MPT’). We also compare the vertical distances of the efficient frontiers derived from the outcomes of the two MPT models for given risks. The vertical distances in expected ROIs shed light on whether the amount of risk diversification a conservation organization can achieve, for given risks, is different for the mean of the bootstrapped MPT from that with the fixed MPT.
The development of the bootstrapped MPT is a vital contribution in its own right because it has never been applied either inside or outside of the conservation literature. The bootstrapped MPT imposes flexibility on the unknown probability distribution of uncertainty scenarios while the fixed MPT does not. A comparison of risk-mitigating portfolios with the bootstrapped and fixed PDFs using the expected ROIs for biodiversity conservation shows that introducing the flexibility of an unknown probability distribution of uncertainty scenarios allows conservation organizations to spread bets more than with the inflexibility of the fixed probability distribution, while also achieving higher expected ROIs per unit of risk on average. The improvement becomes more significant when conservation organizations are less risk averse. The bootstrapped MPT harnesses the full benefits of risk diversification and avoids potentially misleading results based on the fixed MPT. The major advantage of the bootstrapped MPT over the more traditional fixed MPT is its ability to diversify the risk associated with conservation programmes more efficiently. Our approach will allow us to determine which risk-diversification strategy provides the biggest benefit per unit of expenditure.
Study area and methods
Study area
The central and southern Appalachian region offers critical habitat for biodiversity (Levine et al. Reference Levine, Bryant, Watland and Medlock2021) and is expected to experience rapid climate change and urbanization (Rogers et al. Reference Rogers, Jantz, Goetz, Theobald, Hansen, Monohan, Theobald and Olliff2016). The region exemplifies the significance of uncertainties from climate shifts as well as timber and real estate market fluctuations. For instance, a regional climate model of downscaled temperature and precipitation patterns of the eastern USA (Gao et al., Reference Gao, Fu, Drake, Liu and Lamarque2012), including our study area, has predicted that both heatwaves and extreme precipitation will be more severe in the future. The region has also experienced large shifts in timber production and prices and real estate values. Specifically, during 1992–2011, the seasonally adjusted wood product volume index ranged between 87 and 156 and the timber price index ranged between 132 and 219 in the USA, and the housing price index varied between 102 and 245 across the South Atlantic region that covers 8 of the 10 states in our study area (US Bureau of Labor Statistics 2016).
We first describe how efficient portfolios for the bootstrapped and fixed MPT models are estimated, followed by a description of the scenario-specific ROIs. Then, we explain how different probability distributions of uncertainty scenarios are applied to both MPT models. Finally, we explain how kurtosis values are calculated.
MPT framework
The expected ROI for biodiversity conservation of county
 $i$
,
 $E\left( {ro{i_i}} \right)$
, and the covariance of the scenario-specific ROI of counties
 $i$
and
 $j$
,
 $co{v_{ij}}$
, are calculated in Equations (1) and (2), respectively:
 $$E\left( {ro{i_i}} \right) = \mathop \sum \limits_{k = 1}^s {p_k} \times ro{i_{ik}}$$
 $$co{v_{ij}} = \sqrt {\mathop \sum \limits_{k = 1}^s {p_k} \times \{ ro{i_{ik}} - E\left( {ro{i_i}} \right)\} \times \{ ro{i_{jk}} - E\left( {ro{i_j}} \right)\} } $$
where
 ${{{p}}_{{k}}}$
is the probability of uncertainty scenario
 ${{k}}$
and
 ${{ro}}{{{i}}_{{{ik}}}}$
is the ROI of the
 ${{k}}$
th uncertainty scenario of county i.
The expected ROI of county
 $i$
and covariance between counties are used to calculate the portfolio’s expected ROI,
 ${P_{roi}}$
, and its standard deviation,
 ${P_{sd}}$
, based on the allocation of portfolio weight among counties as shown in Equations (3) and (4), respectively:
 $${P_{roi}} = \mathop \sum \limits_{i = 1}^n {w_i}E\left( {ro{i_i}} \right)$$
 $${P_{sd}} = \sqrt {\mathop \sum \limits_{i = 1}^n \mathop \sum \limits_{j = 1}^n {w_i}{w_j}co{v_{ij}}} $$
where
 $n$
is the number of counties,
 ${w_i}$
is the portfolio weight in county
 $i$
and
 $co{v_{ij}}$
is the covariance of expected ROI between counties
 $i$
and
 $j$
.
The MPT framework solves for the optimal portfolio weight
 ${w_i}$
of county by minimizing the portfolio’s risk
 ${P_{sd}}$
with respect to a given portfolio’s expected ROI,
 $\overline {{P_{roi}}} $
, and the sum of
 ${w_i}$
over all counties equals 1, as framed in Equations (5)–(7):
 $$\min {P_{sd}}$$
subject to
 $${P_{roi}} = \overline {{P_{roi}}} $$
 $$\mathop \sum \limits_{i = 1}^n {w_i} = 1,\,\,\forall {w_i} 0$$
where
 ${w_i}$
of county
 $i$
cannot be negative. The grid of a given portfolio’s expected ROI starts at the global minimum standard deviation portfolio and ends at the maximum expected ROI of the county (Zivot Reference Zivot2019).
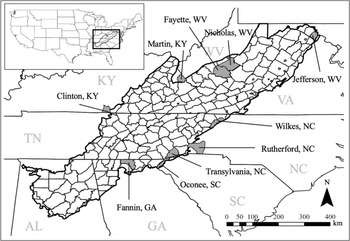
We apply the same MPT framework to the bootstrapped and the fixed MPT models by using expected ROIs and their standard deviations and covariances under 18 uncertainty scenarios for 10 counties (see the grey marked counties in Fig. 1). The 10 counties are selected from among 246 counties that are wholly or partially within the study area boundary. Ten counties (conservation planning units) are selected for the case study since the MPT cannot determine optimal solutions when the number of scenarios available (18 for our case study) is equal to or smaller than the number of conservation planning units (Ando & Mallory Reference Ando and Mallory2012). This constraint arises because the information needed to calculate the variance–covariance matrix among target sites for the solution of portfolio weights would not be sufficient (Mallory & Ando Reference Mallory and Ando2014). The 10 selected counties are those with variance–covariance matrixes containing the lowest average pairwise correlations (0.01) since the MPT works best when multiple assets have negative or low correlated outcomes across scenarios (Ando et al. Reference Ando, Fraterrigo, Guntenspergen, Howlader, Mallory and Olker2018). As a sensitivity analysis, we apply the same MPT framework using four samples of 10 counties with variance–covariance matrixes containing pairwise correlations of 0.3, 0.5, 0.7 and 1.
Study area. The 10 grey marked counties are sample counties selected for the case study.

Scenario-specific ROI
For biodiversity risk diversification of conservation investment, we first estimate expected ROIs in terms of the additional number of species that will persist per additional dollar paid for ecosystem services (PES) to protect forestland biodiversity. We focus on 258 forest-dependent vertebrate species (75 amphibians, 89 mammals, 40 reptiles and 54 birds) at the county level under 18 climate and market uncertainty scenarios for the year 2050. Forest-dependent species are chosen because forests are a prevailing natural habitat type that is threatened by land-use conversion to urban and other development in the study region (Pickering et al. Reference Pickering, Kays, Meier, Andrew, Yatskievych, Brooks and Konstant2002, McKinley et al. Reference McKinley, Belote and Aplet2019). The 258 forest-dependent vertebrate species are chosen because they are of policy concern (Landscape Conservation Cooperative Network 2020, US Fish and Wildlife Service 2020), and 2050 is chosen as the future timeframe because it is far enough in the future to allow ROIs to vary under the uncertainty scenarios.
Predicted species distributions in 2050 are acquired from the results obtained from Zhu et al. (Reference Zhu, Papeş, Giam, Cho and Armsworth2021). The authors use the Maxent species distribution model to predict the climatically suitable probability in each 1-km2 pixel for the 258 species with full dispersal assumption under future climate scenarios for intermediate and high carbon emission levels under two representative pathways (RCPs): RCP 4.5 and RCP 8.5, with the Community Climate System Model version 4 (CCSM 2019) based on the report of the fifth Intergovernmental Panel on Climate Change (IPCC 2014). The predicted probabilities of climate suitability for the pixels are converted into binary variables, indicating whether the pixels are climatically suitable or unsuitable for each species, using a 10% training presence threshold. This binarization threshold is highly conservative in estimating distributions and is suitable for identifying endemism (Escalante et al. Reference Escalante, Rodríguez-Tapia, Linaje, Illoldi-Rangel and González-López2013). It allows the pixels with the top 90% of predicted probabilities of training presence data to be considered suitable and the remaining 10% unsuitable (see Zhu et al. Reference Zhu, Papeş, Giam, Cho and Armsworth2021 for more details). The suitable areas of species at the pixel level are aggregated at the county level as the county-level predicted future species distributions.
The investment bids for the expected ROIs are estimated for each of the 10 selected counties by urban return minus forestland return (referred to as ‘relative opportunity cost’). The difference between the opportunity cost and the explicit cost is used under the assumption that the ROI is associated with the PES that protects the forestland while ensuring suitable forest management and sustainable flows of wood products (Pacific Forest Trust 2019). The urban return based on median housing price is assumed to be the opportunity cost of conserving forestland for purposes of biodiversity conservation since urban development is the dominant competing land use for forestland, and thus the urban return is the return from the best alternative use in the study area (Wear & Greis Reference Wear and Greis2013, Keyser et al. Reference Keyser, Malone, Cotton and Lewis2014). We subtract forestland return, based on timber value, from urban return since land value is equal to the net present value of the flow of land rent over time (Straka & Bullard Reference Straka and Bullard1996), and timber value is the return from one of the major flows of the wood products.
The predicted urban return is acquired from results obtained from Liu et al. (Reference Liu, Cho, Hayes and Armsworth2019) using the following procedure: (1) an autoregressive distributed lag (ARDL) model is used to forecast median housing price under three market scenarios (upturn, moderate, downturn); (2) land value ratios per hectare are estimated by dividing assessed land value per hectare by total assessed value at the parcel level for sample counties where data are available; (3) land value ratios per hectare are predicted for the counties where parcel-level data are not available; and (4) the forecasted median housing price is multiplied by the predicted land value ratio per hectare to estimate median assessed land value per hectare, which is annualized (see Liu et al. Reference Liu, Cho, Hayes and Armsworth2019 for more details).
The future annualized forest return for each of the 10 counties is acquired from the results obtained in Kang et al. (Reference Kang, Sims and Cho2022) using the following two-step procedure. In the first step, soil expectation value (SEV) is used to estimate annualized forest return under an infinite series of identical harvest rotations of 50–75 years and a discount rate of 5% with identical timber management practices. The SEV is established based on stumpage price for the prediction of timber price from TimberMart-South (TMS 2015) and division of forestry offices from eight states: Alabama (AL), Georgia (GA), Kentucky (KY), North Carolina (NC), South Carolina (SC), Tennessee (TN), Viginia (VA) and West Virginia (WV). Historical timber volume data are compiled from the Forest Inventory and Analysis (FIA) database (US Department of Agriculture Forest Service 2018; see Cho et al. Reference Cho, Lee, Roberts, Yu and Armsworth2018 for more details). In the second step, a Brownian motion model is applied to forecast timber price and per hectare harvest volume using annualized forest return and historical timber volume data from the first step based on two Special Report on Emission Scenarios (SRES: B2 and A2; Nakićenović & Swart Reference Nakićenović and Swart2000) derived from the General Circulation Model (GCM). The model forecasts the high, low and moderate timber prices as one standard deviation above and below the mean price and the mean price, respectively, for each state, with two timber volumes based on two pairs of GCM and SRES (CSIRO-MK2 with SRES B2 and CSIRO-MK3.5 with SRES A2; see Kang et al. Reference Kang, Sims and Cho2022 for more details).
In sum, the relative opportunity costs are projected for each of 10 counties under 18 total scenarios (180 projected opportunity costs) related to both climate and market uncertainties: two timber volumes, three timber prices and three market conditions. Consequently, under RCP4.5 assumptions, nine possible futures are developed (1 SRES × 1 GCM × 1 timber volume projection × 3 timber prices × 3 market conditions). Under RCP8.5 projections, nine possible futures are developed (1 SRES × 1 GCM × 1 timber volume projection × 3 timber prices × 3 market conditions).
We develop an econometric land-use model using historical data from the National Land Cover Database (NLCD 2016) and the historical relative opportunity cost data. We use forested areas at the county level that are estimated by aggregating 30-m resolution land-cover data from the NLCD. The land-use model quantifies the marginal increase in forestland resulting from a 1 dollar increase in PES through the forest-return portion of the relative opportunity cost in hectares per dollar. Using the historical marginal relationship from the land-use model and the forecasts of the relative opportunity costs under different scenarios, we forecast forestland area in each county under different scenarios in 2050.
We estimate the ROI offered by investing in a particular county in terms of predicted improvement in overall, region-wide species richness in 2050 with investment compared with what would have happened without investment. To do so, we combine predicted climatically suitable area in a county from Zhu et al. (Reference Zhu, Papeş, Giam, Cho and Armsworth2021) for a given scenario with predicted change in forestland area in the county with or without investment from the econometric land-use model described above. While the land-use change model predicts the amount of forest that will remain in the county in 2050 with or without investment, it does not predict where exactly within a given county this forest area will be located. We therefore needed to make an assumption about the co-occurrence patterns of future forested areas within counties with climatically suitable habitats for species within those counties. To do so, following the optimistic or fully nested assumption defined in Armsworth et al. (Reference Armsworth, Benefield, Dilkina, Fovargue, Jackson and Le Bouille2020), we assumed that if a county is picked in the optimization procedure, then a representative unit of habitat is protected within that county and all species found within the county are then assumed fully protected. Furthermore, to convert changes in forest within climatically suitable areas for a species into a statement about region-wide species persistence in 2050, we also needed to make an additional assumption. Following Armsworth et al. (Reference Armsworth, Benefield, Dilkina, Fovargue, Jackson and Le Bouille2020), we assumed that the persistence probability for a species increases linearly with the overall amount of forested area that is climatically suitable for the species until saturating at 1. Summing the resulting persistence probabilities across species gives an estimate of expected species richness. We calculated this measure with and without investment in each county to obtain our ROI estimates for each of our scenarios.
Table 1 depicts heterogeneity in various aspects of the 10 selected counties. Nine of the 10 counties are classified as rural counties. The sizes of the counties and their private and public forestlands exhibit substantial variations. For example, Wilkes, NC, the largest county in the sample (282 867 ha), is more than threefold greater in size than Clinton, KY, the smallest county in the sample (77 351 ha). Forestland area generally reflects the size of the county, and the ratio of private to public forestland on average over the 18 uncertainty scenarios ranges between 0 and 94 across the counties. The average of the sum of species ranges for 258 species over the uncertainty scenarios varies from 10.4 million to 40.3 million ha across the counties. Over the uncertainty scenarios, the urban return is greater than the forest return in terms of scale and variation, and thus the disparity of relative opportunity costs is dictated more by the urban return than the forest return on average over the uncertainty scenarios. Most importantly, a discernible disparity exists in the expected ROIs among the counties. Specifically, a USD 1 million investment would allow persistence of 0.0066 additional species in Clinton County, KY, which is more than eight times greater than the expected ROI in Jefferson County, WV (0.0008) on average over the uncertainty scenarios. These estimates show that a higher expected ROI is associated with a lower relative opportunity cost, and vice versa.
Heterogeneity in various aspects of the 10 selected counties. Species ranges are average values of 258 species over 18 uncertainty scenarios, and private forestland, forest return, urban return, relatively opportunity cost and return on investment (ROI) are average values over 18 uncertainty scenarios.

Probability estimates
The uniform probability distribution of uncertainty scenarios is selected for the fixed MPT since it has been most used in MPT applications for conservation decisions when the probability of each uncertainty scenario is unknown (Mallory & Ando Reference Mallory and Ando2014, Shah et al. Reference Shah and Ando2016, Ando et al. Reference Ando, Fraterrigo, Guntenspergen, Howlader, Mallory and Olker2018). The
 ${p_k}$
in Equation (1) is equal to
 ${1 \over s}$
for the uniform distribution of each uncertainty scenario, and s is determined by the total number of uncertainty scenarios for the fixed MPT.
The s is determined by the number of uncertainty scenarios sampled for the probability distributions that are generated by the bootstrap method for the bootstrapped MPT. We use a bootstrap method (Efron Reference Efron1979) to create 1000 samples of the probability distributions associated with each of the 18 uncertainty scenarios by resampling with replacement. Resampling from each of the 18 scenarios 1000 times for each of the 1000 bootstraps allows a particular uncertainty scenario to appear in the bootstrap sample multiple times whereas another uncertainty scenario may be absent from the sample for a particular scenario. Thus, the newly created bootstrap samples have different uncertainty PDFs, and the assumption is that the percentage of occurrence for each scenario becomes its probability value in the sample’s scenario PDF. The 1000 samples are applied to 1000 bootstrapped MPT models, whose optimal solutions of portfolio weights are used to derive county-specific PDFs with 95% confidence intervals for the 10 counties at various risks. We characterize the county-specific PDFs with their means and kurtosis values.
The bootstrap method is a resampling method that allows for construction of the aforementioned statistics, given the assumptions related to a distribution (Park et al. Reference Park, Dey, Ouyang, Byun and Leeds2020). The advantage of the bootstrap method is that the parametric assumptions, such as the probability distribution, are not required (Cogneau & Zakamouline Reference Cogneau and Zakamouline2013). Since our probability distributions for the uncertainty scenarios are unknown and uncertain, we apply the bootstrap method to account for the multiple likelihoods of the uncertainty scenarios.
An efficient frontier typically shows the relationship between optimal portfolios’ expected ROIs and their corresponding standard deviations representing risk levels. We normalize risk levels as percentages above the minimum standard deviation (referred to as ‘risk tolerance’) and compare efficient portfolio weights from the MPT with different bootstrapped probability distributions for given risk tolerances. Then, we derive the PDF of efficient portfolio weights for a given county with a positive portfolio weight for five risk tolerances (i.e., minimum, 10%, 30%, 50% and maximum) with 95% percentile bootstrap confidence intervals for the range between the 25th and 95th quantile values of portfolio weights among the 1000 bootstrap samples.
Kurtosis values
The kurtosis value of the county-specific probability distribution of portfolio weights at a fixed risk tolerance for the bootstrapped MPT as defined by Pearson (Reference Pearson1905) is calculated as in Equation (8):
 $$Kurtosi{s_i} = E\left\{ {{{\left( {{X_{ib}} - {\mu _i}} \right)}^4}} \right\}/\sigma _i^4$$
where Xib is the optimal portfolio weight of county
 $i$
for the bth bootstrapped sample at a fixed risk tolerance, and
 ${\mu _i}$
and
 ${\sigma _i}\;$
are the mean and standard deviation for county
 $i$
, respectively. If the kurtosis value of a distribution is high, it tends to have heavy tails, signalling outliers, while a distribution with a low kurtosis value tends to have light tails, or a lack of outliers (Westfall Reference Westfall2014).
Results
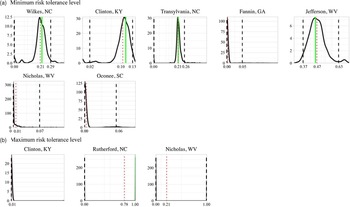
Figure 2 illustrates the PDFs of the portfolio weights using the bootstrapped MPT for the counties with positive portfolio weights and their corresponding portfolio weights using the fixed MPT at the minimum and maximum risk tolerances shown in Fig. 2a,b (see Fig. S1 for those at 10%, 30% and 50% risk tolerances). Table 2 highlights the key values from the optimal solutions of the bootstrapped MPT (i.e., mean portfolio weights, number of times the county was assigned a non-negative portfolio weight in one of the 1000 bootstrap samples and kurtosis values for the optimally selected counties) and the portfolio weights using the fixed MPT at the five risk tolerances for comparison.
Probability density distributions of the estimated portfolio weights with 95% confidence intervals (the pair of black dotted vertical lines in each graph), means of the estimated portfolio weights from the bootstrapped modern portfolio theory (MPT; red dotted vertical line in each graph) and the optimal portfolio weights from the MPT with uniform probability distributions (green vertical line in each graph) at (a) minimum and (b) maximum risk tolerances. The x-axis and y-axis in each probability density distribution are portfolio weight and probability density, respectively. Values on the x-axis are 95% confidence intervals and means of the estimated portfolio weights from the bootstrapped MPT.

Key values from the optimal solutions of the bootstrapped modern portfolio theory (MPT; i.e., mean portfolio weights, number of optimally selected counties and kurtosis values for selected counties) and portfolio weights using the fixed MPT at five risk tolerances for the 10 sample counties with the variance–covariance matrix containing the average pairwise correlations of 0.01.

a Number of times the county was assigned a non-negative portfolio weight in one of the 1000 bootstrap samples.
At the minimum risk tolerance, seven optimal counties (Wilkes, NC; Clinton, KY; Transylvania, NC; Fannin, GA; Jefferson, WV; Nicholas, WV; and Oconee, SC) are selected for the portfolio between 37 and 1000 times by the bootstrapped MPT. The kurtosis values of their probability distributions at the given risk tolerances are between 1.75 and 47.75. These findings suggest that for a given risk tolerance, the portfolio weights obtained from the bootstrapped MPT for each target county generate various PDF patterns with different outlier structures. This variation results from differences in the ways in which the probabilities assigned to the uncertainty scenarios alter expected ROIs and standard deviations, thus affecting the covariance structures differently.
By comparison, only four counties are selected for the portfolio using the fixed MPT, while three counties selected by the bootstrapped MPT model are not selected using the fixed MPT model. Overall, the counties selected by both models have relatively low kurtosis values (7.97 on average) with more normal PDFs of the portfolio weights and are optimally chosen by the majority (97%) of the 1000 bootstrapped MPT models. In contrast, the counties selected only by the bootstrapped MPT model are optimally chosen by fewer than the majority (35%) of the 1000 bootstrapped MPT models and have relatively higher kurtosis values (27.29 on average) with relatively skewed PDFs of the portfolio weights (Fig. 2).
At maximum risk tolerance, a single county, Rutherford, NC, is optimally selected by the fixed MPT, while the means of the portfolio weights with the bootstrapped MPT are distributed between Rutherford, NC, Nicholas, WV and Clinton, KY at c. 70%, 30% and less than 1%, respectively. Although the discrepancies between the two models’ optimal solutions at other risk tolerances are difficult to generalize in terms of expected ROIs because their standard deviations and covariances influence them simultaneously, the discrepancy in ROIs between the two models’ optimal solutions at the maximum risk tolerance can be explained relatively simply. For example, at maximum risk tolerance, Rutherford, NC has the largest expected ROI for the fixed MPT, whereas Rutherford, NC and Nicholas, WV have the largest expected ROIs, respectively, for 70% and 30% of the 1000 samples from the probability distributions of the 18 uncertainty scenarios using the bootstrapped MPT.
Also notable is that the number of counties selected in optimal portfolios is consistently higher with the bootstrapped MPT than with the fixed MPT across the five risk tolerances. For example, seven, six, three, three and three counties are selected with the bootstrapped MPT at the minimum, 10%, 30%, 50% and maximum risk tolerances, respectively. Of these optimally selected counties, only four, four, two, two and one counties are selected, respectively, by the fixed MPT at the corresponding risk tolerances. These findings suggest that the bootstrapped MPT allows flexibility in the unknown probability distribution of the uncertainty scenarios, while the fixed MPT does not. Thus, the output from the bootstrapped MPT suggests that a conservation organization could more optimally spread its budget across more bets than if the fixed MPT were used for decision-making.
Figure 3 illustrates the expected ROI–risk tolerance relationship with two efficient frontiers based on the average expected ROIs of the optimal solutions and their standard deviations obtained from the bootstrapped and fixed MPTs. Both efficient frontiers are upward sloping and concave downward, implying that benefit increases as risk increases, but at a decreasing rate, regardless of the probability distribution of the uncertainty scenarios. This illustrates how allowing flexibility in the probability distribution of the uncertainty scenarios by employing the bootstrapped MPT, compared to the fixed MPT, impacts the expected ROIs at given risks (Fig. 3). The vertical distances between the two efficient frontiers illustrate differences in the expected ROIs between the MPT frameworks at given risks. The vertical distances between the efficient frontiers are largest (even greater than at 1.0) between c. 0.1 and 0.2 risk tolerances, and those distances favour the fixed MPT (Fig. 3). Differences are still close to zero at risk tolerances between 0.2 and c. 0.4, even though the bootstrapped MPT has higher ROI. Between risk tolerances of 0.4 and 1.0, the bootstrapped MPT is higher, and increasingly so, than the fixed MPT. These findings suggest that the bootstrapped MPT achieves higher expected ROI per unit of risk on average than the fixed MPT for risk tolerances greater than c. 0.2 when a conservation organization can accept higher risk. The results also suggest that the fixed MPT would provide ROIs per unit of risk that are at least as high as those for the bootstrapped MPT for organizations that are more risk averse than c. 0.2. In summary, the results suggest that a conservation organization might want to estimate the bootstrapped MPT if it wants to let the results inform its decisions about the amount of risk–return it might be willing to accept.
The expected return on investment (ROI)–risk tolerance relationship with two efficient frontiers based on the average expected ROIs and their standard deviations of the optimal solutions from the bootstrapped modern portfolio theory (MPT) and the fixed MPT.

The sensitivity analysis using the four alternative samples of 10 counties reaffirms what is found using our main sample counties: (1) the counties selected by both models have relatively low kurtosis values with more normal PDFs; (2) at maximum risk tolerance, a single county is optimally selected by the fixed MPT, while multiple counties are selected using the means of the portfolio weights from the bootstrapped MPT; (3) the number of counties selected as optimal portfolios is consistently equal or higher with the bootstrapped MPT than with the fixed MPT across the five risk tolerances; and (4) the bootstrapped MPT achieves equal or higher expected ROIs per unit of risk on average, and the gap increases with risk tolerance (see Figs S2–S9 & Tables S1 & S2).
Discussion and conclusion
The comparison of risk-mitigating portfolios from the bootstrapped and fixed probability distributions shows that imposing flexibility of an unknown probability distribution of uncertainty scenarios allows conservation organizations to spread bets across more counties. Allowing the flexibility of the bootstrapped distribution achieves higher expected ROI per unit of risk on average than not allowing flexibility as with the fixed probability distribution. The improvement becomes more significant when conservation organizations are willing and able to accept higher risk. The bootstrapped MPT is useful for risk-diversifying spatial targeting under unknown probabilities of uncertainty scenarios, especially when conservation organizations choose to accept relatively higher risk tolerances greater than 0.2.
Comparing the bootstrapped and the fixed MPT outcomes under various risk tolerances demonstrates the susceptibility of assuming a uniform probability distribution to the risk-mitigating portfolios. It helps conservation organizations evaluate risk-diversifying strategies with a flexible unknown probability distribution of uncertainty scenarios. Although the bootstrapped MPT does not offer a single portfolio weight for a selected county at a given risk tolerance, which in contrast can be obtained from the fixed MPT, it offers county-specific PDFs with means and kurtosis values of portfolio weights.
The county-specific PDFs of portfolio weights from the bootstrapped MPT for a given risk tolerance can identify ranges of optimal portfolio weights associated with the risk-mitigating allocation of conservation investment. Instead of accepting the possibility of misleading optimal solutions from the fixed MPT, the information from the county-specific PDFs may be preferred because it allows flexibility in the ranges of bets. For example, given county-specific PDFs, a conservation organization can choose the ranges of fractions of the overall available budget to allocate to the optimally selected counties.
The option to choose from a range of portfolios with a conservation organization’s flexibility to choose different target areas is required for this approach to be beneficial. Such flexibility is allowed for conservation trust funds and revolving loan funds that have become mainstays of the land protection movement in the USA and elsewhere (Briand & Carret Reference Briand and Carret2012, Lennox et al. Reference Lennox, Fargione, Spector, Williams and Armsworth2017, Fovargue et al. Reference Fovargue, Fisher, Harris and Armsworth2019). The bootstrapped MPT is also particularly useful when the risk of losing species is relatively large, such as some highly threatened salamanders in our case study region. Failing to protect the areas comprising such species by following historical benefit and cost data that ignore future uncertainty potentially would lead to high risk of losing those threatened species in those areas.
Despite the contribution of our study, one caveat is worth mentioning regarding future research. A conservation organization attempting to protect species is typically limited by physical constraints, and our bootstrapped MPT model is framed without accounting for the upper and lower bounds of returns from conservation investments in target counties. Incorporating upper and lower bound constraints in the bootstrapped MPT model would limit the ranges of the bets, narrowing the target portfolio weights. For example, return on conservation investment for forest-dependent species is clearly bounded by the forested area that can be protected for a given area. Likewise, the carrying capacity of a fully functioning ecosystem would narrow the target portfolio weights of conservation investments. On the other hand, in some circumstances, including lower bounds is also necessary. For example, if the application of the bootstrapped MPT for biodiversity conservation involves creating portfolios of species, the possibility of significantly small or zero portfolio weights may be problematic. The concern is that the possibility of small or zero weights would potentially lead to poor ecological outcomes, in which a whole group of species could be lost following such suggestions. Thus, future research could consider developing a bootstrapped MPT model that accommodates both upper and lower bound constraints.
Our data could support much larger numbers of uncertainty scenarios and counties up to maxima of 486 scenarios and 246 counties, respectively, by further varying the GCM, SRES and timber volume projections as was done in Kang et al. (Reference Kang, Sims and Cho2022). Yet, we reduce the number of scenarios and create multiple samples of counties for both MPT models based on different average pairwise correlations of the variance–covariance matrix to determine the suitability of the MPT application (Ando et al. Reference Ando, Fraterrigo, Guntenspergen, Howlader, Mallory and Olker2018). The downside of applying the MPT using the smaller number of assets is that its outcome only supports situations with smaller portfolios. This constraint may be a substantial limitation for applications where conservation organizations are evaluating portfolios from a field of assets far larger than 10, as opposed to other situations where evaluating fewer than 10 assets is not an issue. However, the smaller numbers of scenarios and counties are not significant concerns for this study. Instead, they allow us to apply both MPT models using multiple samples of counties with different variance–covariance matrix structures with minimum computational complexity.
Another caveat is that the use of county-level relative opportunity costs does not include maintenance costs, which may be important to consider in conservation planning for cases where the relative opportunity costs are similar but the maintenance costs vary significantly across counties. For example, the maintenance costs of habitat may be different across counties and can lead to significantly different total costs if relative opportunity costs are similar. An analysis that considers costs of ongoing management associated with maintaining conservation benefits is another future research direction for the bootstrapped MPT application.
Supplementary material
For supplementary material accompanying this paper visit https://doi.org/10.1017/S0376892923000231.
Acknowledgements
We gratefully acknowledge B Wilson, J Menard, L Lambert, T Kim, S Kwon, J Mingie, S Moon, PR Armsworth, C Sims, M Soh, OF Bostick, JG Welch, M Papes, G Zhu, Y Lee, BP Sharma and X Giam for helpful discussions and data support.
Financial support
We gratefully acknowledge the Agriculture and Food Research Initiative Competitive Grant No. R111216362 and No. W5133 from the USDA National Institute of Food and Agriculture through the projects ‘Dynamic portfolios of spatial and temporal forest-based biodiversity conservation’ and ‘Economic Valuation and Management of Natural Resources on Public and Private Lands’, respectively.
Competing interests
The authors declare none.
Ethical standards
None.