Introduction
The biological stress system produces a multifaceted regulatory response to physiological and psychological threats to homeostasis (Stratakis & Chrousos, Reference Stratakis and Chrousos1995). Within seconds of stressor onset, the hypothalamic–pituitary–adrenal (HPA) axis releases corticotropin-releasing hormone from the hypothalamus, stimulating the pituitary to release adrenocorticotropic hormone, which in turn stimulates release of glucocorticoids (specifically, cortisol, in humans) from the adrenal cortex. Glucorticoids have wide-ranging effects on physiology, including suppressing immune function and gonadal function, stimulating cardiovascular function, and elevating blood glucose (Chrousos, Reference Chrousos1995; Sapolsky et al. Reference Sapolsky, Romero and Munck2000). Moreover, glucocorticoids pass into the central nervous system, where there are several neural regions containing high densities of glucocorticoid receptors (Lupien et al. Reference Lupien, McEwen, Gunnar and Heim2009).
As the key end-product of the HPA axis stress response with highly active effects on brain function, cortisol has become a leading candidate physiological mechanism for the effects of both chronic and acute stress on psychiatric health and psychopathology. HPA dysregulation, as indexed by cortisol concentrations in serum, saliva or urine, has been linked with chronic stressors and history of major trauma (Miller et al. Reference Miller, Chen and Zhou2007), and has been concurrently and prospectively associated with a range of psychiatric symptomologies and disorders, including depression, anxiety and post-traumatic stress disorder (Heim et al. Reference Heim, Newport, Mletzko, Miller and Nemeroff2008; Lupien et al. Reference Lupien, McEwen, Gunnar and Heim2009; Vrshek-Schallhorn et al. Reference Vrshek-Schallhorn, Doane, Mineka, Zinbarg, Craske and Adam2012). Animal models that experimentally manipulate the social environment have found that HPA dysregulation is associated with brain atrophy and with suppression of signals for neurogenesis and synapse formation (Meaney, Reference Meaney2003). Moreover, in animal models, administering exogenous glucocorticoids produces similar deleterious effects on neural structure (Lupien et al. Reference Lupien, McEwen, Gunnar and Heim2009).
Overcoming methodological challenges in measuring HPA function using hair samples
That cortisol output follows a pattern of diurnal variation complicates research on the role of chronic HPA function in stress and psychopathology. Diurnal variation typically begins with cortisol levels rising in the early morning, peaking immediately after waking, and declining through the day and evening. Cortisol levels measured in blood and saliva closely track diurnal patterns of output, and urinary levels reflect output over periods of 12–48 h (Russell et al. Reference Russell, Kirschbaum, Laudenslager, Stalder, de Rijke, van Rossum, van Uum and Koren2015). Because of this diurnal variation, single samples of cortisol in bodily fluids confound temporally stable individual differences in basal cortisol levels with intra-individual fluctuations. Researchers, therefore, typically attempt to index chronic levels of HPA function by taking repeated salivary samples across the day and over multiple days (Adam & Kumari, Reference Adam and Kumari2009), a costly approach that imposes participant burden, and carries the risk of participant non-compliance and dropout. Although repeated measurements of cortisol across the day are necessary for estimating elements of diurnal rhythm such as the cortisol awakening response or diurnal cortisol decline (Stalder et al. Reference Stalder, Kirschbaum, Kudielka, Adam, Pruessner, Wüst, Dockrya, Smyth, Evans, Hellhammer and Miller2016), they only provide an indirect index of long-term average or basal cortisol output.
Recently, researchers have developed methods for the analysis of cortisol accumulations in hair samples collected non-invasively at the time of the laboratory visit (Gao et al. Reference Gao, Kirschbaum, Grass and Stalder2015). Cortisol is hypothesized to be incorporated into the hair primarily via passive diffusion from blood capillaries surrounding the hair follicle (Stalder & Kirschbaum, Reference Stalder and Kirschbaum2012). Hair cortisol captures the accumulation of free cortisol over several months (Russell et al. Reference Russell, Kirschbaum, Laudenslager, Stalder, de Rijke, van Rossum, van Uum and Koren2015). Internal consistency estimates as estimated using duplicate sampling are above 0.90 (Stalder et al. Reference Stalder, Steudte, Miller, Skoluda, Dettenborn and Kirschbaum2012), month-long test–retest consistencies are above 0.80 (Short et al. Reference Short, Stalder, Marceau, Entringer, Moog, Shirtcliff, Wadhwa and Buss2016), and year-long test–retest consistencies are over 0.70 (Stalder & Kirschbaum, Reference Stalder and Kirschbaum2012). Hair cortisol concentrations have been estimated to correspond at over 0.60 with estimates of total cortisol output from thrice-daily sampling of saliva taken over a 1-month period (Short et al. Reference Short, Stalder, Marceau, Entringer, Moog, Shirtcliff, Wadhwa and Buss2016), but convergent validity is much lower for urinary sampling (Sauvé et al. Reference Sauvé, Koren, Walsh, Tokmakejian and Van Uum2007; Short et al. Reference Short, Stalder, Marceau, Entringer, Moog, Shirtcliff, Wadhwa and Buss2016) and for salivary estimates taken over periods of 3–4 days (Xie et al. Reference Xie, Gao, Li, Qiao, Jin, Deng and Lu2011), which are currently considered best practices. Hair cortisol concentrations are robust to a number of possible confounds, including natural hair color, oral contraceptive use, smoking, use of everyday hair products and frequency of hair washes (Dettenborn et al. Reference Dettenborn, Muhtz, Skoluda, Stalder, Steudte, Hinkelmann, Kirschbaum and Otte2012). Hair cortisol is associated, as expected, with known disrupters of normal HPA functions, including shift work, Cushing syndrome and post-traumatic stress disorder (Staufenbiel et al. Reference Staufenbiel, Penninx, Spijker, Elzinga and van Rossum2013). Some studies have also reported a negative association between hair cortisol and socio-economic status (SES) in children (Vaghri et al. Reference Vaghri, Guhn, Weinberg, Grunau, Yu and Hertzman2013; Rippe et al. Reference Rippe, Noppe, Windhorst, Tiemeier, van Rossum, Jaddoe, Verhulst, Bakermans-Kranenburg, van Ijendoorn and van den Akker2016; Vliegenthart et al. Reference Vliegenthart, Noppe, van Rossum, Koper, Raat and van den Akker2016) and in adults (Serwinski et al. Reference Serwinski, Salavecz, Kirschbaum and Steptoe2016). However, null associations between SES and hair cortisol have also been reported (Bosma et al. Reference Bosma, Golsteyn, Groffen, Schils, Stalder, Syurina, Borghans and Feron2015; Staufenbiel et al. Reference Staufenbiel, Andela, Manenschijn, Pereira, van Rossum and Biermasz2015).
Unclear role of genetic variation in HPA axis function
Although variation in HPA axis output is most commonly discussed as a biomarker for exposure to environmental stress, genetic variation is also a potential contributor to heterogeneity in HPA axis output (Stratakis et al. Reference Stratakis, Sarlis, Berrettini, Badner, Chrousos, Gershon and Detera-Wadleigh1997; Miller et al. Reference Miller, Chen and Zhou2007; Lupien et al. Reference Lupien, McEwen, Gunnar and Heim2009). Indeed, the biological pathways from gene sequence to cortisol production, reception and regulation are well studied, and polymorphisms in these cortisol-relevant genes may account for heterogeneity in HPA function and cortisol output (Ising & Holsboer, Reference Ising and Holsboer2006; Redei, Reference Redei2009; Cole, Reference Cole2010). However, biomarkers of HPA function are not currently available in samples of genotyped individuals that are sufficiently large for a well-powered genetic association study of quantitative traits (Velders et al. Reference Velders, Kuningas, Kumari, Dekker, Uitterlinden, Kirschbaum, Hek, Hofman, Verhulst, Kivimaki and Van Duijn2011; Bolton et al. Reference Bolton, Hayward, Direk, Lewis, Hammond, Hill, Anderson, Huffman, Wilson, Campbell and Rudan2014).
For many psychiatrically relevant phenotypes, only a small subset of the specific genetic polymorphisms that constitute genetic risk have been identified, but vast literatures from twin and family designs provide precise, replicable estimates of heritability and genetic covariance with other phenotypes. For HPA axis function, however, even this basic information is lacking, as there has been relatively little research from genetic epidemiology on glucocorticoid output. A 2003 review identified only 12 genetically informative studies of cortisol (Bartels et al. Reference Bartels, Van den Berg, Sluyter, Boomsma and de Geus2003). These studies were limited by failures to account for the cortisol diurnal rhythm, small sample sizes (no study exceeded 150 twin pairs) and a lack of methodological consistency. There have been a handful of more recent twin studies of salivary cortisol, most notably a study of 700 individuals from 309 twin families (Kupper et al. Reference Kupper, de Geus, van den Berg, Kirschbaum, Boomsma and Willemsen2005), and another study of 446 twin pairs (Van Hulle et al. Reference Van Hulle, Shirtcliff, Lemery-Chalfant and Goldsmith2012). Overall, heritability estimates of salivary cortisol have been moderate, with the largest heritability estimates found for samples taken at waking (about 30–40%), and somewhat lower estimates for samples taken later in the day (about 0–20%). Whether these estimates, which may be downwardly biased by transient fluctuations in cortisol, generalize to overall cortisol output over a period of months is an open question.
Genetic influences on chronic HPA function may vary across subgroups. In animal models, marked sex differences exist in HPA activity, in the direction of greater glucocorticoid output in females compared with males. Moreover, sex hormones may modulate HPA function (Viau & Meaney, Reference Viau and Meaney1991; McCormick & Mathews, Reference McCormick and Mathews2007). Low SES has also been linked to HPA dysregulation (Dowd et al. Reference Dowd, Simanek and Aiello2009), and genetically influenced heterogeneity in reaction norms to stressful socio-economic contexts (i.e. a ‘diathesis–stress’ pattern) would be expected to produce a link between low SES and increased heritability of cortisol (Monroe & Simons, Reference Monroe and Simons1991). Age has been reported to be associated with HPA function, in the direction of greater glucocorticoid output in adolescents compared with children and adults (McCormick & Mathews, Reference McCormick and Mathews2007). Age may also modulate genetic and environmental influences on HPA activity, because of heterogeneity in exposure and responsivity to long-term stressors over time (Miller et al. Reference Miller, Chen and Zhou2007). Finally, genetic influence on HPA function may be activated by biological changes associated with puberty, and by stressful challenges associated with navigating social transitions across development. Overall, the extent to which individual differences in chronic HPA axis function reflect genetic differences between people, and the extent to which these genetic influences vary across subgroups, is critical information for researchers attempting to understand the relationships between genotype, chronic environmental stress and psychiatric outcomes.
Goals of the current study
Using data from an ethnically and socio-economically diverse population-based sample of over 1000 3rd- to 12th-grade twins, the current article reports results from a genetic epidemiological study of long-term HPA function, as indexed with endocrine assays of hair (Stalder & Kirschbaum, Reference Stalder and Kirschbaum2012). We examine both cortisol, the primary active glucocorticoid in humans, and cortisone. In humans, cortisol is metabolized into the inactive cortisone form, which can, in turn, be converted back to active cortisol (Stewart et al. Reference Stewart, Boulton, Kumar, Clark and Shackleton1999; Quinkler & Stewart, Reference Quinkler and Stewart2013; Rippe et al. Reference Rippe, Noppe, Windhorst, Tiemeier, van Rossum, Jaddoe, Verhulst, Bakermans-Kranenburg, van Ijendoorn and van den Akker2016). We estimate the main effects of biological sex, family SES and age on hair cortisol and cortisone, and interaction effects of these three factors with one another and with latent genetic and environmental components of hair cortisol and cortisone variation and covariation. This is, to our knowledge, the first genetic epidemiological study of hair markers of neuroendocrine hormones, the largest twin study of neuroendocrine concentrations in any tissue type, and among the largest studies of neuroendocrine concentrations in hair to date (see Feller et al. Reference Feller, Vigl, Bergmann, Boeing, Kirschbaum and Stalder2014; Staufenbiel et al. Reference Staufenbiel, Andela, Manenschijn, Pereira, van Rossum and Biermasz2015; Rippe et al. Reference Rippe, Noppe, Windhorst, Tiemeier, van Rossum, Jaddoe, Verhulst, Bakermans-Kranenburg, van Ijendoorn and van den Akker2016 for other large-scale studies of hair cortisol in singletons).
Method
Twin pairs participated in the Texas Twin Project (Harden et al. Reference Harden, Tucker-Drob and Tackett2013), an ongoing study of school-age twins and multiples, residing in the Austin and Houston, Texas metropolitan areas. Participants ranged in age from 7.80 to 19.47 years of age (mean = 12.42, s.d. = 2.78 years). The research was approved by the Institutional Review Boards at the University of Texas at Austin and the University of Houston. Informed parental consent and informed consent/assent were obtained for all participants. Two female participants reported endocrine disorders and were excluded from analyses. The final sample consisted of 1141 individuals forming 607 pairs from 556 unique families. In order for a pair to be included in the current analyses, at least one member must have provided a usable hair sample. Of the 1141 individuals in the sample, 1070 individuals provided usable hair samples for the cortisol and cortisone assay. Of the 607 pairs included, there were 533 pairs in which both members provided usable hair samples. Two families had two sets of twins, one family had quadruplets who contributed six pairwise contributions, 21 families had triplets who contributed three pairwise comparisons, and two families had triplets where only one triplet provided hair, resulting in two pairwise combinations. The final sample consisted of 188 monozygotic (MZ) pairs (110 female, 78 male) and 419 dizygotic (DZ) pairs (114 female, 82 male, 223 opposite-sex). Of the sample, 65% were non-Hispanic white, 5% of participants were African-American, 18% of participants were Hispanic, and 12% of participants were another race/ethnicity or multiple race/ethnicities. Of the participating families, 34% reported receiving some form of means-tested public assistance, including food stamps, since the twins’ birth.
As this is an ongoing study, sample sizes increase annually. We decided to conduct the current analyses at this point in time because, at a sample size of over 600 pairs, we were positioned to publish the largest genetic epidemiological study of hormone concentrations in any tissue type. An a priori power analysis indicated that, with 600 pairs, a bivariate ACE model could detect genetically, shared environmentally, and non-shared environmentally mediated correlations of r = 0.225 at α < 0.05, with 85% or greater power.
Measures
Zygosity
Opposite-sex pairs were classified as DZ. For same-sex pairs, zygosity was assessed using a questionnaire concerning the twin's physical similarities (e.g. facial appearance) and the frequency that they are mistaken for one another (Rietveld et al. Reference Rietveld, van Der Valk, Bongers, Stroet, Slagboom and Boomsma2000). Twins over 14 years old completed the zygosity questionnaire, and at least one parent and two research assistants completed the questionnaire for all twin pairs. Responses from all raters were entered into a latent class analysis (LCA) to obtain the above classifications. LCA of physical similarity ratings has been reported to accurately determine zygosity greater than 99% of the time, as validated by genotyping (Heath et al. Reference Heath, Nyholt, Neuman, Madden, Bucholz, Todd, Nelson, Montgomery and Martin2003).
Hair steroid analyses
Hair samples were collected to determine cortisol and cortisone concentrations. On the day of the appointment, participants were instructed not to use any hair products that are not rinsed out of the hair. Samples were only collected if the participants’ hair was at least approximately 3 cm in length. A section of hair strands approximately 3 mm in diameter was cut as close to the scalp as possible from a posterior vertex position (i.e. the center of the back of the head). Samples were analysed at the laboratory of one of the authors (C.K.) using liquid chromatography–tandem mass spectrometry, as previously described (Gao et al. Reference Gao, Kirschbaum, Grass and Stalder2015). The 3 cm hair segment closest to the scalp was used for analyses. This hair segment is taken to represent cortisol and cortisone secretion over the most recent 3-month period (Stalder & Kirschbaum, Reference Stalder and Kirschbaum2012).
SES
Years of parental education were averaged together and standardized; log-income was standardized; and the transformed education and income variables were averaged and standardized to create an SES composite. SES composites were available for 1016 of the 1070 participants who provided usable hair samples.
Data preparation
Age was centered at 8 years to reflect its lowest observed integer value, sex was effects coded (female = −0.5, male = 0.5), and SES was standardized. To correct positive skew, log and square root transformations were applied to cortisol and cortisone, respectively. Outliers were separately winsorized for males and females by replacing extreme values with the highest observed scores within 3 s.d. of the mean. This involved replacing 19 female and eight male outliers for cortisol, and 10 female and 11 male outliers for cortisone. As assays are performed annually, outcomes were residualized for the year the hair samples were assayed (treated as a nominal variable) to control for batch effects. Finally, the transformed winsorized cortisol and cortisone values were standardized relative to the respective standard deviations of their residuals from regressions of cortisol and cortisone on age and age-squared.
Model estimation
Models were estimated with full information maximum likelihood using Mplus (Muthén & Muthén, Reference Muthén and Muthén1998). For descriptive statistics, phenotypic models were fit using the complex survey option to correct standard errors for nesting of individuals within families. For the biometric models, the complex survey option was used to correct standard errors for the dependency between sibling pairs within triplet and quadruplet sets. Nested models were compared using Satorra–Bentler scaled χ2 difference tests (Satorra, Reference Satorra, Heijmans, Pollock and Satorra2000). Models were also compared using the Akaike information criterion (Akaike, Reference Akaike1974) and the Bayesian information criterion.
Ethical standards
All procedures contributing to this work comply with the ethical standards of the relevant national and institutional committees on human experimentation and with the Helsinki Declaration of 1975, as revised in 2008.
Results
Descriptive statistics
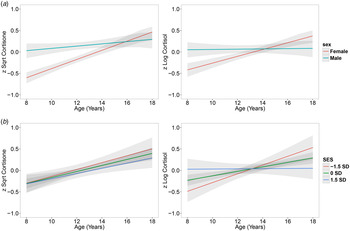
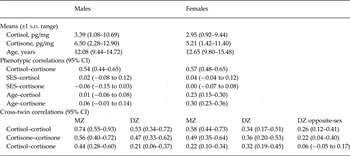
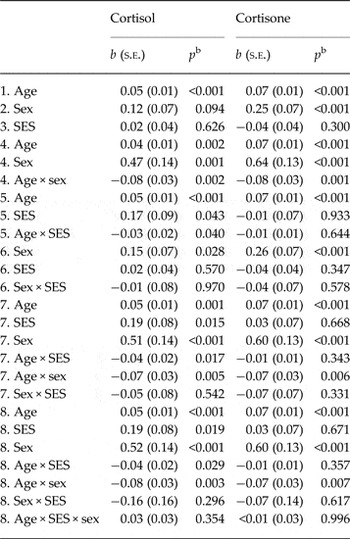
Variable means, phenotypic correlations and cross-twin correlations are reported in Table 1. Results from a series of step-wise regressions in which age, SES, sex and their interactions were used to predict cortisol and cortisone are presented in Table 2. Main effects were initially examined in isolation, followed by two-way interactions and the three-way interaction (age × sex × SES). As quadratic effects of age were not significant for either cortisone or cortisol in either the sex-pooled data or sex-specific analyses, age2 was not included in the stepwise regression models reported here. For cortisol and cortisone, there were significant effects of age and an age × sex interaction. Females had lower levels of cortisol and cortisone relative to males at age 8 years, but female glucocorticoid levels were more strongly related to age such that concentrations were slightly higher in females than in males by age 18 years (Fig. 1). A regression model that included only SES indicated it was not associated with cortisol or cortisone. A regression model that included an age × SES interaction indicated that SES moderated age gradients in cortisol, but not cortisone. Individuals in low-SES environments had lower levels of cortisol at age 8 years, but the effect of age on increasing cortisol was heightened at low levels of SES such that cortisol was highest in the low-SES group by age 18 years (Fig. 1). A three-way age × sex × SES interaction was not significant.
Moderated age trends in mean levels of cortisone and cortisol by sex (a) and standardized socio-economic status (SES) at low (−1.5 s.d.), average (0 s.d.) and high (+1.5 s.d.) levels. (b) As described in the data preparation section, cortisone and cortisol were square root (Sqrt) and log transformed, respectively, winsorized and standardized. Gray bands represent 95% confidence intervals.

Descriptive statistics, phenotypic correlations and cross-twin correlations a

s.d., Standard deviation; CI, confidence interval; SES, socio-economic status; MZ, monozygotic; DZ, dizygotic.
a Sample means and ±1 s.d. ranges were computed after cortisol and cortisone were square root and log transformed, respectively, and winsorized. We then exponentiated (cortisol) or squared (cortisone) the calculated values in order to return them to their original metrics. Cross-twin and phenotypic correlations were estimated from models that controlled for sex-specific linear effects of age. For cross-twin and phenotypic correlations, cortisone and cortisol were square root and log transformed, respectively, and winsorized.
Results from a series of stepwise regressions predicting cortisol and cortisone a

s.e., Standard error; SES, socio-economic status.
a Numbering in the left-hand column indicates predictors that were included in the same regression model. Age was centered about the lowest observed integer value of 8 years. Cortisol and cortisone were log and square root transformed, respectively, and winsorized. SES, cortisol and cortisone were standardized to have a mean of 0 and standard deviation of 1. Sex was effects coded (female = −0.5, male = 0.5).
b p Value = two-tailed probability of type I error.
Race/ethnicity differences in hormone levels were tested by entering three dummy-coded variables into a linear regression with Caucasian participants as the reference group. There was a significant effect of African-American race on cortisol (d = 0.78, s.e. = 0.24, p = 0.002), but not for Hispanic ethnicity (d = −0.02, s.e. = 0.10, p = 0.89) or for the other/multiple race/ethnicity variable (d = −0.05, s.e. = 0.12, p = 0.65). There were significant effects of Hispanic ethnicity (d = 0.22, s.e. = 0.10, p = 0.04) and other/multiple race/ethnicity (d = 0.25, s.e. = 0.11, p = 0.03) on cortisone, but not of African-American race (d = 0.24, s.e. = 0.19, p = 0.22).
Moderated biometric models
We estimated a series of three-group (MZ, same-sex DZ, opposite-sex DZ) bivariate correlated biometric factors models to estimate additive genetic (A), shared environmental (C) and non-shared environmental (E) variance components (online Supplementary Fig. S1). Within a phenotype, the A factors are fixed to be correlated at 1.0 and 0.5 in MZ and same-sex DZ twins, respectively. The C factors are, by definition, fixed to correlate at 1.0 within a phenotype in all same-sex twin pairs. As the E factors capture all variance not shared between MZ twins, including error variance, they are not correlated within phenotypes. The a cn, c cn, e cn and a c, c c, e c coefficients are regression effects of A, C and E influences on cortisone and cortisol, respectively. The r a, r c and r e parameters represent correlations between the A, C and E variance components of cortisol with those of cortisone. Genetic, shared environmental and non-shared environmental covariances are calculated as a cn × r a × a c, c cn × r c × c c and e cn × r e × e c, respectively.
We report results of both parametric moderation models and non-parametric moderation models. Parametric moderation models (Purcell, Reference Purcell2002) allow for sets of the a cn, c cn, e cn, a c, c c, e c and r a, r c and r e parameters to vary as functions of the moderator tested in the form p = p 0 + p 1×m, where p is the parameter and m is the moderator. Non-parametric (LOSEM) models provide locally weighted estimates of model parameters along a continuous moderator, such as age (Briley et al. Reference Briley, Harden, Bates and Tucker-Drob2015). This is achieved in LOSEM using a weighting kernel and bandwidth that gives observations in closer proximity to the focal value of the moderator greater weight. Multiple structural equation models are estimated that differ only with respect to the assigned focal value of the moderator (ranging from 8 to 18 years for age and −2 s.d. to + 2 s.d. for SES, both at intervals of 0.10). All biometric models included main effects of race (Caucasian coded as the reference group). Below we report separate moderation models for sex, age and SES. However, results were highly similar when all three moderators were simultaneously considered.
Moderation by sex
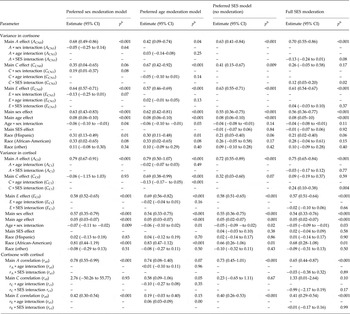
The initial bivariate model allowed for quantitative, qualitative and sex-specific mean age differences. Model fit was examined by sequentially removing: (i) qualitative sex differences in which the within- and across-phenotype cross-twin genetic correlations are freely estimated for opposite-sex pairs; (ii) quantitative sex differences, in which the genetic and environmental effects on each phenotype are allowed to differ by sex; and (iii) sex-specific age trends in mean levels of each phenotype. Fit indices and parameter estimates are summarized in online Supplementary Table S1. There was no evidence of qualitative sex differences in cortisol or cortisone, but there was evidence for quantitative sex differences in cortisone. Table 3 reports unstandardized parameter estimates from the model that included quantitative sex differences in cortisone. Across males and females, 65% of the total variability in cortisol was explained by additive genetic effects. For cortisone, additive genetic and non-shared environmental effects both explained large portions of variation for males (h 2 = 44% and e 2 = 35%) and females (h 2 = 47% and e 2 = 47%). Shared environmental effects accounted for 21% of the variance in cortisone in males, but only 6% in females.
Unstandardized parameter estimates from sex, age and SES moderation models a

SES, Socio-economic status; CI, confidence interval; A, additive genetic; C, shared environment; E, non-shared environment.
a Results are presented for preferred (based on model comparisons) age and sex moderation models. Results are presented for the preferred age, sex and SES moderation models based on model comparisons. The preferred sex model allowed for moderation of only cortisone ACE estimates, while the preferred age moderation model estimated age moderation for cortisol, cortisone and the ACE correlations. The preferred SES model did not allow for moderation by SES of any parameters; however, results are also provided for a model that allowed SES to moderate cortisol, cortisone, and the ACE correlations. Sex was effects coded (female = −0.5, male = 0.5) such that the main effects parameters of A, C and E represent population-mean effects (assuming an equal sex distribution in the population) and interaction effects of sex by A, C and E represent the sex difference in the corresponding parameter value. Age was centered at 8 years of age to reflect the lowest observed integer value in the sample. Thus the main effects parameters of A, C and E represent model-implied biometric effects at age 8 years, and interaction effects of age by A, C and E represent the difference in the corresponding parameter value for each additional year of age.
b p Value = two-tailed probability of type I error.
Moderation by age
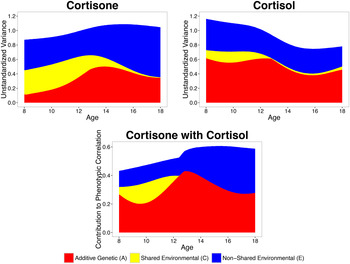
Model fits for the parametric age moderation models are reported in the top part of online Supplementary Table S2. The full age moderation model was the best-fitting model. Unstandardized parameter estimates for this model are reported in Table 3; see online Supplementary Fig. S2 for age trends in model-implied variance accounted for by genetic and environmental factors. For cortisol, non-shared environmental influences were relatively constant across the age range, whereas additive genetic effects gradually decreased with age. Shared environmental influences on cortisol decreased to age 14 years, at which point they fixated at zero.
Although parametric results seemed to indicate a re-emergence of shared environment influences on cortisol in the late teenage years, non-parametric results indicated no such re-emergence (Fig. 2). For cortisone, the additive genetic factor explained increasing variation with age, and the shared environmental factor explained decreasing variability with age, such that shared environmentality was estimated at near 0 by age 18 years. The effect of the non-shared environment on cortisone was moderate and relatively stable across the age range. Across the age range, the association between cortisol and cortisone was approximately 50% attributable to shared genetic etiology. The remaining cortisol–cortisone covariation shifted from being shared environmentally mediated in the younger, preadolescent years, to being non-shared environmentally mediated in the older, adolescent years.
Model-implied age trends in additive genetic (A), shared environmental (Envt.) (C) and non-shared environmental (E) contributions to variance in cortisol, cortisone and their bivariate association using non-parametric LOSEM.

As phenotypic analyses indicated sex differences in age trends in mean cortisone and cortisol levels, we also fit parametric moderation models that included sex differences in the age moderation of biometric effects. These three-way interactions, however, were not significant.
Moderation by SES
Model fits for parametric SES moderation models are reported in the bottom part of online Supplementary Table S2. Removing moderation by SES of ACE influences on cortisol, cortisone or cross-trait ACE correlation estimates each did not significantly decrease model fit relative to the baseline model, nor did removing all moderation by SES. Inspection of individual parameter estimates in the full moderation model (Table 3) revealed significant positive moderation of shared environmental effects by SES for both cortisol and cortisone (online Supplementary Fig. S3) and non-significant negative moderation of genetic effects by SES. Results were very similar when a phenotypic age × SES interaction was also included in the model. Similarly, non-parametric analyses indicated a trend of heightened genetic influence and reduced shared environmental influences on cortisol and cortisone at lower SES (online Supplementary Fig. S3). This is consistent with a diathesis–stress hypothesis, which predicts that genetic influences are stronger under higher stress conditions. However, post-hoc multiple-group tests of these differences indicated that they were not statistically significant (online Supplementary Table S3). Even larger sample sizes than those implemented here may be necessary in order to test definitively for SES moderation.
Discussion
In a socio-economically diverse sample of over 1000 7- to 19-year-old twins, we estimated genetic and environmental contributions to child and adolescent hair cortisol and cortisone, allowing for moderation by age, sex and family SES. We found moderate genetic influences on both hormones, with some indication of stronger shared environmental influences on male cortisone than on female cortisone. Shared environmental influences on both cortisol and cortisone dissipated with age. We found that SES was positively related to cortisol under approximately 13 years of age, whereas SES was negatively related to cortisol at over approximately 13 years of age. SES was unrelated to cortisone. The mechanisms underlying this SES × age pattern on cortisol are unknown. However, one possibility is that patterns of cortisol output change with age as long-term stress accumulates over years. It is also possible that adolescence-related increases in cortisol output are more pronounced for lower-SES individuals as the result of more dramatic changes in socio-ecological stress during that transition period. We also found marked sex differences in age trends. At age 8 years, females evince lower average levels of both hair cortisol and cortisone than males, but females increase in glucocorticoid concentrations over the course of adolescence more rapidly than males, such that by the age of 18 years females have slightly higher mean levels of both hormones. Previous large-scale studies of hair cortisol and cortisone have either focused on adults (Feller et al. Reference Feller, Vigl, Bergmann, Boeing, Kirschbaum and Stalder2014; Staufenbiel et al. Reference Staufenbiel, Andela, Manenschijn, Pereira, van Rossum and Biermasz2015) or on 6-year-olds (Rippe et al. Reference Rippe, Noppe, Windhorst, Tiemeier, van Rossum, Jaddoe, Verhulst, Bakermans-Kranenburg, van Ijendoorn and van den Akker2016), and have therefore been unable to examine age trends in chronic HPA function. The sex differences in age trends described here may provide one plausible biological mechanism for the escalation of internalizing psychopathology in females over the course of adolescence (Hankin et al. Reference Hankin, Abramson, Moffitt, Silva, McGee and Angell1998; Natsuaki et al. Reference Natsuaki, Klimes-Dougan, Ge, Shirtcliff, Hastings and Zahn-Waxler2009).
One previous large-scale study reported a correlation of 0.55 between hair cortisol and cortisone in adults (Feller et al. Reference Feller, Vigl, Bergmann, Boeing, Kirschbaum and Stalder2014), which is very similar to the values that we report in the current child and adolescent sample (0.51 in both males and females). Biometric decompositions indicated that approximately half of this correlation is attributable to shared genetic etiology. The source of the remaining, environmentally driven covariation between cortisol–cortisone changed dynamically with age, shifting from substantially family-level (shared) influences prior to about the age of 12 years, to exclusively twin-specific (non-shared) environments thereafter.
It is useful to consider possible mechanisms for genetic influence on HPA activity. Most obviously, polymorphisms in the genes involved in glucocorticoid synthesis, release and metabolism may be related to homeostatic levels of circulating cortisol. However, although cortisol and cortisone are molecular phenotypes, the pathways between genotype and hormonal concentrations may be less direct. Genetic differences between people also shape the likelihood that they will experience stressful events. For example, neighborhood quality, life events and relationship disruption have all been shown to be heritable, i.e. systematically associated with genetically influenced individual differences (Jocklin et al. Reference Jocklin, McGue and Lykken1996; Bemmels et al. Reference Bemmels, Burt, Legrand, Iacono and McGue2008; Sariaslan et al. Reference Sariaslan, Fazel, D'onofrio, Långström, Larsson, Bergen, Kuja-Halkola and Lichtenstein2016). Additionally, genetic variation in other biological pathways, not directly involved in glucocorticoid metabolism, may shape psychological factors that influence how stressful events are interpreted and coped with. Therefore, genetic influences on phenotypes measured ‘under the skin’ may nevertheless be translated via environmental, ‘outside the skin’ pathways (Kendler et al. Reference Kendler, Chen, Dick, Maes, Gillespie, Neale and Riley2012). Finally, HPA axis changes may be an outcome of disease processes, such as major depression (Frodl & O'Keane, Reference Frodl and O'Keane2013).
Limitations
The current study presents the first rigorous examination of age trends in, sex differences in, SES differences in, and genetic and environmental effects on cortisol and cortisone over middle childhood and adolescence. Nevertheless, there are several limitations that must be acknowledged. First, although hair cortisol has substantial benefits relative to more conventional technologies with respect to indexing long-term HPA function, we have only recently started to measure diurnal glucocorticoid output in saliva alongside long-term HPA function in hair in this sample. Indeed, it is possible that SES affects HPA function by way of specific components of diurnal variation (Desantis et al. Reference Desantis, Kuzawa and Adam2015). Additionally, while the broad child–adolescent age range was valuable for studying age-related differences in HPA function, it is less well suited for obtaining precise estimates of associations within a narrow age group. Moreover, although this is the largest twin study of hormones to date, we found substantial complexity in associations involving age, sex and SES. Even larger samples may be necessary to obtain precise conditional estimates of genetic and environmental effects within subgroups.
Conclusion
In conclusion, this study is the first to estimate the magnitude of genetic influences on long-term glucocorticoid output and to examine how genetic influences differ with age, sex and SES. Further research spanning levels of measurement and explanation will be needed to understand the mechanisms of these genetic influences and test associations with psychiatric outcomes.
Supplementary material
The supplement material for this article can be found at https://doi.org/10.1017/S0033291716003068
Acknowledgements
This research was supported by National Institutes of Health (NIH) grants R01HD083613, R21HD081437 and R21AA023322. L.E.E. was supported by a National Science Foundation Graduate Research Fellowship. The Population Research Center at the University of Texas at Austin is supported by NIH grant R24HD042849.
Declaration of Interest
None.