I. INTRODUCTION
In the production process of the steels, the stable and efficient continuous casting is an essential way to solidify large volumes of molten metal with simple shapes, and it is prepared for subsequent thermomechanical control process. Therefore, the property and quality of casting slabs play a fundamental role for subsequent control rolling and control cooling schemes, as well as the quality of final steel products.Reference Thomas1,Reference Long, Dong, Chen, Zhang and Zhang2 Currently, microalloyed hypo-eutectoid steels with a superior combination in mechanical properties, such as high strength, high toughness, and weldability, have been considered as promising engineering materials.Reference Kong and Xie3–Reference Bhadeshia and Honeycombe5 The solidification of hypo-eutectoid steel undergoes generally a series of phase transformation process during continuous casting, such as L → δ → γ → α and γ → p. The occurrence of austenite decomposition in hypo-eutectoid steel is inevitable due to frequent temperature fluctuations in the secondary cooling zone of continuous casting.Reference Pfeiler, Thomas, Wu, Ludwig and Kharicha6–Reference Kop, Sietsma and Zwaag8 Since the lattice structure difference between austenite (γ, face-centered cubic, FCC) and ferrite (α, body-centered cubic, BCC), austenite decomposition is in principle accompanied by a noteworthy expand in specific volume.Reference Andrés, Caballero, Capdevila and Álvarez9 The volume expansion can cause simultaneously thermal stresses on both the surface and inside of a strand.Reference Jian, Dengfu, Chengqian, Wengsing and Mingrong10 The formation of film-like ferrite along austenite grain boundary destroys the continuity of the austenite matrix, and it also results in the embrittlement of matrix microstructures.Reference Mintz11,Reference Carpenter, Dippenaar and Killmore12 Under a combination of excessive thermal and mechanical stresses, many microcracks will initiate potentially in the embrittlement film and then propagate along grain boundaries to form various surface and internal cracks.Reference Ma, Wen, Tang, Yu, Li, Xu and Mei13–Reference Zhao, Wu, He and Zhang15 It generally results in a severe defect and deteriorates the casting quality, and this poor slab quality may force the downgrading of the entire batch. Compared with conventional carbon steels, fine precipitates generated by the addition of microalloying element can pin austenite grain boundaries, limiting the ductility of austenite and deteriorate hot ductility of casting slab.Reference Pierson16,Reference Zarandi and Yue17 Cracking in casting slabs has been one of the main problems for many years in continuous casting of microalloyed hypo-eutectoid steel. Moreover, austenite decomposition behavior during cooling dominates the development of final microstructures. Thus, a full understanding about austenite decomposition is useful toward improving the overall quality of casting slab.
Currently, a common method for preventing crack occurrence is to keep the slab surface temperature out of the brittle trough range during bending and straightening operation.Reference Ma, Wen, Tang, Xu, Mei and Wang18 In this sense, the critical temperatures of austenite decomposition, such as the start temperature of ferrite transformation (A r3, γ → α), the finish temperature of ferrite transformation (A ff, ff = ferrite finish, γ → α), the start temperature of pearlite transformation (A r1, γ → p), and the finish temperature of pearlite transformation (A pf, pf = pearlite finish, γ → p), are of importance to determine the brittle trough range of continuous casting slabs. Since the across temperature of the casting slab mainly depends on the cooling intensity, cooling rate in the secondary cooling zone is the key factor to control the cracking susceptibility of casting slabs in the brittle trough range.Reference Zarandi and Yue19–Reference Chen, Lv, Tang, Liu and Wang21 In addition, with the increasing use of computer-based process models for stress field simulations of strands, the quantitative and accurate data about thermal expansion coefficient at any temperatures are available for preventing crack formation.Reference James, Spittle, Brown and Evans22 However, there is no adequate thermal expansion coefficient data about austenite decomposition at various cooling rates to consult, especially for Ti-microalloyed hypo-eutectoid steels. Thus, it is necessary to understand the expansion behavior of austenite decomposition under various cooling conditions, which will contribute to optimize the process parameters of casting and achieve consistent performance.Reference Banks, Tuling and Mintz23,Reference Li, Chen, Liu, Wang, Wen and Zhang24 In general, dilatometric test is widely used to research the expansion behavior of austenite decomposition.Reference Brimacombe and Sorimachi25–Reference Zhao, Fu, Zhu, Yang and Wu27 This instrument can continuously measure and real time monitor the dimensional changes occurring in the experimental sample under a heating and cooling circle.Reference Vázquez-Gómez, López-Martínez, Gallegos-Pérez, Santoyo-Avilés, Vergara-Hernández and Campillo28 Austenite decomposition behavior in hypo-eutectoid steels consists of two phenomena: austenite to ferrite transformation (γ → α) and austenite to pearlite transformation (γ → p).Reference Yang, Ma, Zhu and Liu29 The critical temperatures such as A r3 and A pf can be determined on dilatometric curve or linear thermal expansion coefficient (LTEC) versus the temperature curve.Reference Pawłowski30 However, other critical temperatures such as A r1 and A ff are less evident to obtain from the dilatometric curve and LTEC versus the temperature curve. As mentioned above, the start and finish temperature of γ → α and γ → p reaction are of importance either for basic research or for industrial design of continuous casting process. Currently, some quenching experiments were used to detect A r1 and A ff by interrupting cooling and subsequent metallographic examination.Reference Caballero, Capdevila and Andrés31 Obviously, it is a time-consuming work. However, there is no detailed description for the determination of the critical temperatures A r1 and A ff from the dilatometric curve or LTEC versus the temperature curve. Moreover, austenite decomposition in hypo-eutectoid steels is a continuous phase transformation process, which will lead different microstructures to form with different initial cooling conditions.Reference Ma, Wen, Tang, Yu, Li, Xu and Mei13 In this sense, the phase transition fraction of the final microstructure also depends on initial cooling condition of austenite decomposition. In other words, initial cooling condition of austenite decomposition determines the development of the final microstructure and mechanical properties of the casting slab. The different proportion in final phase products such as ferrite phase and pearlite phase dominates the combination effect of strength and toughness for casting slab.Reference Dou, Meng, Liu, Liu and Huang14 Lever rule is used generally to evaluate the phase fraction change versus the temperature based on the measured dilatometric curves.Reference Suh, Oh, Han and Kim32,Reference Dong, Chen, Long, Li, Chen and Vitos33 However, an obvious difference can be observed between the results of phase fraction measured by microscopic analysis and the results of phase fraction calculated by lever rule.Reference Li, Gai, He, Zhang, Cui and Li34 Therefore, the mentioned insufficiency in the critical temperature (A r1 and A ff) determination and phase transition fraction evaluation is the aim of the current study.
In the current study, the expansion behaviors under various cooling rates were investigated initially in a titanium-microalloyed hypo-eutectoid steel. Next, the LTEC changes were extracted from LTEC versus the temperature curve. The critical temperatures (A r3, A r1, A ff, and A pf) were determined on LTEC versus the temperature curve using peak separation method. Finally, phase transition fraction changes of final phase products were evaluated based on the area proportion of independent phase transformation peaks. Further verification of correctness of the peak area method was compared with the results of phase fraction measured by microscopic analysis and the results of phase fraction calculated by lever rule. Meanwhile, an additional dilatometric analysis was performed to investigate the influence of cooling rate on the critical temperatures and phase transition fraction of austenite decomposition. Moreover, the additional objective in current study is to give a general application for dilatometry as an experimental technique to evaluate the critical temperatures (A r3, A r1, A ff, and A pf) and phase transition fraction during austenite decomposition.
II. EXPERIMENTAL PROCEDURES
The material used in this study was a titanium-microalloyed hypo-eutectoid cast slab with 220 mm in thickness, which was collected from a commercial steel plant. The detailed chemical compositions of the titanium-microalloyed casting slab in mass fraction (wt%) are listed as follows: 0.15 C, 1.08 Mn, 0.017 P, 0.002 S, 0.21 Si, 0.03 Ni, 0.05 Cr, 0.053 Ti, 0.008 Nb, and 0.004 N. The expansion behaviors during continuous cooling under various cooling rates were investigated in the laboratory. The dilatometric measurements were initially performed on a high-resolution dilatometer DIL 402. Cylindrical specimens for dilatometry with a length of 25 mm and a diameter of 4 mm were machined from the slab center and along the longitudinal direction, and then the specimens were polished with the standard sample preparation method. During the measurement process, these cylindrical specimens were clamped between two quartz push rods. And a linear variable displacement transducer was used to record the length changes between the small cylindrical specimen and the push rods due to thermal expansion or contraction occurrence in the specimen interior. The cylindrical specimen was heated through an induction coil. The specimen temperature was measured by a Pt/Pt–Rh thermocouple which was spot-welded on the surface in the midlength of the specimen.
As from the previous research of Chen and Long et al.,Reference Long, Dong, Chen, Zhang and Zhang2,Reference Long, Chen, Zhang, Zhao and Liu35 the cooling of casting slab during continuous casting is generally divided into two stages: mold cooling and secondary cooling. The surface temperature of the slab outside the mold is usually above 1100 °C, which is higher than A r3. Meanwhile, the austenite decomposition behavior during continuous casting mainly depends on the cooling conditions of the slab in the secondary cooling zone. Moreover, the average cooling rate in the secondary cooling zone during the commercial continuous casting is less than 30 °C/min, which varies frequently with different steel grades, casting speeds, and cooling conditions. Thus, to simulate a same thermal history as that in the continuous casting process, the expansion measurements during continuous casting were performed at the range of cooling rate from 5 to 20 °C/min. The detailed schematic of experimental procedures is illustrated as follows. First, the dilatometric specimen was heated to 1000 °C with a heating rate of 5 °C/min. Then the specimen was held for 5 min at the target temperature of 1000 °C to make the specimen temperature homogenize. Finally, the specimen was cooled to 200 °C with four different cooling rates of 5, 10, 15, and 20 °C/min. In the whole experiment process, a stable argon gas flow of 20 mL/min was maintained in the dilatometer chamber to prevent specimen oxidation. During the continuous heating and cooling circle, the relative changes in length and temperature of the specimens as a function of time were recorded online. The microstructure after the dilatometric test was observed by optical microscopy. The specimens for metallographic analysis were prepared using the standard metallographic method. Polished specimens were etched by 3% (volume fraction) Nital solution. The phase fractions of ferrite and pearlite were measured using a quantitative image analysis software (Image pro-plus, IPP).
III. DETERMINATION OF FOUR CRITICAL TEMPERATURES
A. Critical temperatures’ measurement method
Austenite decomposition during continuous casting is generally accompanied by a specific volume expansion due to the lattice structure change. This is associated with the dimensional changes occurring in the specimen interior.Reference Andrés, Caballero, Capdevila and Álvarez9 Thus, a significant dimensional change on the cooling dilatometric curve can be observed. The dimensional change in length is presented usually by a function curve of temperature. Based on the measured linear change curve during continuous cooling, LTEC of austenite decomposition can be obtained by Eq. (1).
 $${\alpha _{{\rm{line}}}} = {1 \over {{L_{\rm{T}}}}} \cdot {{{\rm{d}}{L_{\rm{T}}}} \over {{\rm{d}}T}}\quad ,$$
where αline is the LTEC of the steel, °C−1; L T and dL T are the length and the length change of the sample, mm; dT is the corresponding temperature interval, °C.
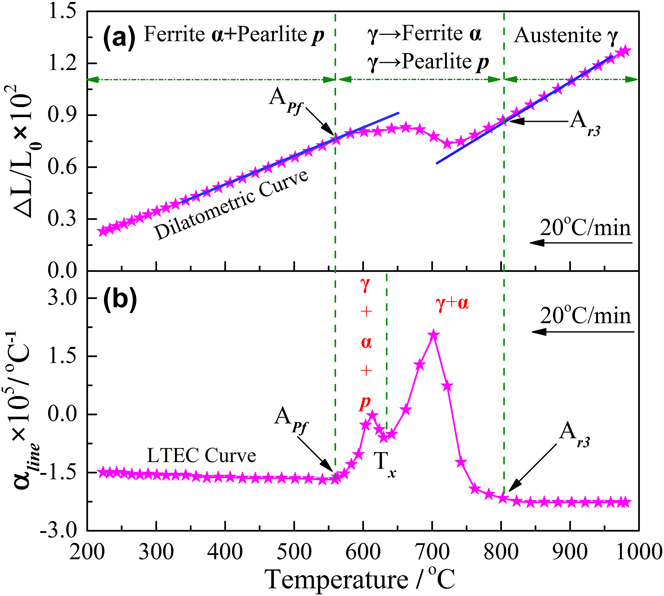
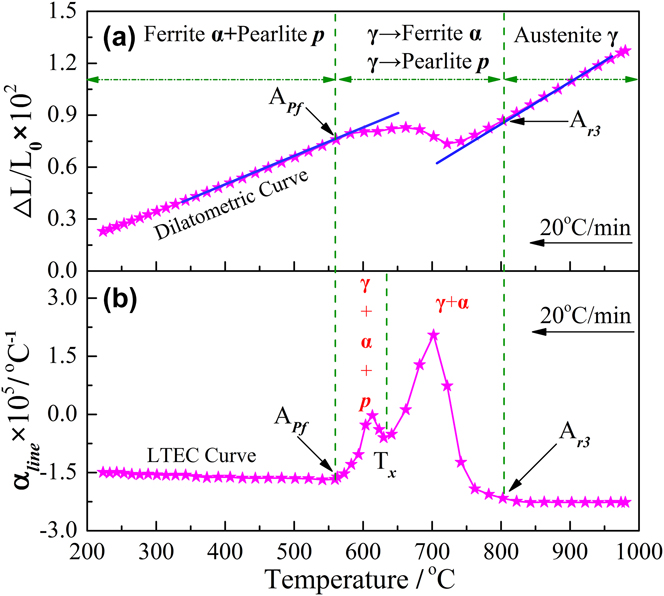
Based on the length change ΔL, the dilatometric curve f(T) = ΔL/L 0 was obtained, which was a function of temperature. Since there were the same trends for all the four test curves measured from 1000 °C to 200 °C with cooling rates of 5, 10, 15, and 20 °C /min, respectively, Fig. 1 just shows the variations in the relative change of length ΔL/L 0 and corresponding LTEC αline at a cooling rate of 20 °C/min. There were no obvious LTEC αline change below 556.9 °C and above 802.6 °C at the cooling rate of 20 °C/min. As shown in Fig. 1(a), the dilatometric curve also showed clearly the linear thermal expansion characteristics in the two temperature range where no phase transformation occurred. In the region of single austenite phase, the change of the sample length linearly decreased with a constant slope around −2.26 × 10⁻⁵ °C−1. In the region of austenite decomposition finish, the change of the sample length linearly decreased with a constant slope around −1.58 × 10⁻⁵ °C−1. The negative value indicates the contraction behavior of the sample during continuous cooling, while a positive value means the expansion.Reference Long, Dong, Chen, Zhang and Zhang2 Moreover, two main change stages of αline can be identified from the LTEC versus the temperature curve, including a weak peak at lower temperature region and a strong peak at higher temperature region, as shown in Fig. 1(b). It means that two different transformations took place in nonlinear thermal expansion characteristic zone during austenite decomposition. It was found that the most values of LTECs were positive in the austenite decomposition zone, which meant that the expansion of matrix majorly occurred in the austenite decomposition process. During the continuous cooling from 1000 °C, the steel undergone four stages: (i) single-phase region of austenite (α); (ii) coexistence phase of ferrite and austenite (α + γ); (iii) coexistence phase of ferrite, pearlite, and austenite (α + γ + p); and (iv) coexistence phase of ferrite and pearlite (γ + p). Finally, all initial austenite phase decomposed into ferrite and pearlite phase. Furthermore, as shown in Fig. 1(a), two critical transformation temperatures could be determined using the method of the first deviation from the slope of the dilatation ΔL/L 0 versus the temperature curve, such as the start temperature of austenite to ferrite transformation (A r3) and the finish temperature of austenite to pearlite transformation (A pf). Nevertheless, the critical temperatures of A r3 and A pf could be easier to directly determine from the LTEC versus the temperature curve, as shown in Fig. 1(b). Moreover, the peak temperatures of ferrite reaction and pearlite reaction also could be directly determined from the LTEC versus the temperature curve, which was less evident to obtain from the curve ΔL/L 0 versus the temperature. As shown in Fig. 1(b), it was noteworthy that the intersection point temperature T x between these two peaks was generally described as the eutectoid reaction start temperature A r1. However, this intersection point temperature T x is just a certain coexistence temperature of ferrite and pearlite phase in the austenite decomposition zone.Reference Pawłowski30 In this sense, the two overlapped peaks on the LTEC curve were presented clearly due to the relatively close reaction temperature and wide range. It also caused that the superimposed peaks cannot be used to evaluate accurately the eutectoid reaction start temperature A r1 during austenite decomposition. Therefore, it is necessary to separate the overlapped peaks to obtain the critical temperatures A r1 and A ff during continuous cooling. The determination method of A r1 and A ff in the temperature range of A r3 and A pf will be introduced in the following section.
Measured dilatometric curve and LTEC curve with the cooling rate of 20 °C/min: (a) dilatometric curve, (b) LTEC curve.
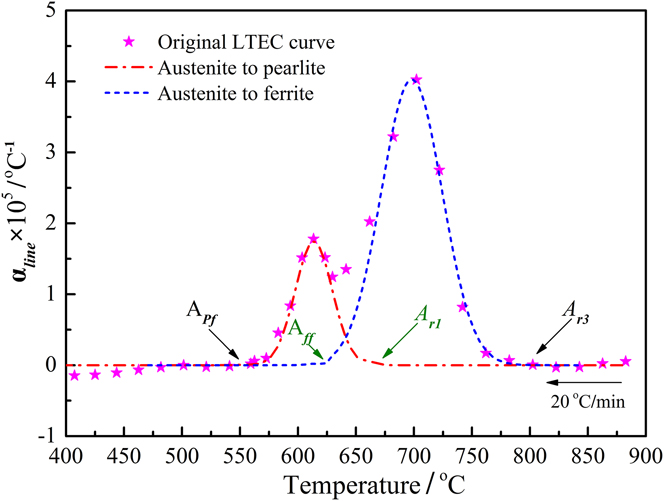
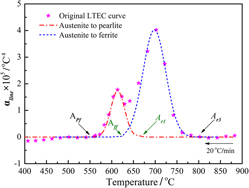
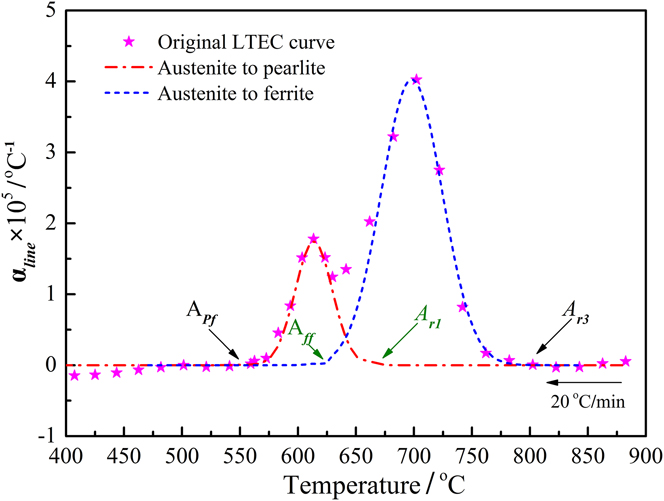
As mentioned above, the critical temperatures A r1 and A ff were hidden into two overlapped peaks on the LTEC curve. In this study, the overlapped peaks were divided into two independent peaks using the peak separation method. The peak separation and quantitative calculation were performed using a commercially available curve-fitting program of Origin 8.5 software. Selected peak regions were linearized for baseline using an interactive procedure of the program by connecting the left and right points of the interval with a straight line. This baseline adjustment was conducted toward zero at both ends of the region for eliminating a possible artificial error in the LTEC curve.Reference Wu, Liu, Sun and Fan36 As the shapes of the peaks are not known, the use of general peak shapes, such as Gaussian, Lorentzian, and Voight function, has been applied to the overlapped peak zone of the LTEC curve.Reference Ibarra, Muñoz and Moliner37 It was found that the overlapped peaks were well fitted to the Gaussian function. Previous studiesReference Wu, Liu, Sun and Fan36,Reference Ibarra, Muñoz and Moliner37 also indicated that the best results were obtained using the mentioned Gaussian function. All peaks, heights, band shapes, and widths were allowed to adjust from the initial guesses. The number of peaks in a given region was determined, and the frequency and intensity of each peak was estimated. To determine the goodness of fit criteria, the following aspects were considered: the height error and width error between the original peak data and the separate peak data were controlled to below 5.0%. Since there were similar separation results of overlapped peaks on the LTEC curves between A r3 and A pf, Fig. 2 just shows the separation results of overlapped peaks at a cooling rate of 20 °C/min as an example of introduction. The separation results indicated that the height error between the original peak data and the separate peak data was 2.3% and the width error was 3.5%. It was found that the temperature range of austenite to ferrite transformation was wider than that of austenite to pearlite transformation. Moreover, A r1 was measured to be 660.1 °C after the peak separation process, which was higher than the intersection point temperature T x of 631.7 °C. The difference in temperature between A r1 and T x was close to 28.4 °C. Meanwhile, A ff was measured to be 620.2 °C after the separation process. Similarly, there was also an obvious temperature difference exists between A ff and T x, about 11.5 °C. Apparently, the peak separation method can obtain the critical temperature A r1 and A ff hidden into two overlapped peaks. The intersection point temperature T x regarded generally as the eutectoid reaction start temperature is less than the actual temperature A r1 obtained by peak separation, which may have an effect on the transformation fraction of the decomposition products.
The separation results of overlapped peaks between A r3 and A pf with a cooling rate of 20 °C/min.
B. Effect of cooling rate on expansion behavior of austenite decomposition
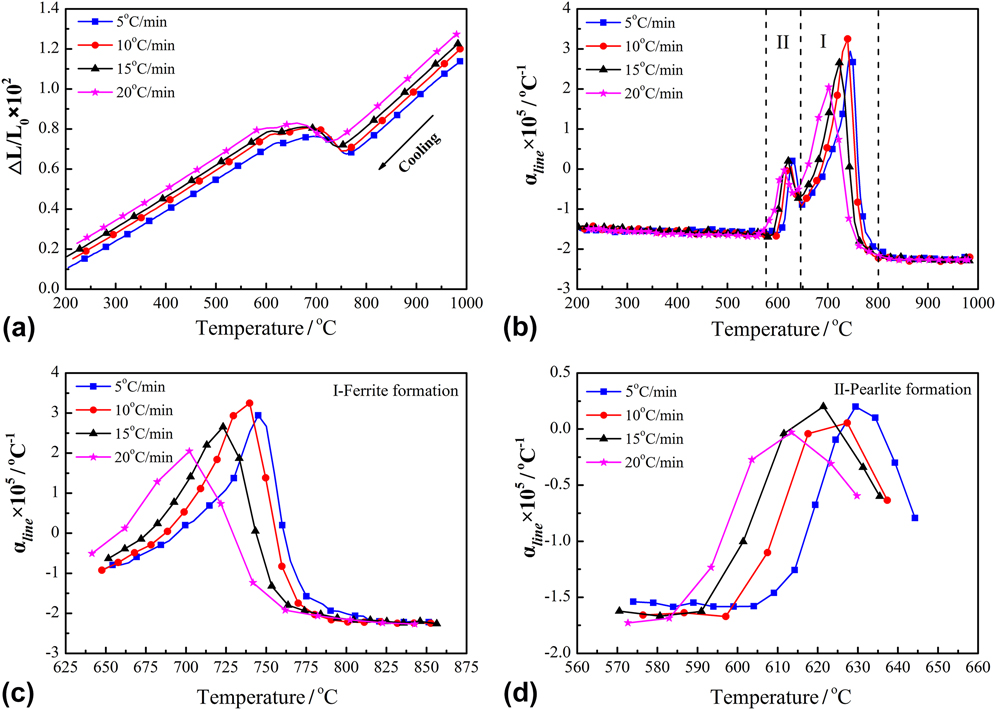
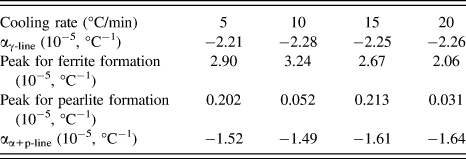
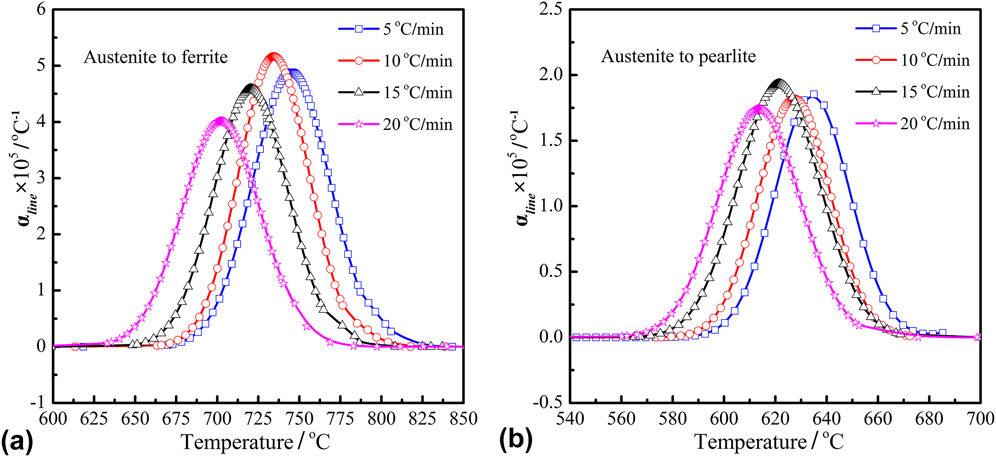
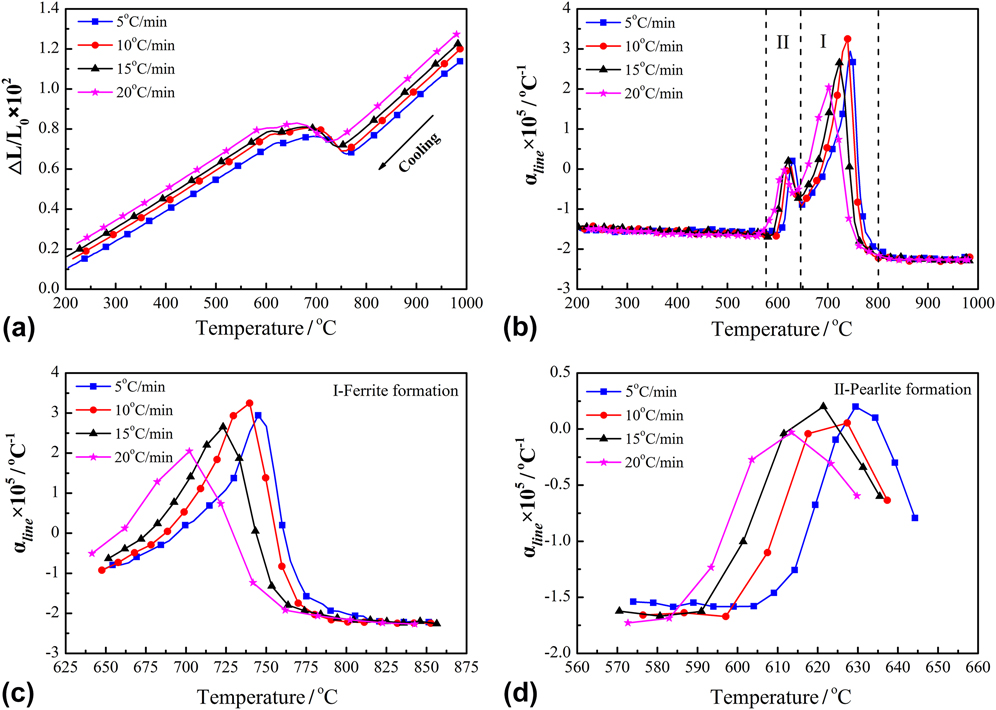
The dilatometric curves of the experimental steel were measured at four different cooling rates of 5–20 °C/min. To further study the effect of cooling rate on the expansion behavior, the LTEC curves at various cooling rates were also presented. Linear dilatometric curves of Ti-microalloyed steel and their LTEC curves during continuous cooling at various cooling rates are shown in Fig. 3. Figure 3(a) indicates that there were the same variation trends for all the four dilatometric curves measured by setting cooling rates. In the continuous cooling process, when the temperature was below A r3, both the relative changes of length ΔL/L 0 first steadily decreased with the temperature down to a critical value and then entered an uplift area, finally recovered the decrease trend again when austenite decomposition finished. However, there was an obvious difference in the critical temperatures with the increase of cooling rate. The critical temperatures of austenite decomposition were retarded to lower temperatures when the cooling rate was increased as the cooling time decreased. The variations of the corresponding LTEC as a function of temperature under various cooling rates are indicated in Fig. 3(b). In the continuous cooling process, the LTECs αline were constant in the temperature range where no phase transformation occurred. But two main change stages of αline were observed in the austenite decomposition zone, including a strong peak at the higher temperature region indicated by (I) and a weak peak at the lower temperature region indicated by (II). The peak region indicated by (I) and peak region indicated by (II) were in general represent, respectively, the ferrite reaction and pearlite reaction during austenite decomposition, as shown in Fig. 3(b). The LTECs αline both rapidly increased followed by a slow increase at the last period of austenite decomposition under various cooling rates. The two different increases in the LTECs were resulted from the formation of ferrite and pearlite with different structures. Similarly, it was found that the cooling rate had a remarkable impact on the LTECs in the austenite decomposition zone. As the cooling rate increased from 5 to 20 °C/min, the peak temperatures of maximal LTEC for ferrite and pearlite formation moved apparently toward the lower temperature. As the magnification for I region and II region at various cooling rates increased, the variation of peak LTEC in ferrite formation zone is shown in Fig. 3(c). Meanwhile, the variation of peak LTEC in pearlite formation zone is shown in Fig. 3(d). In the ferrite formation area (I region), the peaks of LTEC for ferrite formation apparently moved toward the lower values with the increase of cooling rate from 5 to 20 °C/min, in addition to the cooling rate of 10 °C/min. The peaks of LTEC for ferrite formation were 2.90 × 10⁻⁵ °C−1, 3.24 × 10⁻⁵ °C−1, 2.67 × 10⁻⁵ °C−1, and 2.06 × 10⁻⁵ °C−1, respectively, as shown in Fig. 3(c). In the pearlite formation area (II region), similarly, the peaks of LTEC during pearlite formation apparently moved toward the lower values with the increase of cooling rate from 5 to 20 °C/min, in addition to the cooling rate of 15 °C/min. The peaks of the LTEC for pearlite formation were 0.202 × 10⁻⁵ °C−1, 0.052 × 10⁻⁵ °C−1, 0.213 × 10⁻⁵ °C−1, and 0.031 × 10⁻⁵ °C−1, respectively, as shown in Fig. 3(d). It is noteworthy that the values of LTEC were equal to zero. It means that the volume contraction of specimen was just balanced with the volume expansion of specimen in the austenite decomposition zone. The corresponding characteristic LTECs of ferrite and pearlite phase under various cooling rates are also shown in Table I.
Dilatation curves and their derivative curves at various cooling rates: (a) dilatation curves, (b) LTEC curves, (c) ferrite formation area, and (d) pearlite formation area.
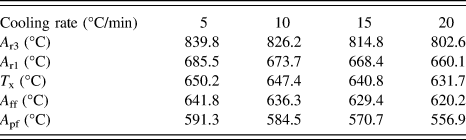
Characteristic values of LTEC at various cooling rates.

C. Effect of cooling rate on critical temperatures of austenite decomposition
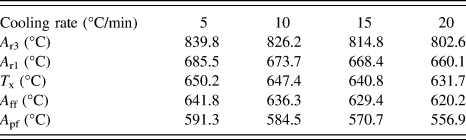
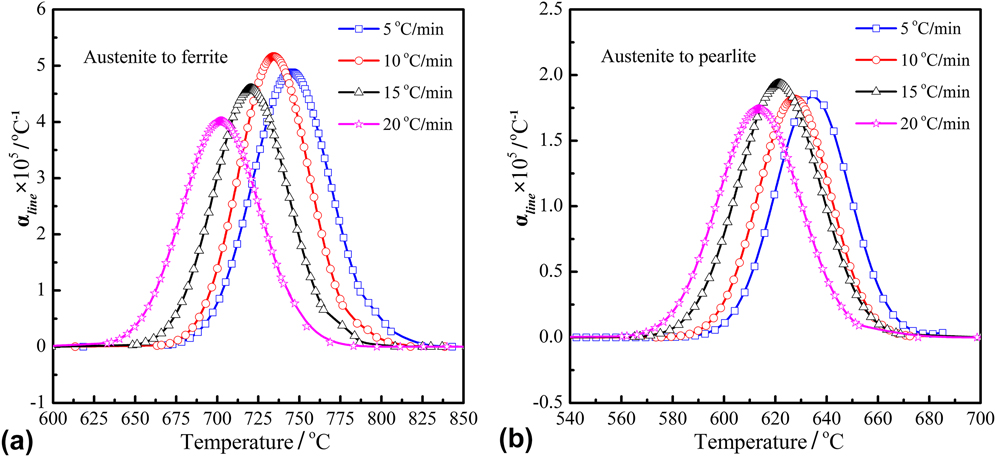
To investigate the critical temperatures of austenite decomposition at different cooling rates, the peak separation method for measuring the start temperature and end temperature of the decomposition was performed in the austenite decomposition zone. The separation results of two overlapped peaks between A r3 and A pf with various cooling rates are shown in Fig. 4. The characteristic values of critical temperatures of ferrite and pearlite reactions under various cooling rates are shown in Table II. With the increase of the cooling rate, an obvious decrease in critical temperatures (A r3, A r1, A ff, and A pf) was observed as the result of a decreased cooling time in the austenite decomposition zone, where austenite decomposed into ferrite and pearlite phase. In the ferrite formation area, the temperature of A r3 was, respectively, 839.8, 826.2, 814.8, and 802.6 °C with the increase of cooling rate from 5 to 20 °C/min. The temperature of A ff was, respectively, 641.8, 636.3, 629.4, and 620.2 °C with the increase of cooling rate from 5 to 20 °C/min. In the pearlite formation area, the temperature of A r1 was, respectively, 685.5, 673.7, 668.4, and 660.1 °C with the increase of cooling rate from 5 to 20 °C/min. The temperature of A pf was, respectively, 591.3, 584.5, 570.7, and 556.9 °C with the increase of cooling rate from 5 to 20 °C/min. Moreover, the temperature interval of austenite to ferrite transformation decreased with the increase of cooling rate as the result of the decreased cooling time. Apparently, A r1 measured by the peak separation process was higher than the intersection point temperature T x. The difference in temperature between A r1 and T x was, respectively, 35.2, 26.3, 27.6, and 28.4 °C with the increase of cooling rate from 5 to 20 °C/min. The average value of the temperature difference in A r1 and T x was close to 30 °C. Meanwhile, the difference in temperature between T x and A ff was, respectively, 8.4, 11.1, 11.4, and 11.5 °C with the increase of cooling rate from 5 to 20 °C/min. The average value of the temperature difference in T x and A ff was close to 10.5 °C.
Separation results of two overlapped peaks with various cooling rates: (a) austenite transformation to ferrite, (b) austenite transformation to pearlite.
Critical temperatures of austenite decomposition at various cooling rates.
In general, austenite decomposition is a nucleation and growth process. And the nucleation rate of initial ferrite phase mainly depends on the nucleation time, nucleation site, temperature gradient, and nucleation style (e.g., heterogeneous nucleation). Increasing cooling rate, the available time at any given temperature for the transformation decreases, and the ferrite formation start temperature decreases. Meanwhile, the remaining austenite phase is enriched generally by the carbon element, which is rejected from the growing ferrite phase due to its solubility limit of carbon element. As the cooling rate increases, the radius of critical nucleus will be decreased, which can prompt the nucleation of the formation phase at the lower temperature during cooling. So, cementite first forms progressively at the lower temperature and ends by depleting the enriched carbon element in the untransformed austenite. The untransformed austenite decomposes finally into secondary transformation product-pearlite during continuous cooling.Reference Suh, Oh, Han and Kim32,Reference Petkov38 Similarly, the growth rate of the ferrite phase is proportional to the diffusion coefficient and concentration gradient of carbon atoms in remaining austenite. With the increase of the cooling rate, the effective holding times at the given temperature are shorter and the amount of diffusion of the carbon element decreases per unit of time.Reference Jian, Dengfu, Chengqian, Wengsing and Mingrong10 Consequently, four characteristic temperatures of austenite decomposition were retarded to lower temperature with cooling rate increasing.
IV. DISCUSSION ON PHASE TRANSITION FRACTION WITH PEAK SEPARATION
A. Calculation of the phase fraction based on the LTEC curve
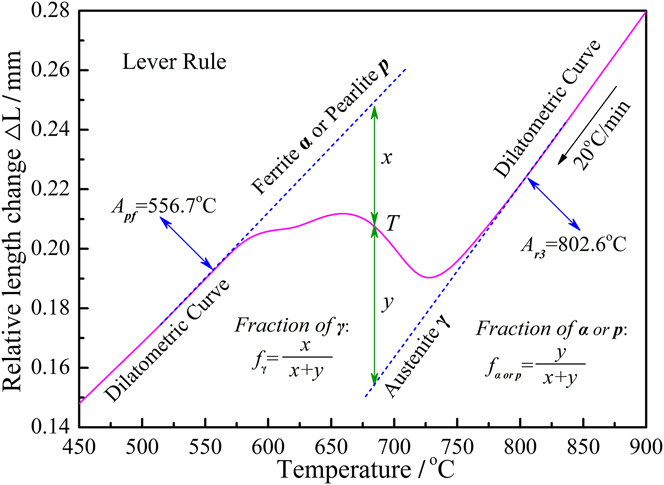
The different proportion in the final ferrite phase and pearlite phase will result in the different combination effect in strength and toughness for the casting slab.Reference Dou, Meng, Liu, Liu and Huang14 The phase transition fraction of the final microstructure directly depends on the kinetics of the ferrite reaction and pearlite reaction. To translate the data of the dilatometric curve into the phase transition fraction of formation phases at any given temperature T, the conventional method of evaluating phase fraction is the so-called lever rule method based on the measured dilatometric curves.Reference Suh, Oh, Han and Kim32–Reference Li, Gai, He, Zhang, Cui and Li34 The calculation process is demonstrated using the dilatometric curve measured at the cooling rate of 20 °C/min, and the example of exhibition is shown in Fig. 5. In the lever rule method, based on the measured dilatometric curve f(T) = ΔL or f(T) = ΔL/L 0, two linear segments of a dilatometric curve are first extrapolated. Then, the phase fraction of the formation phase at a given temperature T is evaluated by the difference of the measured dilatometric curve between these two extrapolated lines. The phase fraction of untransformed austenite at the given temperature T is defined as x/x + y, while the phase fraction of formed ferrite or pearlite phase at the given temperature T is defined as y/x + y.Reference Li, Gai, He, Zhang, Cui and Li34 The expression of formed ferrite or pearlite phase fraction at the given temperature T can be given as follows:
 $${f_{\alpha \;{\rm{or}}\;{\rm{p}}}} = {y \over {x + y}} = {{{y / {{L_0}}}} \over {{{\left( {x + y} \right)} / {{L_0}}}}} = {{{{\left( {{{\Delta L} / {{L_0}}}} \right)}_y}} \over {{{\left( {{{\Delta L} / {{L_0}}}} \right)}_x} + {{\left( {{{\Delta L} / {{L_0}}}} \right)}_y}}}\quad ,$$
where y or (ΔL/L 0)y is the difference between measured data and extrapolated dilatation of austenite, and x or (ΔL/L 0)x is the difference between extrapolated dilatations of austenite and product phase (ferrite or pearlite phase).
Schematic diagram of the phase fraction calculated by level rule.

It is noteworthy that the lever rule method is valid for the case in which the overlapping phase formation area is not considered during austenite decomposition. In the current study, the separated LTEC curves were used to evaluate the phase transition fraction. As mentioned above, the corresponding LTECs are constant in the temperature range (T < A pf and T > A r3) where no transformation occurred. In the uplift area of the LTEC curve, the variation of the the LTEC was a function of temperature. The phase transition fraction for ferrite and pearlite can be characterized quantitatively by measuring the area of the corresponding phase transformation peak. This calculation method is defined as the peak area method, and it generally carried out on the spectra curve and differential scanning calorimetry curve. Therefore, based on the separation result of overlapped peaks in the austenite decomposition zone, the phase fraction of formed ferrite and pearlite phase at any given temperature T can be obtained as follows:
 $${f_\alpha } = {{{S_\alpha }\left( T \right)} \over S} = {{\int_{{A_{{\rm{r3}}}}}^{T\left( t \right)} {{\alpha _{{\rm{line}}}}{\rm{d}}T} } \over {\int_{{A_{{\rm{r3}}}}}^{{A_{{\rm{pf}}}}} {{\alpha _{{\rm{line}}}}{\rm{d}}T} }}\left( {{A_{{\rm{ff}}}} \le T\left( t \right) \le {A_{{\rm{r3}}}}} \right)\quad ,$$
 $${f_{\rm{p}}} = {{{S_{\rm{p}}}\left( T \right)} \over S} = {{\int_{{A_{{\rm{r1}}}}}^{T\left( t \right)} {{\alpha _{{\rm{line}}}}{\rm{d}}T} } \over {\int_{{A_{{\rm{r3}}}}}^{{A_{{\rm{pf}}}}} {{\alpha _{{\rm{line}}}}{\rm{d}}T} }}\left( {{A_{{\rm{pf}}}} \le T\left( t \right) \le {A_{{\rm{r1}}}}} \right)\quad ,$$
where S(T) is the peak area between the baseline and the separate peak at the given temperature T, and S is the entire peak area between the baseline and the overlapped peaks on the LTEC curve.
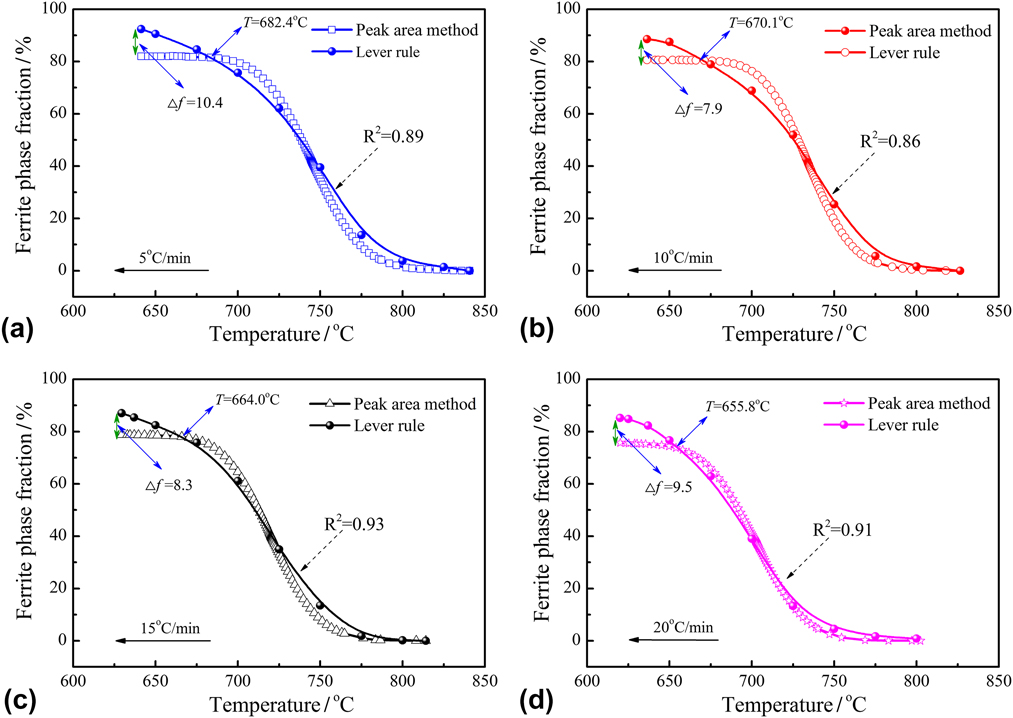
Based on the separation result in the austenite decomposition zone, the ferrite phase fraction with the change of temperature at various cooling rates was calculated using the peak area method. The calculation results of the lever rule method based on the measured dilatometric curves together with the calculation results of the peak area method are shown in Fig. 6. It was found that the phase fraction of the ferrite product was a function of the temperature. The ferrite phase fraction increased with the continuous decrease in temperature in the ferrite formation area, either using lever rule or using peak area method. Similarly, the final ferrite phase fraction after austenite decomposition decreased with cooling rate increasing, either using lever rule or using peak area method. However, the compared results indicated that two different stages were observed from these two variation curves indicated by lever rule and peak area method, respectively. Initially, there just had a tiny difference between the calculation results of lever rule and peak area methods when the temperature exceeded the characteristic value. The characteristic temperature T was, respectively, 682.4, 670.1, 664.0, and 655.8 °C with the increase of cooling rate from 5 to 20 °C/min. However, compared with the peak area method, a sharp increase in the ferrite phase fraction was observed using lever rule when the temperature was below the characteristic temperature. It finally led to an obvious difference between the final phase fractions at A ff temperature, which was, respectively, ∆f = 10.4, 7.9, 8.3, and 9.5% with the increase of the cooling rate from 5 to 20 °C/min. As mentioned above, the start temperature of austenite to pearlite transformation (A r1) was, respectively, 685.5, 673.7, 668.4, and 660.1 °C with the increase of cooling rate from 5 to 20 °C/min. It was found that the characteristic temperature T of the sharp increase was very close to the temperature of A r1. At the initial stage of austenite to pearlite transformation, the pearlite phase fraction is generally small. Then the pearlite phase fraction will increase gradually in the temperature range of the characteristic temperature T and A ff. Nevertheless, the corresponding increase in pearlite phase fraction is generally regarded as the ferrite phase fraction using lever rule method. Compared with lever rule, the result also demonstrates that the final calculation result using peak area method can be used to reflect the actual phase fraction change during austenite decomposition. In the current study, the microstructure analysis of the dilatometric specimen was performed to verify the reliability of the peak area method, which will be introduced in the following section.
Variations of ferrite phase fraction calculated by lever rule and peak separation methods at various cooling rates: (a) 5 °C/min, (b) 10 °C/min, (c) 15 °C/min, and (d) 20 °C/min.

B. Effect of cooling rate on the phase fraction for ferrite and pearlite
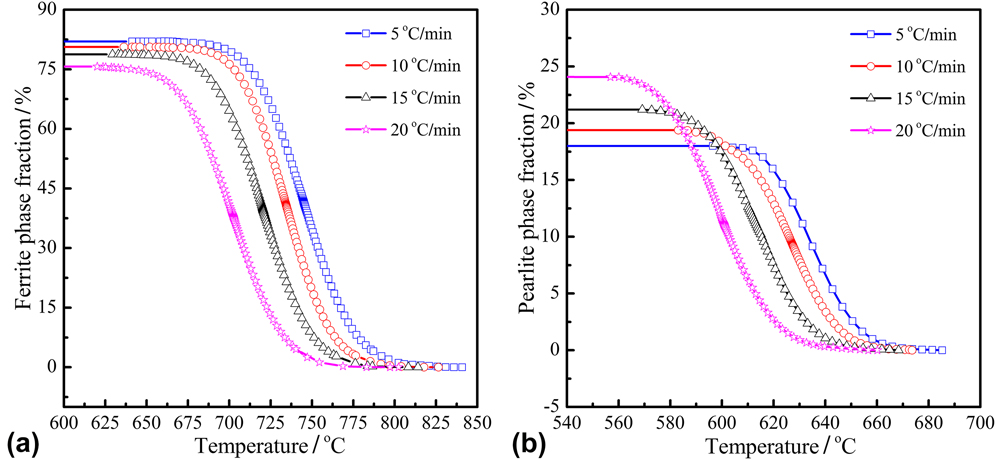
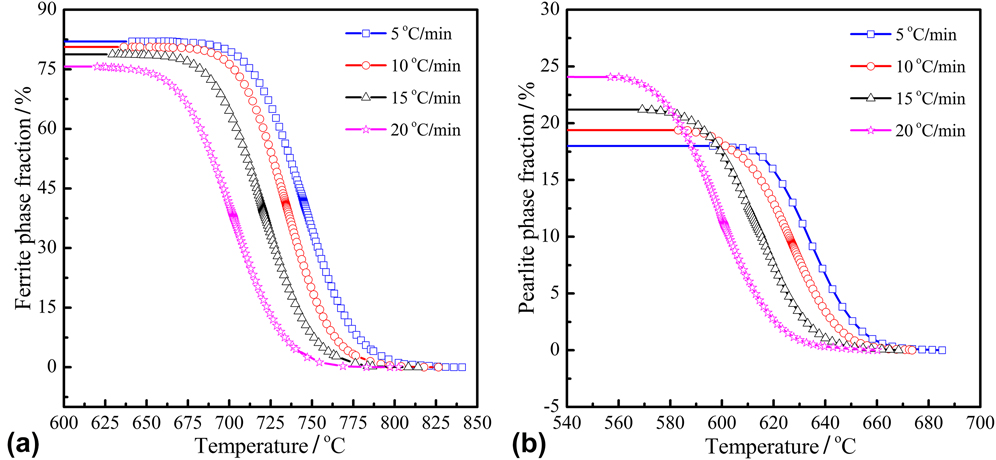
In the current study, the separated phase transformation peaks in the austenite decomposition zone were used to evaluate the phase fraction of ferrite and pearlite using peak area method. The variations of ferrite and pearlite phase fraction at various cooling rates are shown in Fig. 7. It was found that the ferrite phase fraction f a and pearlite phase fraction f P both increased with the decrease of temperature at various cooling rates. In the ferrite formation area, the final phase fraction of ferrite was, respectively, 82.07, 80.61, 78.82, and 75.75% with the increase of cooling rate from 5 to 20 °C/min. The final ferrite phase fraction after the completion of austenite decomposition with the cooling rate of 5 °C/min was greater than that of others’ cooling rates, as shown in Fig. 7(a). In the pearlite formation area, the final phase fraction of pearlite was, respectively, 17.93, 19.39, 21.18, and 24.25% with the increase of cooling rate from 5 to 20 °C/min. Contrary to the ferrite phase fraction, the final pearlite phase fraction after the completion of austenite decomposition was proportional to the cooling rate, as shown in Fig. 7(b). In other words, the higher cooling rate led the more pearlite phase fraction to be achieved after the completion of austenite decomposition. This is consistent with the previous studies.Reference Suh, Oh, Han and Kim32
Influence of the cooling rate on the phase fraction of ferrite and pearlite: (a) ferrite and (b) pearlite.
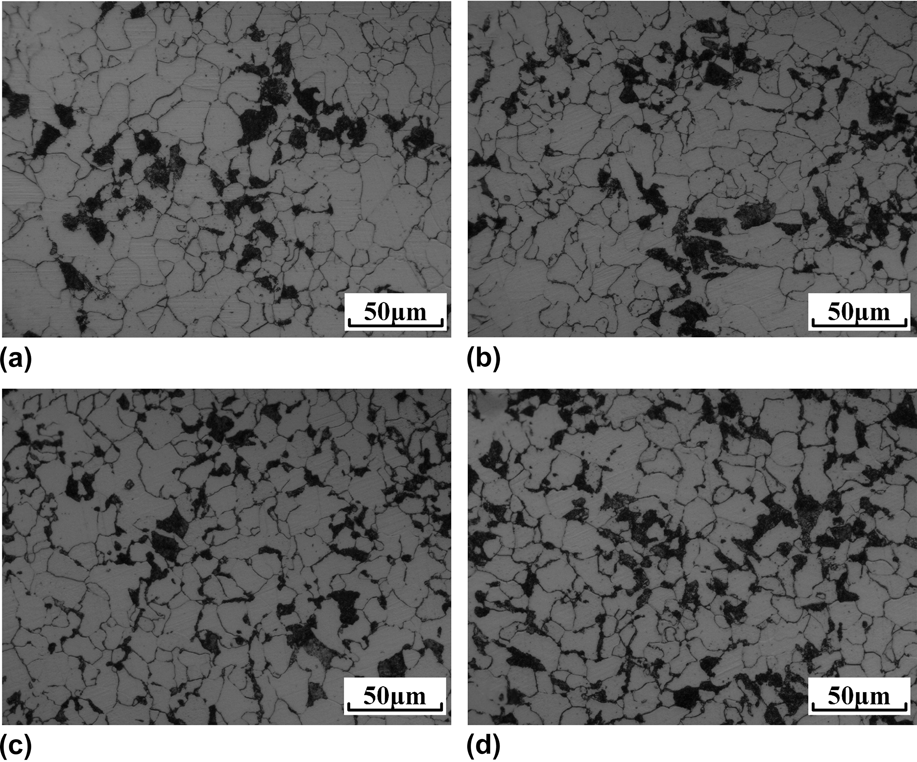
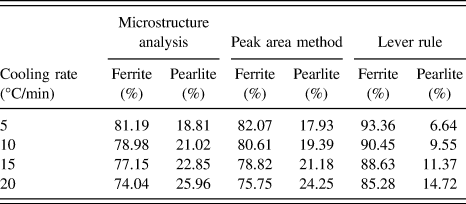
The results of microstructure analysis after the dilatometric test at various cooling rates are shown in Fig. 8. The light phase is ferrite, while the dark phase is pearlite. It was found clearly that the ferrite grains were refined with the increase in cooling rate. Additionally, as the cooling rate increased, the finer pearlite size and the more pearlite area were observed. In all analyzed samples, the mixture values of ferrite and pearlite were measured at room temperature using the image analysis software, IPP. The results of the quantitative analysis for phase fractions of ferrite and pearlite together with the results of phase fraction calculations using lever rule and peak area methods are shown in Table III. In the ferrite formation area, the final phase fraction of ferrite was, respectively, 81.19, 78.98, 77.15, and 74.04% with the increase of cooling rate from 5 to 20 °C/min. In the pearlite formation area, the final phase fraction of pearlite was, respectively, 18.81, 21.02, 22.85, and 25.96% with the increase of cooling rate from 5 to 20 °C/min. The pearlite phase fraction of dilatometric test specimens gradually increased with the increase of cooling rate. When the cooling rate was 20 °C/min, the measured pearlite fraction was increased by 7% compared with that of 5 °C/min. It was noteworthy that the results calculated by the peak area method basically coincided with the results of microstructure analysis. Nevertheless, there was an obvious difference between the results of the microstructure analysis and the results calculated by lever rule, which was obviously larger than that of the results calculated by peak area method and the results of microstructure analysis. The difference of final ferrite phase fraction was about 12% between the results from the lever rule method and the results of microstructure analysis. Similarly, the same difference was also existed in final pearlite phase fractions. These compared results also prove that the calculation results using peak area method can accurately reflect the actual phase fraction change during austenite decomposition. Meanwhile, the dilatometry can act as a generally experimental technique for the determination of critical temperatures (A r3, A r1, A ff, and A pf) and for the prediction of phase fraction variation during austenite decomposition in hypo-eutectoid steels.
Microstructure of dilatometric specimens under various cooling rates: (a) 5 °C/min, (b) 10 °C/min, (c) 15 °C/min, and (d) 20 °C/min.

Phase fraction of ferrite and pearlite at various cooling rates.

V. SUMMARY
In the current paper, some studies have been made to determine the critical temperature A r1 and A ff, which are hidden between two overlapped peaks on the LTEC versus the temperature curve. The microstructural evolution of titanium-microalloyed steel resulting from austenite decomposition had also been studied. The following summary can be made from the study:
(i) Pearlite transformation start temperature A r1 and ferrite transformation finish temperature A ff can be clearly obtained through peak separation processing, and the actual values of A r1 and A ff temperature are significantly different from the intersection point temperature T x between the overlapped peaks.
(ii) Four critical temperatures (A r3, A r1, A ff, and A pf) of austenite decomposition are retarded to lower temperature with the increase of cooling rate. The temperature interval of austenite decomposition decreases with the increase of cooling rate. The average value of the temperature difference in A r1 and T x is close to 30 °C; moreover, the average value of the temperature difference in T x and A ff is close to 10.5 °C.
(iii) The final ferrite phase fraction f a decreases with the increase of cooling rate, the final pearlite phase fraction f P increases with the increase of cooling rate. The results of final phase fractions f a and f P calculated by the peak area method coincide with the results of microstructure analysis of dilatometric specimens. Nevertheless, an obvious overstatement exists in the results calculated by lever rule.
(iv) Compared with the lever rule, the calculation result using peak area method can reflect the actual phase fraction change during austenite decomposition. Meanwhile, dilatometry can act as an experimental technique to evaluate the critical temperatures and predict the phase transition fraction variation during austenite decomposition.
ACKNOWLEDGMENTS
This work was supported financially by the Natural Science Foundation of China (NSFC, Project Nos. 51374260, 51504048, and 51611130062). The authors thank the members of Laboratory of Metallurgy and Materials, Chongqing University, for the support of this work.