1. Introduction
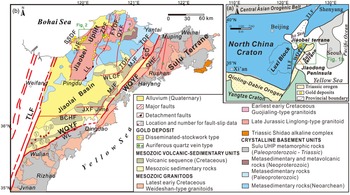
The North China Craton (NCC), resulting from the cratonization in the Palaeoproterozoic (c. 1.85 Ga) (Zhao et al. Reference Zhao, Sun, Wilde and Li2005), occupies a large part of East Asia towards the Pacific Ocean (Fig. 1a). The NCC acted as a stable block until the late Palaeozoic (Zhao et al. Reference Zhao, Sun, Wilde and Li2005; Santosh et al. Reference Santosh, Wilde and Li2007). It had been tectonically reactivated due to the collision to the north with the Palaeozoic Mongolian arcs during the Late Permian (Xiao et al. Reference Xiao, Windley, Hao and Zhai2003), and to the south with the Yangtze Craton (YC) in the Middle–Late Triassic (Dong et al. Reference Dong, Genser, Naebauer, Zhang, Liu, Yang and Heberer2011). The latter orogenesis led to the amalgamation of the Sulu terrane in the southeast with the Jiaobei terrane in the northwest via the lithospheric-scale ENE–WSW- to NE-SW-trending Wulian–Qingdao–Yantai Fault (WQYF), forming the Jiaodong Peninsula on the East Asian margin (Fig. 1a, b) (Guo et al. Reference Guo, Santosh and Li2013). It has been widely accepted that the subsequent tectonic evolution of the Jiaodong Peninsula was intimately related to the palaeo-Pacific subduction (Ratschbacher et al. Reference Ratschbacher, Hacker, Webb, McWilliams, Ireland, Dong, Calvert, Chateigner and Wenk2000; Sun et al. Reference Sun, Ding, Hu and Li2007). The convergent processes resulted in the de-cratonization and lithospheric thinning in the eastern NCC from the Late Jurassic to Early Cretaceous (Zhu et al. Reference Zhu, Niu, Xie and Wang2010), as well as the widely developed gold mineralization in the Jiaodong Peninsula during the Early Cretaceous (Wang et al. Reference Wang, Yang, Guo, Marsh, Wang, Liu, Zhang, Li, Zhang, Zheng and Zhao2015). The palaeo-Pacific plate subducted towards East Asia at varying speeds and angles since the Mesozoic (Liu et al. Reference Liu, Gurnis, Ma and Zhang2017), and there were significant changes in subduction direction in the Early Cretaceous from the WNW during 139−122 Ma to the NW during 121−95 Ma (Sager, Reference Sager2006; Zhu & Xu, Reference Zhu and Xu2019). Nevertheless, the Early Cretaceous palaeostresses driving the gold deposits in the Jiaodong Peninsula (Fig. 1a, b), one of the major gold provinces globally and the leading gold producer in China (Zhu et al. Reference Zhu, Fan, Li, Meng and Li2015), are still under debate.
(a) A simplified tectonic map of the North China craton showing the location of the Jiaodong Peninsula, the distribution of late Mesozoic intrusions, and major districts hosting large gold deposits in the eastern half of the craton (modified from Li et al. Reference Li, Bi, Selby, Chen, Vasconcelos, Thiede, Zhou, Zhao, Li and Qiu2012). (b) A simplified geological map of the Jiaodong Peninsula showing the distribution of Precambrian crystalline basement, Triassic UHP metamorphic rocks, Cretaceous volcanic–sedimentary sequence, Mesozoic granitoids, major structures, and representative gold deposits (modified from Wang et al. Reference Wang, Yang, Guo, Marsh, Wang, Liu, Zhang, Li, Zhang, Zheng and Zhao2015). The locations for fault-slip data are from B Zhang et al. (Reference Zhang, Weinberg, Yang, Groves, Sai, Matchan, Phillips, Kohn, Miggins, Liu and Deng2020). Main faults: WQYF, Wulian–Qingdao–Yantai Fault; TLF, Tan–Lu Fault; ZPF, Zhaoping Fault; SSDF, Sanshandao Fault; JJF, Jiaojia Fault; FYDF, Fengyidian Fault; QXF, QiXia Fault; TDF, Taocun–Dongdoushan Fault; MJF, Muping–Jimo Fault; QHF, Qingdao–Haiyang Fault; MRF, Muping–Rushan Fault; WLCF, Wulongcun Fault; JXF, Jiuxian Fault; BCHF, Baichihe Fault. Metamorphic Core Complex (MCC): LL, Linglong MCC; WL, Wulian MCC; QS, Queshan MCC. Fault-slip data:I, K1Ly-05; II, K1ly-06; III, K1Ly-07; IV, K1ly-10; V, K1Ly-25; VI, K1ly-27.

Previous geochemical and geochronological studies on magmatic activities, large-scale gold mineralization and the formations of the volcanic–sedimentary basins in the Jiaodong Peninsula led to strong controversies on the Early Cretaceous palaeostresses (Zhu et al. Reference Zhu, Wang, Liu, Niu, Xie and Li2005; Sun et al. Reference Sun, Ding, Hu and Li2007; Wang et al. Reference Wang, Chang, Chen and Yan2019). The tectonic regime in the Jiaodong Peninsula during the Early Cretaceous has been suggested to be (a) changing from extension (140−125 Ma) through transpression (125−120 Ma) to extension (120−100 Ma) (Zhu et al. Reference Zhu, Wang, Liu, Niu, Xie and Li2005; Sun et al. Reference Sun, Ding, Hu and Li2007), (b) changing from extension (140−122 Ma) through transpression (122−111 Ma) to extension (110−100 Ma) (Wang et al. Reference Wang, Chang, Lin, Lu, Zhu, Fu and Zhang2016, Reference Wang, Chang, Chen and Yan2019) or (c) changing from compression to extension at c. 120 Ma (KF Yang et al. Reference Yang, Dilek, Wang, Weinberg and Liu2018). On the other hand, fault-slip analyses in the Jiaolai Basin (Fig. 1b) (YQ Zhang et al. Reference Zhang, Dong and Shi2003, Reference Zhang, Li, Zhang, Dong and Yuan2008; Ren et al. Reference Ren, Zhang, Qiu, Liu and Wang2007; B Zhang et al. Reference Zhang, Weinberg, Yang, Groves, Sai, Matchan, Phillips, Kohn, Miggins, Liu and Deng2020) suggest an extensional tectonic regime only, with the extensional direction showing rotation in the Jiaodong Peninsula during the Early Cretaceous. However, both the model and the timing of the rotation of extensional direction remain controversial, including from N–S to WNW–ESE at 120 Ma (Zhang et al. Reference Zhang, Dong and Shi2003), from NW–SE to WNW–ESE at 115 Ma (Ren et al. Reference Ren, Zhang, Qiu, Liu and Wang2007), from NW–SE to WNW–ESE at 120 Ma (Zhang et al. Reference Zhang, Li, Zhang, Dong and Yuan2008) and from E–W to NW–SE at 120 Ma (B Zhang et al. Reference Zhang, Weinberg, Yang, Groves, Sai, Matchan, Phillips, Kohn, Miggins, Liu and Deng2020). These controversies may be due to multiple deformation events experienced by these faults (Zhang et al. Reference Zhang, Li, Zhang and Yuan2007), the complex chronostratigraphic sequence and the inaccurate strata dating in the Jiaolai Basin (B Zhang et al. Reference Zhang, Weinberg, Yang, Groves, Sai, Matchan, Phillips, Kohn, Miggins, Liu and Deng2020).
Lamprophyre dikes and hydrothermal quartz veins, usually showing tabular geometric features, provide vital information on the palaeostresses under which they formed (Mazzarini & Musumeci, Reference Mazzarini and Musumeci2008; Skarmeta, Reference Skarmeta2011; Martinez-Poza & Druguet, Reference Martinez-Poza and Druguet2016). In particular, they have been considered to be normal to the regional least principal compressive stress (
 ${\sigma _3}$
) direction (Babiker & Gudmundsson, Reference Babiker and Gudmundsson2004). Thus, the orientations of lamprophyre dikes or quartz veins can be directly used to infer the directions of palaeostresses (Gudmundsson & Marinoni, Reference Gudmundsson and Marinoni2002). However, the shapes of dikes and veins are usually strongly affected by the mechanical properties of their host rocks. They seldom dilate a single fracture in most cases, whereas they are often arranged on arrays of sub-parallel segments and fingers with shapes that depend on the host-rock lithology, stress field and pre-existing fractures (Pollard et al. Reference Pollard, Muller and Dockstader1975; Baer, Reference Baer1991). In general, dikes and veins propagate along the older fractures not necessarily normal to the
 ${\sigma _3}$
direction (Delaney et al. Reference Delaney, Pollard, Ziony and McKee1986; Khodayar & Einarsson, Reference Khodayar and Einarsson2002), which results in their attitude variations (Sato et al. Reference Sato, Yamaji and Tonai2013). Therefore, in these instances, lamprophyre dikes and quartz veins do not pertain to a simple relation to the regional stress field (Mazzarini & Musumeci, Reference Mazzarini and Musumeci2008; Creixell et al. Reference Creixell, Parada, Morata, Vásquez, Arce and Arriagada2011). Fortunately, the variations in the orientations of the dikes and veins carry clues to the parameters of stress tensors (Baer et al. Reference Baer, Beyth and Reches1994; Sato et al. Reference Sato, Yamaji and Tonai2013), and the development of palaeostress inversion techniques for dilatant fractures, such as dikes and veins, has made it possible to determine three-dimensional palaeostress conditions by analysis of their attitude variations (Baer et al. Reference Baer, Beyth and Reches1994; Jolly & Sanderson, Reference Jolly and Sanderson1997; Yamaji & Sato, Reference Yamaji and Sato2011; Yamaji, Reference Yamaji2016; Faye et al. Reference Faye, Yamaji, Yonezu, Tindell and Watanabe2018). These techniques are based on the mechanical fundamental that whether the fracture reopens or not is controlled by the equilibrium of the normal stress (σ
n) and the fluid pressure (
 ${P_{\rm{f}}}$
) imposed on it (Anderson, Reference Anderson1939; Delaney et al. Reference Delaney, Pollard, Ziony and McKee1986; Pollard, Reference Pollard1987). Nevertheless, the magnitude of σ
n rests with the fracture orientation, which results in the dilatant fractures showing the anisotropic orientation distribution (Sato et al. Reference Sato, Yamaji and Tonai2013). Accordingly, using these techniques, the directions of the three principal stress axes
 ${\sigma _1}$
,
 ${\sigma _2}$
and
 ${\sigma _3}$
, with
 ${\sigma _1} \ge {\sigma _2} \ge {\sigma _3}$
of the stress ellipsoid, and its stress ratio
 ${\rm{\Phi }}$
= (
 ${\sigma _2}$
−
 ${\sigma _3}$
)/(
 ${\rm{\;}}{\sigma _1}$
−
 ${\sigma _3}$
) with
 $1 \ge {\rm{\Phi }} \ge 0$
, i.e. the ratio of the relative magnitudes of the principal stresses (Bishop, Reference Bishop1966; Angelier, Reference Angelier1975), as well as the driving pressure ratio R′ = (P
f −
 ${\sigma _3}$
)/(
 ${\sigma _1}$
−
 ${\sigma _3}$
), which defines the magnitude of the fluid pressure (P
f) in relation to the maximum and minimum principal stresses (Baer et al. Reference Baer, Beyth and Reches1994), can be defined (Jolly & Sanderson, Reference Jolly and Sanderson1997; Martínez-Poza et al. Reference Martinez-Poza, Druguet, Castaño and Carreras2014; Faye et al. Reference Faye, Yamaji, Yonezu, Tindell and Watanabe2018). Thus, the stress regime related to the emplacement of the dikes and veins can be inferred (André et al. Reference André, Sausse and Lespinasse2001; Mondal & Mamtani, Reference Mondal and Mamtani2013; Goswami et al. Reference Goswami, Lahiri and Mamtani2021). Therefore, undeformed dikes and veins are among the most important structural elements applied for palaeostress analysis (Pollard, Reference Pollard1987; Mazzarini et al. Reference Mazzarini, Isola, Ruggieri and Boschi2010; Jaques & Pascal, Reference Jaques and Pascal2017; Lahiri et al. Reference Lahiri, Rana, Bhatt and Mamtani2020).
Lamprophyre dikes and hydrothermal quartz veins were widely developed in the gold deposits in the Jiaodong Peninsula (Wang et al. Reference Wang, Yang, Guo, Marsh, Wang, Liu, Zhang, Li, Zhang, Zheng and Zhao2015; Li et al. Reference Li, Li, Santosh, Li, Gu, Lü, Zhang, Shen and Zhao2016). Due to the limited outcrops, we could not perform the systematic geological survey on the dikes and quartz veins on the surface. However, the 22 levels of block caving between −40 m and −870 m elevation in the Sizhuang gold mine, located at the southern extremity of the Jiaojia gold camp in northwest Jiaodong Peninsula (Figs 1a and 2), have revealed the lamprophyre dikes and quartz veins underground systematically. The excellent underground exposures of lamprophyre dikes and quartz veins in the Sizhuang mine allow us to comprehensively investigate their geometric properties and attitudes along-strike and -dip in this study. This paper first reports the structural patterns of the lamprophyre dikes and quartz veins in the Sizhuang gold deposit, then employs the fuzzy clustering technique of Yamaji and Sato (Reference Yamaji and Sato2011) to infer the three-dimensional (3D) palaeostress state and the driving fluid pressure during the formation of the lamprophyre dikes and quartz veins. In addition, given that no information on the emplacement age of the lamprophyre dikes in Sizhuang has been published, we performed the 40Ar–39Ar dating on the phlogopites selected from the lamprophyre dikes to constrain the time of structural deformation when the dikes were formed.
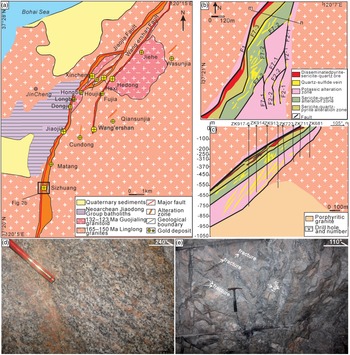
(a) A simplified geological map of the Jiaojia gold camp showing the distribution of ore-controlling structures and representative gold deposits (modified from Wang et al. Reference Wang, Yang, Guo, Marsh, Wang, Liu, Zhang, Li, Zhang, Zheng and Zhao2015). Differently sized symbols of gold deposits show different gold resources: the larger symbols shows Au > 50 t, and the smaller symbols show Au < 50 t. The Sizhuang gold deposit is situated in the southern part of the Jiaojia Fault. (b) Geologic map and (c) typical cross-section of the ore body and fault zone in the Sizhuang gold deposit, showing the structural controls on hydrothermal alteration and mineralization. (d) Field view of the gneissic foliation in the fresh Linglong granite. (e) Field view of faults and fractures affecting the K-feldspar altered granite.

The present work obtains the timing and the palaeostress states during the emplacement of the lamprophyre dikes and quartz veins in the Sizhuang gold deposit and further sheds new light on the Early Cretaceous stress regime in the Jiaodong Peninsula.
2. Geological setting
The Jiaodong Peninsula, located at the southeastern margin of NCC, consists of the Sulu terrane in the southeast and the Jiaobei terrane in the northwest (Fig. 1a). The two terranes are separated by the lithospheric-scale ENE- to NE-trending Wulian–Qingdao–Yantai Fault (WQYF; Fig. 1a, b). The Jiaodong Peninsula is bounded by the Pacific Plate to the east and separated from the Luxi Block of the NCC by the 2400 km long NNE–SSW- (between 010° and 025°) trending and steeply dipping Tan-Lu Fault (TLF) to the west (Yan et al. Reference Yan, Zhu, Lin and Zhao2014). The striking feature of the peninsula is the regional-scale NNE–SSW- to NE–SW-striking faults, which were developed either in the cratonic interior or along pre-existing suture zones like the TLF, Zhaoyuan–Pingdu Fault (ZPF) and WQYF, respectively, from west to east (Fig. 1b; Liu et al. Reference Liu, Ji, Ni, Shen, Zheng, Chen and Craddock2021).
The basement in the Sulu terrane, to the southeast of the WQYF, is composed of Palaeoproterozoic and Neoproterozoic crystalline rocks of YC (Li et al. Reference Li, Xiao, Liu, Chen, Ge, Zhang, Sun, Cong, Zhang, Hart and Wang1993) and was subjected to an ultrahigh-pressure (UHP) metamorphic event at c. 244−220 Ma (Cong, Reference Cong1996). The Jiaobei terrane to the northwest of the WQYF (Faure et al. Reference Faure, Lin and Breton2001) includes the Jiaobei Uplift and the Jiaolai Basin (Fig. 1b; Wang et al. Reference Wang, Yang, Deng, Santosh, Zhang, Liu, Li, Huang, Zheng and Zhao2014). The Jiaobei Uplift is mainly composed of the Precambrian high-grade metamorphic rocks of NCC (Fig. 1b; Tang et al. Reference Tang, Zheng, Wu, Gong and Liu2007). The latter rocks were intruded by the Linglong granite between 163 and 149 Ma (Yang et al. Reference Yang, Fan, Santosh, Hu, Wilde, Lan, Lu and Liu2012), which subsequently uplifted between c. 143 and 128 Ma during the exhumation of the Linglong metamorphic core complex (Charles et al. Reference Charles, Augier, Gumiaux, Monie, Chen, Faure and Zhu2013) and the contemporaneous formation of the Jiaolai Basin (Liu et al. Reference Liu, Ji, Ni, Shen, Zheng, Chen and Craddock2021). The Jiaolai Basin consists of the clastic and volcanic rocks that span the period from 135 Ma (Ni et al. Reference Ni, Liu, Tang, Yang, Xia and Zhang2016) to 55 Ma and is grouped into the Laiyang, Qingshan, Dasheng, Wangshi and Wutu Groups from bottom to top (B Zhang et al. Reference Zhang, Weinberg, Yang, Groves, Sai, Matchan, Phillips, Kohn, Miggins, Liu and Deng2020). Except for the limited occurrence of 215−200 Ma Shidao alkaline complex occurring in the southeastern boundary of the Sulu terrane (Yang et al. Reference Yang, Chung, Wilde, Wu, Chu, Lo and Fan2005), the widely developed magmatism both in the Jiaobei Uplift and the Sulu terrane occurred during the Late Jurassic – Early Cretaceous (Fig. 1b; Wang et al. Reference Wang, Yang, Deng, Santosh, Zhang, Liu, Li, Huang, Zheng and Zhao2014). The Late Jurassic Linglong-type granitoids usually exhibit a NNE–SSW-trending mylonitic foliation associated with the WNW–ESE-trending stretching lineations (LQ Yang et al. Reference Yang, Dilek, Wang, Weinberg and Liu2018). In contrast, the Early Cretaceous granitic plutons are undeformed (QY Yang et al. Reference Yang, Deng, Goldfarb, Zhang, Gao and Wang2014).
The emplacement of the Late Jurassic Linglong-type granitoids, with the magmas produced by the partial melting of the juvenile crust with the alkaline rocks of the Sulu terrane and the lower crust containing the garnet–amphibolite of the Jiaobei terrane (Hou et al. Reference Hou, Jiang, Jiang, Ling and Zhao2007), was induced by the rapid and steepening rollback of the Palaeo-Pacific plate during 165−160 Ma (LQ Yang et al. Reference Yang, Dilek, Wang, Weinberg and Liu2018). The latter symbolized the initiation of a lithospheric tectonic extension and the associated magmatism in the Jiaodong Peninsula, which continued into the Early Cretaceous time (Liu et al. Reference Liu, Rudnick, Walker, Xu, Gao and Wu2015). Accordingly, in the Early Cretaceous time (135−110 Ma), the crustal deformation in the Jiaodong Peninsula was dominated by various extensional structures, such as extensional basins, normal faults, low-angle detachment faults and metamorphic core complexes (MCCs) (Fig. 1; Liu et al. Reference Liu, Ji, Ni, Shen, Zheng, Chen and Craddock2021), accompanied by extensive gold mineralization (Fig. 1; Goldfarb et al. Reference Goldfarb, Taylor, Collins, Goryachev and Orlandini2014).
The Precambrian basement rocks in the Jiaobei terrane display a gross E–W-trending tectonic fabric at a regional scale prior to the emplacement of the Late Jurassic Linglong-type granitoids, which is associated with the broadly E–W-trending reverse faults and ENE–WSW- to E–W-trending shear zones in the Archaean and Palaeoproterozoic rocks (Lu et al. Reference Lu, Archambault, Li and Wei2007). By contrast, the Mesozoic magmatic rocks, the MCCs, the Jiaolai Basin and the crustal- to lithospheric-scale oblique-slip faults showing both transpressional and transtensional kinematics, i.e. TLF and WQYF (Meng, Reference Meng2003; Wang et al. Reference Wang, Zheng, Zhang, Zeng, Donskaya, Guo and Li2011), collectively exhibit strong NE–SW- to NNE–SSW-aligned tectonic fabric (Fig. 1b; LQ Yang et al. Reference Yang, Dilek, Wang, Weinberg and Liu2018).
The TLF developed as a Late Jurassic left-lateral strike-slip fault and then reactivated as a normal fault in the Early Cretaceous, controlling the development of the Jiaolai Basin (Fig. 1; Zhu et al. Reference Zhu, Niu, Xie and Wang2010). However, more recently, B Zhang et al. (Reference Zhang, Weinberg, Yang, Groves, Sai, Matchan, Phillips, Kohn, Miggins, Liu and Deng2020) argued that the TLF initially occurred as a normal fault under a NW–SE extension from c. 120 to 93 Ma, postdating the deposition of the Laiyang Group under the E–W extension between c. 135 and 122 Ma. The E–W extension led to the activity of the WQYF along the suture zone connecting the Jiaobei and Sulu terranes (B Zhang et al. Reference Zhang, Weinberg, Yang, Groves, Sai, Matchan, Phillips, Kohn, Miggins, Liu and Deng2020). The WQYF, striking ENE–WSW to NE–SW and dipping at gentle to medium angles to the NNW to NW (B Zhang et al. Reference Zhang, Weinberg, Yang, Groves, Sai, Matchan, Phillips, Kohn, Miggins, Liu and Deng2020), is considered to occur in the upper-middle crust from c. 135 to 122 Ma, causing the initial expansion of the Jiaolai Basin, then progressing into the lithospheric mantle from c. 122 to 110 Ma (Liu et al. Reference Liu, Ji, Ni, Shen, Zheng, Chen and Craddock2021). Many lower-order faults, striking NNE–SSW to NE–SW, were developed within the Jiaobei Uplift and the Sulu terrane. On the other hand, only a few nearly E–W normal faults occurred within the Jiaolai Basin (Fig. 1b). The NNE- to NE-trending faults with dips either to the NW or SE are distributed across the Jiaobei Uplift and the Sulu terrane, with an interval of c. 15–35 km, on both sides of the ZPF and WQYF (Fig. 1b), which are named as the Sanshandao, Jiaojia, Fengyidian, Qixia, Taocun–Dongdoushan, Muping–Jimo, Qingdao–Haiyang and Muping–Rushan faults from west to east (Fig. 1b), respectively.
The Jiaojia Fault, striking NNE–SSW (between 010° and 030°) and dipping WNW with angles of 20– 40°, controls the Sizhuang gold deposit (Fig. 2a). The mine is established on the Linglong granite (Fig. 2b), which was replete with many irregular and discontinuous lamprophyre dikes, and a great number of quartz veins (Wei et al. Reference Wei, Yang, Feng, Wang, Lv, Li and Liu2019; Fig. 2c). The host granite is dominated by a gneissic foliation better seen in the fresh exposures (Fig. 2d) that generally trends NNE–SSW to NE–SW (Wang et al. Reference Wang, Yang, Guo, Marsh, Wang, Liu, Zhang, Li, Zhang, Zheng and Zhao2015), and the faults and fractures better seen in the altered parts of the granite (Fig. 2e). Three alteration zones are identified in the footwall of the Jiaojia Fault, going from the unaltered granite to the Jiaojia Fault plane (Fig. 2b): (a) the potassic, (b) the sericite–quartz and (c) the pyrite–sericite–quartz alteration zone. The pyrite–sericite–quartz alteration zone was characterized by a network of multi-directional quartz–sulphide veinlets, typically 0.2 to 1 cm thick (Fig. 2b). In the sericite–quartz and potassic alteration zones, the veins are mainly single quartz–sulphide veins varying from 1 to 500 cm in thickness, controlled by the brittle fracture networks (Fig. 2b).
3. Lamprophyre dikes and quartz veins of the Sizhuang gold deposit: occurrence, sampling and acquisition
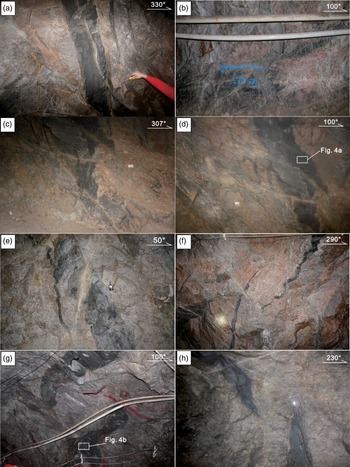
Lamprophyre dikes are abundant and cut across the Linglong granite in the Sizhuang mine with lengths of several tens of metres to more than 100 m. Most dikes occur within the altered granites, are sub-vertical and, as a rule, have variable strike orientations such as WNW–ESE (Fig. 3a), NNW–SSE (Fig. 3b, e), NNE–SSW (Fig. 3c, d, f, g) and NW–SE (Fig. 3h), although only a few dikes are inclined (Fig. 3c, d). Their thicknesses vary from 8 to 90 cm. As observed in the underground Sizhuang gold mine, the lamprophyre dikes show sharp contacts, with some chilled, against the host Linglong granite (Fig. 3a–h). Few dikes are straight with parallel edges in sub-vertical sections (Fig. 3a) because most dikes are displaced, forming continuous (Fig. 3b–e) or discontinuous dike bodies (Fig. 3f–h) and zigzag (Fig. 3b) or sinuous shapes along their long dimensions (Fig. 3c–h). In some cases, displacements cause much more complicated dike patterns (Fig. 3b, c). Nevertheless, it seems that the dike bodies are aligned parallel to the pre-existing joints trending ∼N0°–N042° (Fig. 3d) and ∼N130°–N175° (Fig. 3b, e), showing that the magma propagation took place along the pre-existing joint sets (Fig. 3d, e).
Field photographs of the lamprophyre dikes in the Sizhuang gold deposit. (a) WNW-striking steep-dipping lamprophyre dike, with sharp straight contacts and (b) NNW–SSE-striking continuous dike segments, with non-overlapping and zigzag morphologies, in the K-feldspar altered granites. (c) NNE–SSW-striking dike segments with non-overlapping morphologies and horns beyond the offset step. (d) NNE–SSW-striking dike with small stepping continuous offsets in the K-feldspar altered granites. Note the localized dike-normal quartz veins near the stepovers in (c) and (d). (e) NNW-striking continuous dike segments with small stepping offset and horn beyond the offset step in the sericite–quartz altered granites. Note the quartz vein cutting through the step segment sharply. (f) NNE–SSW-striking discontinuous dike segments with lower-stepping overlapping offsets in the K-feldspar altered granites. Note the dike-normal quartz veins restricted to rock-bridge zone. (g) NNE-striking discontinuous dike segments with upper-stepping non-overlapping offsets in the sericite–quartz altered granites. Note the slight curvatures around dike tips. (h) NW–SE-striking discontinuous dike segments with lower-stepping non-overlapping offsets in the sericite–quartz altered granites. Note the slight curvature in the internal part and the thin apophyse in the outer part around dike tips.

The fact that slickenlines have hardly been observed along the dike margins implies more dilational than shear intrusion origin. Discontinuous dikes are characterized by an en echelon array of long tabular bodies striking NNE–SSW (∼0–042°; Fig. 3f, g) and NW–SE to NNW–SSE (∼130–175°; Fig. 3h), respectively. They form upwards-, left- or right-stepping geometries (Fig. 3f) with or without overlapping (Fig. 3g, h). Dike tips are frequently bent, appearing as horn structures (Fig. 3f–h), whereas apophyses between two opposite-directed dike tips often occur (Fig. 3h). In addition, some quartz veins oriented at high angles or perpendicular to the dikes occur within the bridge zones formed by the ∼N0°–N042° dikes (Fig. 3f) but not along the ∼N130°–N175° dikes (Fig. 3h).
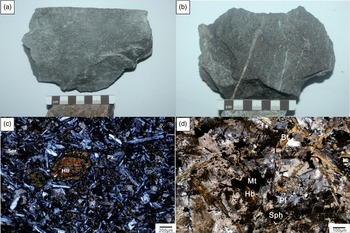
Based on the detailed field and structural observations, two representative fresh and non-deformed lamprophyre dike samples of SZ16D004B1 (Fig. 4a) and SZ16D002B2 (Fig. 4b) were picked from the underground adits in the Sizhuang gold deposit. The sample SZ16D004B1 (Fig. 4a) was collected from a lamprophyre dike cutting the K-feldspar altered granite with a dip to the NW at 60° (300−60°) (Fig. 3d). The sample SZ16D002B2 (Fig. 4b) was collected from a lamprophyre dike dipping WNW at 70° (290–70°), which cut the sericite–quartz altered granite (Fig. 3g). They are porphyritic to equigranular and consist of pyroxene, biotite, phlogopite and hornblende phenocrysts in a microcrystalline matrix of pyroxene, biotite, phlogopite, hornblende and plagioclase accompanied by accessory minerals including sphene, magnetite and zircon (Fig. 4c, d). These samples are used for dating the lamprophyre dikes with the 40Ar–39Ar analysis of the phlogopite.
Hand sample and micro-scale photographs of the lamprophyre dikes in the Sizhuang gold deposit. (a, b) Lamprophyre dike samples SZ16D004B1 and SZ16D002B2 for 40Ar–39Ar dating. (c) Pyroxene and hornblende phenocrysts in an undeformed matrix of pyroxene, biotite, hornblende and plagioclase. (d) Biotite, hornblende and plagioclase, with accessory minerals of zircon, sphene and magnetite. Mineral abbreviations: Hb = hornblende, Px = pyroxene, Bt = biotite, Mt = magnetite, Pl = plagioclase, Sph = sphene, Ser = sericite.

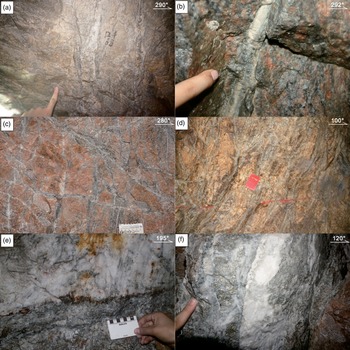
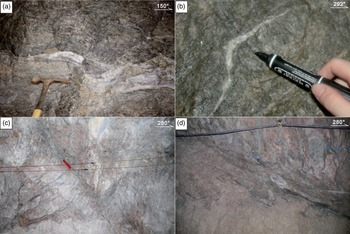
In general, the quartz veins show rough surfaces without slickenlines and tapering geometries (Fig. 5a) and have quartz crystals (sub)perpendicular to the fracture wall (Fig. 5b), indicating the dilational origin. Their lengths are usually more than 1 m and can be up to 200 m, whereas their thicknesses vary between 2 mm and 5 m. The smaller veins with lengths up to 20 m usually form a mesh-like structure with mutually cross-cutting relationships (Fig. 5c). In contrast, the bigger veins usually occur, in (sub)parallel bands (Fig. 5d, e), although in a few cases one band intersects another (Fig. 5f). In addition, while most of them have planar shapes (Fig. 5a–f), some zigzag or curved alignments can be observed (Fig. 6a, b). The rough surfaces of the veins and the zigzag or curved alignments suggest the mode I or mixed-mode formation of the filled cracks. In addition, many veins are accompanied by offshoots, which depart either clockwise or anticlockwise from them (Fig. 6c, d).
Field photographs showing the occurrence of the quartz veins in the Sizhuang gold deposit. (a) Quartz vein with tapering geometry; (b) quartz veins with the quartz grains growing perpendicular to the fracture walls; (c) quartz veins showing a mesh-like structure with mutually cross-cutting relationships; (d) sub-parallel banded quartz veins; (e) banded quartz veins; (f) banded quartz veins including a few bands of different orientations.

Field photographs showing the geometry of the quartz veins in the Sizhuang gold deposit. (a) Quartz veins consisting of the curved segments longer than 1 m; (b) quartz veins consisting of curved segments with sharp bends and shorter than 1 m; (c, d) main veins accompanied by offshoots oriented either clockwise or anticlockwise from main veins.

The attitudes of the lamprophyre dikes and quartz veins in the underground shaft of the Sizhuang mine were collected in two perpendicular directions from drive to drive in the study area, i.e. parallel and perpendicular to the mean strike (015°) of the main ore body. Based on the data acquisition technique and principle of Yamaji et al. (Reference Yamaji, Sato and Tonai2010) and Lahiri and Mamtani (Reference Lahiri and Mamtani2016), the threshold values of 0.5 cm and 1 m for the thickness and length, respectively, of a mining face are used in the present study. For the dikes and quartz veins, if they are planar and single, the orientations were measured when they fitted the above criteria; if they are planar and banded, each band meeting the criteria was measured. In the case of curved dikes and quartz veins, the attitude of each planar segment of those fitting the criteria was collected, whereas if they were longer than the threshold but had short-wavelength curves, we measured the average attitude.
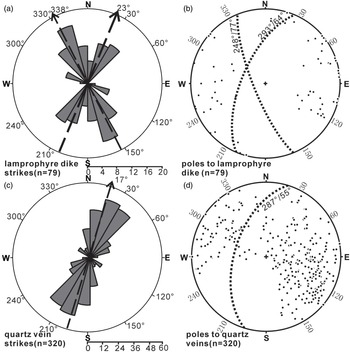
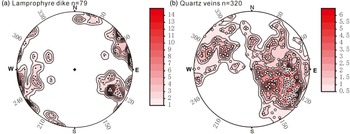
Orientation data of 79 lamprophyre dikes and 320 quartz veins were collected in the underground shaft of the Sizhuang gold deposit. The lamprophyre dikes strike mainly NNW–SSE and NNE–SSW, whereas WNW–ESE is a subordinate direction (Fig. 7a, b). The NNW–SSE-striking set is the most populated, including the strikes from azimuths 310° to 355°, with an average azimuth at 338° (Fig. 7a). The NNE–SSW-striking set includes the strikes from azimuths 0 to 042°, with an average azimuth at 023° (Fig. 7a). The WNW–ESE-striking set only accounts for a small percentage of the very steep to almost vertical dikes striking from 275° to 295° (Fig. 7a, b). These dikes are shorter than those grouped into the two main sets (Fig. 3c–f). Moreover, the dikes dipping in general to the W are well separated into two sets, but not the dikes dipping to the E (Fig. 7b).
(a) Rose diagram of 79 dike segments from the Sizhuang gold deposit; dashed lines represent the mean strikes of the two main sets formed by NNW–SSE- and NNE–SSW-trending lamprophyre dikes. (b) lower-hemisphere, equal-area stereogram of poles to 79 dike segments from the Sizhuang gold deposit; dashed great circles represent the mean orientations of dikes trending NNW and NNE. (c) Rose diagram of 320 quartz veins from the Sizhuang gold deposit; the dashed line represents the mean strike of 320 quartz veins. (d) Lower-hemisphere, equal-area stereograms of poles to 320 quartz veins from the Sizhuang gold deposit; dashed great circles represent the mean orientation of 320 quartz veins.

Since a cross-cutting relationship between the two dike sets can hardly be concluded, we imagine the differently oriented dikes have intruded into the pre-existing fractures with geometries induced by the left-lateral strike-slip tectonics mentioned for the TLF during Late Jurassic times (Zhu et al. Reference Zhu, Niu, Xie and Wang2010). In particular, these fractures are (a) NNE–SSW-striking fractures dipping to the WNW parallel to the Jiaojia Fault, (b) NNW–SSE-striking Riedel shears dipping to the WSW, and (c) WNW–ESE-striking R′ Riedel shears dipping to the SSW.
The quartz veins strike mainly NNE–SSW with azimuths from 0° to 45° and a mean azimuth at 017° dipping towards the WNW in their majority (>70%) (Fig. 7c, d). As a rule, they seem to have followed fractures parallel to the Jiaojia Fault.
It has been observed that the quartz veins cut sharply across the NNW–SSE- (∼310°–355°) trending continuous dikes (Fig. 3e), showing that the NNW–SSE-trending lamprophyre dikes formed earlier than the quartz veins. Furthermore, some quartz veins with high angles or perpendicular to the dikes occur within the bridge zones formed by the NNE–SSW- (∼0–042°) trending dikes (Fig. 3f) but not the dikes trending NNW–SSE (∼310–355°) (Fig. 3c, e).
4. Methodology
4.a. Fracture-orientation analysis and stress inversion
The first 3D palaeostress analysis using the dilatant fractures was possible through the technique proposed by Baer et al. (Reference Baer, Beyth and Reches1994). This technique extended the two-dimensional (2D) analytical approach of Delaney et al. (Reference Delaney, Pollard, Ziony and McKee1986), which was based on the mechanical fundamental that the pre-existing fracture could be opened if P
f exceeds the normal stress (
 ${\sigma _{\rm{n}}}$
) acting on its walls (Anderson, Reference Anderson1939). The 3D analytical technique analysed the attitude variations of the dilatant fractures like the dikes and veins by calculating the border of the region of poles to dilatant fractures on a stereographic projection (Baer et al. Reference Baer, Beyth and Reches1994). Later it was improved by the Jolly–Sanderson graphical method (Jolly & Sanderson, Reference Jolly and Sanderson1997). Several recent studies have employed the Jolly–Sanderson method to determine the palaeostress state and the driving fluid pressure (
 ${P_{\rm{f}}}$
) when dikes or veins formed (Mckeagney et al. Reference McKeagney, Boulter, Jolly and Foster2004; Mazzarini & Isola, Reference Mazzarini and Isola2007; Bhatt et al. Reference Bhatt, Rana, Lahiri and Mamtani2019; Goswami et al. Reference Goswami, Lahiri and Mamtani2021). For the method, the number density of the poles to the fractures must change abruptly towards the border so that the poles can be readily divided into two domains, one with data points and the other without, on the stereogram (see fig. 3a in Sato et al. Reference Sato, Yamaji and Tonai2013). The shape and position of the border between the two domains indicate the palaeostress state (Baer et al. Reference Baer, Beyth and Reches1994; Jolly & Sanderson, Reference Jolly and Sanderson1997; Yamaji et al. Reference Yamaji, Sato and Tonai2010; Sato et al. Reference Sato, Yamaji and Tonai2013). In many cases, however, the poles show a nebulous pattern on a stereogram (see fig. 3b in Sato et al. Reference Sato, Yamaji and Tonai2013), leading to difficulty in identifying the border on the stereogram (Yamaji et al. Reference Yamaji, Sato and Tonai2010; Sato et al. Reference Sato, Yamaji and Tonai2013). Solution of the problem has been attempted by numerical modelling methods, including stochastic modelling using the Bingham distribution (Yamaji et al. Reference Yamaji, Sato and Tonai2010) and the power-law distribution (Sato et al. Reference Sato, Yamaji and Tonai2013), as well as the non-parametric statistical approach without any stochastic model (Sato et al. Reference Sato, Yamaji and Tonai2013). However, the above methods are invalid for the fracture orientation data collected from multiple fracturing events (Yamaji & Sato, Reference Yamaji and Sato2011). For the last case of heterogeneous fracture orientation data, the fuzzy clustering technique, which extended the Bingham stochastic model (Yamaji et al. Reference Yamaji, Sato and Tonai2010) into a mixed Bingham distribution, was proposed by Yamaji & Sato (Reference Yamaji and Sato2011). This technique has been successfully applied to the Early Miocene dikes in Tsuruga Bay (Sato et al. Reference Sato, Yamaji and Tonai2013), the Miocene Kuromoritoge dikes in Ishizuchi (Yamaji & Sato Reference Yamaji and Sato2011), the gold veins in Hishikari Mine, southern Japan (Faye et al. Reference Faye, Yamaji, Yonezu, Tindell and Watanabe2018), and the quartz veins of Panasqueira Mine (Pascal et al. Reference Pascal, Jaques and Yamaji2022).
4.b. The fuzzy clustering technique
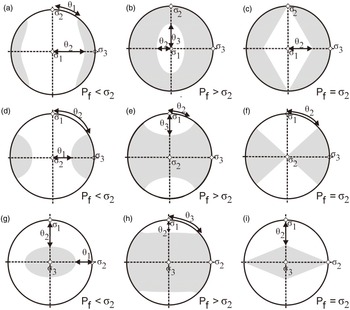
The fuzzy clustering technique of Yamaji & Sato (Reference Yamaji and Sato2011), developed into the Genetic Algorithm included in the software GArcmB proposed by Yamaji (Reference Yamaji2016), improves on the Jolly–Sanderson graphical method (Jolly & Sanderson, Reference Jolly and Sanderson1997) by enabling 3D palaeostress inversion based on dilatant fractures. The poles to the dilatant fractures formed under a given stress state on a stereographic projection show an orthorhombic distribution, which is either an elliptical cone around
 ${\sigma _3}{\rm{\;}}$
constrained by angles
 ${\theta _1}$
and
 ${\theta _2}{\rm{\;}}$
in the case of
 ${P_{\rm{f}}}$
<
 ${\rm{\;}}{\sigma _2}$
(Fig. 8a, d, g), or a girdle normal to
 ${\sigma _1}$
constrained by
 ${\theta _2}$
and
 ${\theta _3}$
when
 ${P_{\rm{f}}}$
>
 ${\rm{\;}}{\sigma _2}$
(Fig. 8b, e, h), except for the double cone constrained by
 ${\theta _2}$
with
 ${\theta _1}$
and
 ${\theta _3}$
being 0° and 90°, respectively, in the special case of
 ${P_{\rm{f}}}$
=
 ${\rm{\;}}{\sigma _2}{\rm{\;}}$
(Fig. 8c, f, i) (Jolly & Sanderson, Reference Jolly and Sanderson1997). Thus, the directions of the principal stress axes
 ${\sigma _1}$
,
 ${\sigma _2}$
and
 ${\sigma _3}$
, the stress ratio
 ${\rm{\Phi }}$
= (
 ${\sigma _2}$
−
 ${\sigma _3}$
)/(
 ${\rm{\;}}{\sigma _1}$
−
 ${\sigma _3}$
) and the driving pressure ratio R′ = (
 ${P_{\rm{f}}}$
−
 ${\sigma _3}$
)/(
 ${\rm{\;}}{\sigma _1}$
−
 ${\sigma _3}$
) can be mathematically calculated according to the angles
 ${\theta _1}$
and
 ${\theta _2}$
, or
 ${\theta _2}$
and
 ${\theta _3}$
(for details, see Jolly & Sanderson, Reference Jolly and Sanderson1997; Pascal, Reference Pascal2021).
Equal-area, lower-hemisphere stereogram showing the theoretical distribution of poles to dilatant fractures (grey areas). (a), b, c) for
 ${P_{\rm{f}}}$
<
 ${\sigma _2}$
,
 ${{\rm{P}}_{\rm{f}}}$
>
 ${\sigma _2}$
and
 ${P_{\rm{f}}}$
=
 ${\sigma _2}$
, respectively, for hypothetical cases with vertical σ
1 (modified from Martínez-Poza et al. Reference Martinez-Poza, Druguet, Castaño and Carreras2014); (d, e f) for
 ${P_{\rm{f}}}$
<
 ${\sigma _2}$
,
 ${P_{\rm{f}}}$
>
 ${\sigma _2}$
and
 ${P_{\rm{f}}}$
=
 ${\sigma _2}$
, respectively, for hypothetical cases with vertical σ
2 (method based on Jolly and Sanderson Reference Jolly and Sanderson1997); (g, h, i) for
 ${P_{\rm{f}}}$
<
 ${\sigma _2}$
,
 ${P_{\rm{f}}}$
>
 ${\sigma _2}$
and
 ${P_{\rm{f}}}$
=
 ${\sigma _2}$
, respectively, for hypothetical cases with vertical
 ${\sigma _3}$
(method based on Jolly and Sanderson, Reference Jolly and Sanderson1997).

Given the similarity between the distribution of the poles and the dilatant fractures with the same origin and the Bingham distribution (Bingham, Reference Bingham1974), the fuzzy clustering technique employed the Bingham statistics to invert the four parameters of stress tensors and the driving pressure ratio R′ based on the orientations of dilatant fractures (Yamaji & Sato, Reference Yamaji and Sato2011; Pascal et al. Reference Pascal, Jaques and Yamaji2022). The Bingham distribution has three symmetrical axes t
1, t
2 and t
3, which represent the minimum, intermediate and maximum concentration axes of the poles on a stereographic projection, respectively, and the pairs of scalars κ
1 and κ
2 (κ
1 ≤ κ
2 ≤ 0), which refer to the concentration of data points from t
3 to t
1 and from t
3 to t
2, respectively (see fig. 5.6b in Pascal, Reference Pascal2021). Through the logarithmic likelihood function, the best-fitting Bingham distribution is found; thus, the optimal t
1, t
2, t
3, κ
1 and κ
2 are produced (Yamaji et al. Reference Yamaji, Sato and Tonai2010). Then the three principal stress axes, i.e. t
1 = σ1, t
2 = σ2 and t
3 = σ3, and the stress ratio
 ${\rm{\Phi \;}}$
= κ
2/κ
1 are directly determined, whereas the driving pressure ratio R′ can be determined by the position of the pole of the vein with maximum normal stress imposed on the dilatant fracture in the Mohr space (Pascal, Reference Pascal2021).
In the case of heterogeneous fracture data, the fuzzy clustering technique aims to find a robust mixed Bingham distribution to fit the data by separating the heterogeneous orientation dataset into the optimal number of homogeneous subsets (K opt), using the Bayesian information criterion value (BIC value; Faye et al. Reference Faye, Yamaji, Yonezu, Tindell and Watanabe2018). The K opt can be obtained by the XY plot on which the abscissa values are K (number of subsets), and the subordinate values are BIC value (see fig. 7a in Faye et al. Reference Faye, Yamaji, Yonezu, Tindell and Watanabe2018). The BIC values for different possible K (generally K = 1, 2, 3, 4, 5) are obtained using GArcmB software (Yamaji, Reference Yamaji2016). Based on Yamaji’s (Reference Yamaji2016) principle, at least ten inversion routines for each given K are carried out to ensure the smallest statistical variability. Once the K opt, the K value corresponding to the minimum BIC on the XY plot (see fig. 7a in Faye et al. Reference Faye, Yamaji, Yonezu, Tindell and Watanabe2018), is defined, the symmetry axes t 1, t 2 and t 3, and the concentrations κ 1 and κ 2 of the K opt Bingham components are accurately determined. Thus, the K opt reduced stress tensors are obtained.
4.c. Phlogopite 40Ar–39Ar dating
Phlogopite grains of 500−200 μm diameter were separated, applying conventional magnetic and heavy-liquid techniques, from the fresh lamprophyre samples, which were crushed to a grain size of c. 30 to 70 mesh, and then were dried in a constant-heat (50 °C) oven at Langfang Technology Service Co., Ltd of Geoscience Exploration, Hebei Province, China. Subsequently, they were picked out by hand under a binocular microscope to achieve purity ≥99 % and then repeatedly washed using deionized water followed by acetone. After the final cleaning with acetone, the phlogopite separations were dried in a thermostat at 50 °C. After being weighed, they were loaded into aluminium packets, which were then put into a silicate glass tube (Can UM#84), interleaved with the packets that contained the flux monitor Mount Fish Canyon sanidine with the age of 28.1260 ± 0.0093 Ma (1σ) (Phillips et al. Reference Phillips, Matchan, Honda and Kuiper2017). The canister was then sent to the CLICIT facility of the Oregon State University (USA) TRIGA reactor, to be irradiated for 40 MWhr.
After irradiating them, we removed the mineral separates from their packaging and placed them in a custom-designed copper laser sample tray. 40Ar–39Ar step-heating analyses were performed on a Thermofisher ARGUSVI multi-collector mass spectrometer according to procedures previously described by Matchan and Phillips (Reference Matchan and Phillips2014). Samples were outgassed using the 6 mm homogenized beam of a Photonmachines Fusions 10.6 CO2 continuous wave laser operated at low power (1–2 %), and the bulk of atmospheric argon was removed. They were then step-heated over 4–10 % laser power. Blanks were monitored routinely and subtracted from sample measurements.
All the 40Ar–39Ar isotopic analytical data reported have been corrected for radioactive decay, full-system blanks, nucleogenic interferences, mass discrimination and atmospheric contamination. Throughout the calculations, the total decay constant for 40K of
 $5.543 \times {10^{ - 10}}{{\rm{a}}^{ - 1}}$
(Steiger & Jager, Reference Steiger and Jager1977) is applied, and the values for the Ca and K correction factors are (2.6580 ± 0.0024) × 10−4 for (36Ar/37Ar)Ca and 6.716 ± 0.018) × 10−4 for
 ${\left( {{}_{}^{36}{\rm{Ar}}/{}_{}^{37}{\rm{Ar}}} \right)_{{\rm{Ca}}}}{\rm{\;}}$
and
 $\left( {6.716 \pm 0.018} \right) \times {10^{ - 4}}$
for
 ${\left( {{}_{}^{39}{\rm{Ar}}/{}_{}^{37}{\rm{Ar}}} \right)_{{\rm{Ca}}}},{\rm{\;}}$
and
 $\left( {3.17 \pm 0.25} \right) \times {10^{ - 4}}\;$
for
 ${\left( {{}_{}^{40}{\rm{Ar}}/{}_{}^{39}{\rm{Ar}}} \right)_{\rm{k}}}$
and
 $\left( {1.2819 \pm 0.0002} \right) \times {10^{ - 2}}$
for
 ${\left( {{}_{}^{38}{\rm{Ar}}/{}_{}^{39}{\rm{Ar}}} \right)_{\rm{k}}}$
, respectively. The irradiation factor for the phlogopite aliquot was J
 $\; = 0.00911937 \pm 0.00000192$
, obtained according to the age of 28.1260 ± 0.0093 Ma (1σ) for FC sanidine (Phillips et al. Reference Phillips, Matchan, Honda and Kuiper2017). For the isochron interpretation and discrimination calculation, the value of 298.56 ± 0.31 for the present-day atmospheric argon (Lee et al. Reference Lee, Marti, Severinghaus, Kawamura, Yoo, Lee and Kim2006) was employed. All errors are reported as 1σ.
5. Palaeostress analysis and age of the lamprophyre dikes and quartz veins
5.a. The stresses for lamprophyre dikes
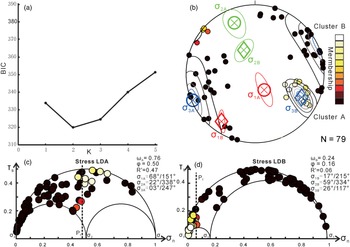
The poles to the lamprophyre dikes, as projected in a contoured stereogram (1 % contour per 1 % area) (Fig. 9a), show an overall clustered distribution with two distinct maximum concentration orientations. These concentrations correspond to two sets of symmetry axes (Fig. 9a) that imply the existence of two main sets for the lamprophyre dikes in the Sizhuang gold deposit, i.e. those trending NNW–SSE and NNE–SSW. We applied the fuzzy clustering technique not only for K = 2, i.e. two clusters, but for testing K values from 1 to 5 with the aid of software GArcmB (Yamaji, Reference Yamaji2016). As a result, we can test which K value provides the minimum BIC value, i.e. the optimum value. Among the obtained BIC values in the XY plot, the minimum value is when K = 2 (Fig. 10a), thus indicating that two homogeneous clusters, A and B, better describe the recorded data. Accordingly, these clusters define two stress states, LDA and LDB, with the
 $\omega $
values equal to 0.76 and 0.24, respectively, explaining the emplacement of 76 % and 24 % of the lamprophyre dikes under stresses LDA and LDB, respectively.
(a) Contoured lower-hemisphere equal-area projection of poles to 79 dike segments from the Sizhuang gold deposit, showing two distinct clusters indicated by the solid black circles and the solid black triangles, respectively. (b) Contoured lower-hemisphere equal-area projection of poles to 320 quartz veins from the Sizhuang gold deposit, showing the overall distribution of a girdle type except that there is a significant cluster of poles indicated by the solid black circles in the northeast.

Palaeostress analysis based on the lamprophyre dike orientation data with the fuzzy clustering technique. (a) The lamprophyre dike orientation data show the minimum BIC at K = 2, meaning that the dike orientations should be partitioned into two clusters. The stresses corresponding to the clusters are called stresses LDA and LDB. (b) Equal-area projection of the poles to the lamprophyre dikes. The colour of a datum point indicates the membership of the orientation. The stress axes are indicated by the circles with crosses for stress LDA and the diamonds with crosses for stress LDB, which centre their 95 % error ellipses. The optimal stresses have a stress ratio of 0.50 for stress LDA and 0.16 for stress LDB. (c, d) Mohr circles of the stresses and the normalized normal and shear stresses on the vein walls exerted by the stresses. The colour of each datum point indicates the membership of the datum. The dark line defines P f.

However, whether a dike was deposited under stress LDA or LDB depends on its memberships, which are denoted by the probability of belonging to clusters A and B. The memberships are indicated by gradation between black and white circles on the equal-area projection (Fig. 10b), each of which has a value between 0 and 1. Dikes deposited under stress LDA are shown with solid black circles in Figure 10b, the membership of which to cluster A is 1; whereas the dikes formed under stress LDB are shown with solid coloured to open white circles in Fig. 10b, the membership of which to cluster A is <1. Stress LDA was an extensional stress regime with the attitudes of
 ${\sigma _1}$
,
 ${\sigma _2}$
and
 ${\sigma _3}$
axes at 151–168°, 338–322° and 247–203°, respectively, and
 ${\rm{\Phi }}$
= 0.50 (Fig. 10b). Stress LDB was a strike-slip regime with the attitudes of
 ${\sigma _1}$
,
 ${\sigma _2}$
and
 ${\sigma _3}$
axes at 215–217°, 334–359° and 117–126°, respectively, and
 ${\rm{\Phi }}$
= 0.16 (Fig. 10b). The two groups showed the driving pressure R′’ values at 0.47 and 0.06, respectively (Fig. 10c, d).
5.b. The stresses for quartz veins
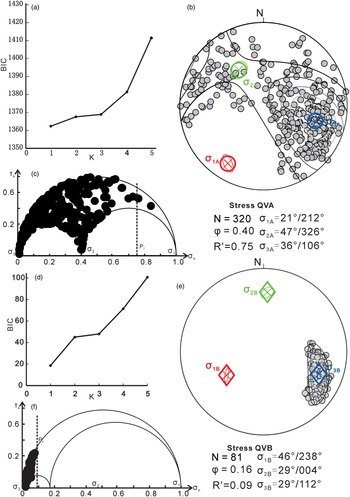
For the 320 quartz vein orientation data, the BIC is minimum at K = 1 (Fig. 11a). Therefore, a single stress regime, called QVA (Fig. 11b), can explain all the orientations. QVA defines an inclined stress state with the attitudes of σ1, σ2 and σ3 axes at 212–21°, 326––47° and 106–36°, respectively, and
 ${\rm{\Phi }}$
= 0.40 (Fig. 11b, c). The driving pressure R′ value is high at 0.75. The stress QVA is consistent with the fact that the poles to the quartz veins, lying inside the 0.5 % contour per 1 % area in the contoured diagram, show the overall distribution of a girdle type with
 ${P_{\rm{f}}}$
>
 ${\sigma _2}$
(Fig. 9b).
Palaeostress analysis based on the quartz vein orientation data with the fuzzy clustering technique. (a) The quartz vein orientation data show the minimum BIC at K = 1, meaning that a single stress state QVA-FC explains all the vein orientations. (b) Equal-area projection of the poles to the quartz veins. The stress axes are indicated by the circles with crosses, which centre their 95 % error ellipses. The optimal stress has a stress ratio of 0.40. (c) Mohr circles of the stress and non-dimensional normal and shear stresses on the vein walls. The dark line defines P f. (d) For the clustered distribution in Figure 9b, the BIC is minimum at K = 1. (e) Equal-area projection of the poles to the quartz veins belonging to the clustered distribution. The stress axes are indicated by the diamonds with crosses, which centre their 95 % error ellipses. The optimal stress has a stress ratio of 0.20. (f) Mohr circles of the stress and non-dimensional normal and shear stresses on the vein walls. The dark line defines P f.

However, it should be noted that there is a significant cluster of poles in the northeast (Fig. 9b), suggesting that a great number of quartz veins strike NNE–SSW with dips towards NW (mean orientation of 287–55°; Fig. 7d). These veins are the largest, with no slickenlines, forming bands (Fig. 5d–f) (sub)parallel to the NNE–SSW lamprophyre dikes, indicating that the dilation of NNE–SSW fractures was not only at high P
f but also at low P
f. More interestingly, the distribution of the poles lying within the 3 % contour includes 81 orientation data (solid black circles), accounting for 25 % of the quartz veins, and has different symmetry axes from those of the overall girdle-type distribution (Fig. 9b), indicating changes in the state of stress during the vein emplacement (Tran & Ravoof, Reference Tran and Ravoof2007; Mondal & Mamtani, Reference Mondal and Mamtani2013). The clustered distribution indicates low
 ${P_{\rm{f}}}$
(
 ${P_{\rm{f}}}$
<
 ${\sigma _2}$
).
For the clustered distribution, the BIC is minimum at K = 1 (Fig. 11d). The obtained stress regime, called QVB (Fig. 11e), has the attitudes of
 ${\sigma _1}$
,
 ${\sigma _2}$
and
 ${\sigma _3}$
axes at 238–46°, 004–29°, and 112–29°, respectively, and
 ${\rm{\Phi }}$
= 0.16 (Fig. 11e, f). The driving pressure R′ value is low at 0.09, suggesting that whenever
 ${P_{\rm{f}}}$
is of magnitude almost equal to
 ${\sigma _3}$
stress, the formed veins are perpendicular to the
 ${\sigma _3}$
axis, which is consistent with the fact that only a very limited number of vein poles lie to the left of the
 ${P_{\rm{f}}}$
line (Fig.11f).
5.c. Comparison of stresses (for lamprophyre dikes and quartz veins)
Two stress states have been defined by the lamprophyre dikes, and two stress states by the quartz veins, using the fuzzy clustering technique of Yamaji & Sato (Reference Yamaji and Sato2011). These four stress states indicate similarities and differences, and because of this, herein, we attempt to clarify better and unify these results. In total, three different stress regimes are defined (Table 1):
-
(1) Stress regime A (i.e. LDA). Only the lamprophyre dikes define it. It has a sub-vertical
 ${\sigma _1}$
axis, and sub-horizontal ENE–WSW-trending
${\sigma _3}$
axis (Fig. 10b, c), indicating an extensional stress regime with obtained stress ratio values defining Radial-Pure extension to Pure Extension stress regimes (stress types based on Tranos et al. Reference Tranos, Kachev and Mountrakis2008), under which
${P_{\rm{f}}}$
was lower unless almost equal to
${\sigma _2}$
.
-
(2) Stress regime B (i.e. LDB and QVB). This is the main stress state defined by the clustered distribution of the lamprophyre dikes and quartz veins (Figs 10b, d, 11e, f). This stress regime is characterized by the more stable position of the
${\sigma _3}$
axis, which plunges towards the ESE at low angles, i.e. between the trends of the least principal stress axes of the ST1 and ST2 stress regimes (see Section 5.d for details). Although
${\sigma _1}$
and
${\sigma _2}$
axes vary in position along the principal stress
${\sigma _1}$
–
${\sigma _2}{\rm{\;plane}}$
(see LDB in Fig. 10b and QVB in Fig. 11e), the defined stress ratio Φ and driving pressure R′ are similar. Because of this, it is better described as an inclined (or oblique) strike-slip stress regime fitting with a transtension stress regime, under which,
${P_{\rm{f}}}$
magnitude was very low, much smaller in magnitude than
${\sigma _2}$
. -
(3) Stress regime C (i.e. QVA). Only the quartz veins define it. Although the calculated
${\sigma _3}$
axis, plunging towards the ESE at low angles, is the same as that in stress regime B, stress regime C has higher
${\rm{\Phi }}$
and R′, and
${P_{\rm{f}}}$
was also high, i.e. higher than
${\sigma _2}$
. Furthermore, the
${\sigma _1}$
and
${\sigma _2}$
axes are both inclined, defining an inclined (or oblique) stress regime fitting with a transtension stress regime.


Palaeostress analysis results from the lamprophyre dike and quartz vein orientation data in the Sizhuang gold deposit, Jiaodong Peninsula

5.d. Fault-slip data inversion and stress inversion
In order to accomplish a complete analysis concerning the palaeostresses in the Sizhuang gold deposit, we tried to define them from the fault-slip data in addition to using the dikes and veins. For this purpose, we applied a stress inversion to the available fault-slip data from stations in Jiaolai Basin located closest to the mine area (Fig. 1b), as these fault-slip data have recently been published by B Zhang et al. (Reference Zhang, Weinberg, Yang, Groves, Sai, Matchan, Phillips, Kohn, Miggins, Liu and Deng2020). Those authors, based on their palaeostress analysis and reconstruction, conclude that the Jiaolai Basin has been subjected to six stress regimes since the Cretaceous. Among them, four extensional regimes are defined: (a) an E–W extension during 135−121 Ma, controlling the formation of the Laiyang Group, (b) a NW–SE extension between 120 and 93 Ma, controlling the formation of the Qiangshan Group, (c) a N–S extension from 85 to 60 Ma, controlling the formation of the Wangshi Group, and (d) a NE–SW extension later than 55 Ma. In the catalogue of B Zhang et al. (Reference Zhang, Weinberg, Yang, Groves, Sai, Matchan, Phillips, Kohn, Miggins, Liu and Deng2020), the fault-slip data stations located closest to the Sizhuang gold deposit are K1Ly-05, K1ly-06, K1Ly-07, K1ly-10, K1Ly-25 and K1ly-27 within the Laiyang Group (Fig. 1b). They include 97 fault-slip data, which are heterogeneous since the area experienced multiple deformation events (B Zhang et al. Reference Zhang, Weinberg, Yang, Groves, Sai, Matchan, Phillips, Kohn, Miggins, Liu and Deng2020). Because the fault-slip data are heterogeneous, we applied the TR method (TRM) (Tranos, Reference Tranos2015), which was deployed to separate heterogeneous fault slip data into homogeneous groups and define either in situ or bulk Andersonian stress tensors for each of these groups.
The TRM is a simple graphical and semi-automatic method plotting the heterogeneous fault-slip data on TR diagrams and defining the slips on the faults, which are simultaneously compatible with a specific orientation of the Andersonian stress axes and a specific stress ratio
 $R$
(
 $R = \left( {{\sigma _2} - {\sigma _3}} \right)/\left( {{\sigma _1} - {\sigma _3}} \right)$
with
 $0{\rm{\;}} \le R{\rm{\;}} \le 1$
) (for details, see Tranos, Reference Tranos2015). Stress ratio (
 $R$
) equals
 ${\rm{\Phi }}$
. These faults are called Tensor Ratio Compatible Faults (TRCF), and the optimal TRM stress tensor is the one that explains the largest number of the TRCF with MA ≤ 20° and secondly provides the smallest Mean Misfit Angle (MMA).
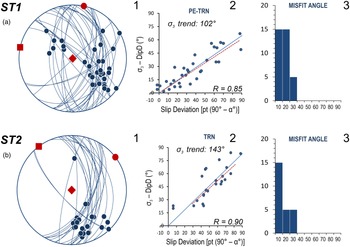
Applying the TRM on the 97 fault-slip data, two extensional bulk stress tensors, ST1 (Fig. 12a) and ST2 (Fig. 12b), are defined. The former has attitudes for σ1: 102−90°, σ2: 012−00°, σ3: 102−00° and
 $R$
= 0.85 from 35 TRCF with ≤30°, 30 with MA ≤ 20° and MMA = 12.9°; and the second has attitudes for σ1: 143−90°, σ2: 053−00°, σ3: 143−00° and
 $R$
= 0.9 from 25 TRCF with ≤30°, 20 with MA ≤ 20° and MMA = 11.8°. Although their stress ratios are very similar, based on the percentages of the Stress Tensor Discriminator Faults (STDF), i.e. the faults activated by either A or B stress tensor, but not from both (Tranos, Reference Tranos2015, Reference Tranos2017), they are different stress tensors since these percentages are more than 70 % (Tranos, Reference Tranos2015, Reference Tranos2017). In particular, three STDF percentages were calculated: 92.9 % for the unified ST1 and ST2, 88.6 % for the ST1, and 84.0 % for the ST2 fault-slip datasets, respectively.
Results of the TRM application (Tranos, Reference Tranos2015) on the recently published fault-slip data by B Zhang et al. (Reference Zhang, Weinberg, Yang, Groves, Sai, Matchan, Phillips, Kohn, Miggins, Liu and Deng2020). The optimal resolved stress tensors (a) ST1 and (b) ST2. Explanation: 1. Equal-area, lower-hemisphere projection of the TR-compatible fault slip data.
 ${\sigma _1}$
,
 ${\sigma _2}$
and
 ${\sigma _3}$
axes are shown with solid red rhomb, circle and square, respectively; 2. TR diagram showing the TR-compatible faults (blue balls), the ‘real’ (blue line) and ‘theoretical’ (red dashed line) Final Tensor Ratio Lines (for details, see Tranos, Reference Tranos2015); R is the stress ratio; 3. Misfit angle distribution of the TR-compatible faults.

ST1 and ST2 stress tensors define an ∼E–W pure extension – transtension (PE-TRN) and a NW–SE transtension (TRN) stress regime, respectively (stress type classification according to Tranos et al. Reference Tranos, Kachev and Mountrakis2008).
5.e. Phlogopite 40Ar–39Ar ages
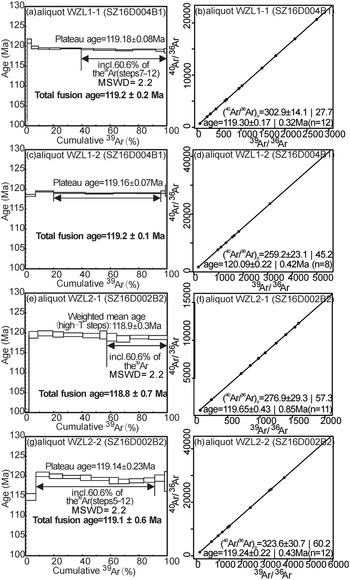
Two phlogopite aliquots from each sample of the lamprophyre dikes were carried out to examine the reproducibility of the 40Ar–39Ar ages. Table 2 shows all the isotopic analytical data for each increment. All samples’ apparent age spectra and ages, including the plateau ages, total fusion ages and isochron ages, are presented in Figure 13a, b, c, d, f, g, h. If no plateau ages are defined, pseudo-plateau ages are shown (Fig. 13e). All the age errors, derived from the uncertainties in the J value and the irradiation correction factor without including the potassium decay constant, are given with a 95 % confidence level (2
 $\sigma )$
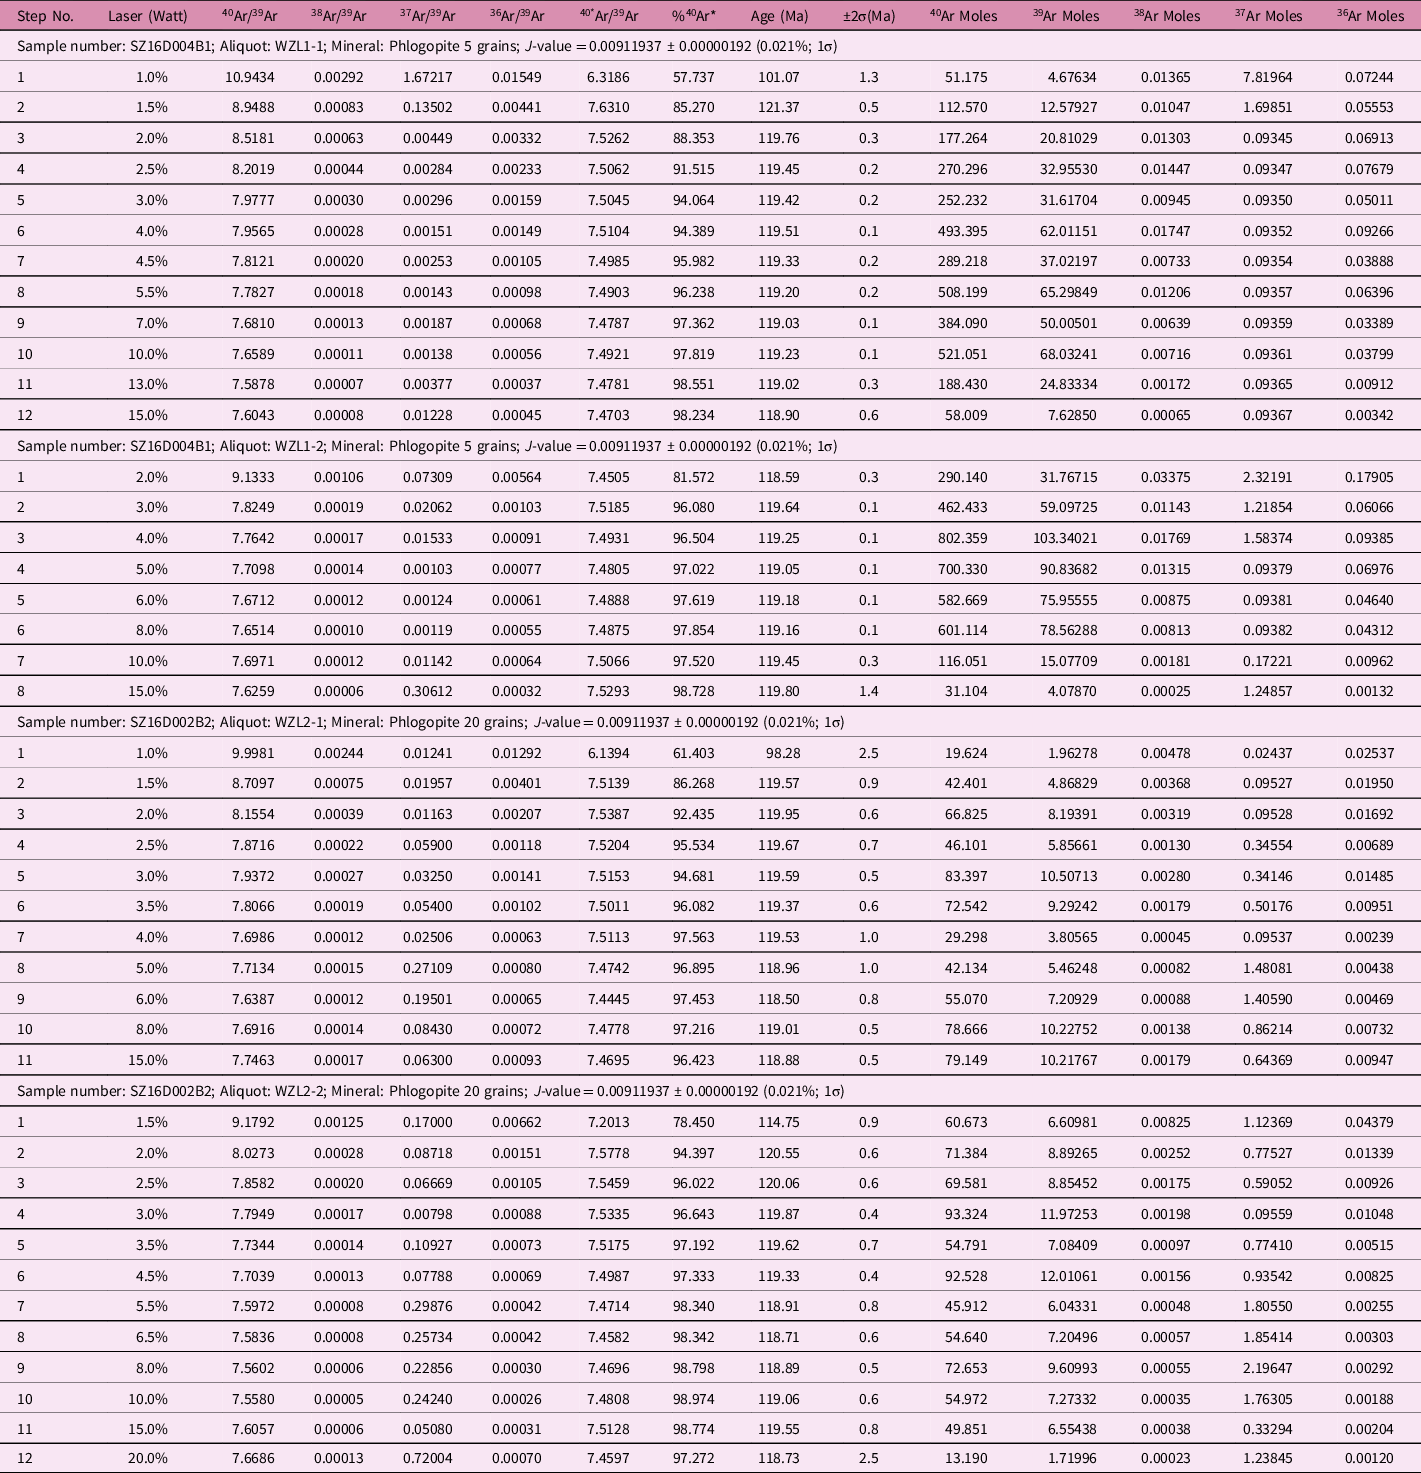
. Plateau ages are the weighted mean of a sequence of consecutive, concordant step ages, indistinguishable at the 95 % confidence level and encompassing over 50 % of the total 39Ar gas released (Dallmeyer & Lecorche, Reference Dallmeyer and Lecorche1990).
Phlogopite 40Ar–39Ar step-heating isotopic analytical results for the lamprophyre dike from the Sizhuang gold deposit, Jiaodong Peninsula

Phlogopite 40Ar–39Ar plateau (a, c, e, g) and isochron ages (b, d, f, h) for the lamprophyre dike from the Sizhuang gold deposit. (a, b) Aliquot WZL1-1 from sample SZ16D004B1; (c, d) aliquot WZL1-2 from sample SZ16D004B1; (e, f) Aliquot WZL2-1 from sample SZ16D002B2; (g, h) aliquot WZL2-2 from the sample.

In contrast, pseudo-plateau ages are the weighted mean of contiguous step ages consistent within 2σ, which account for at least 30 % of the total 39Ar gas released (Bi & Zhao, Reference Bi and Zhao2017). Total fusion ages and isochron ages are obtained by adding all step ages to derive a single total gas age and from the slope of the line best fitted to plateau-forming step compositions using a least-squares regression (York, Reference York1969), respectively. All the isochron plots (Fig. 13b, d, f, h) commonly show the initial 40Ar/36Ar ratios identical or close within error to the value of 298.56 ± 0.31 for the present-day atmospheric argon (Lee et al. Reference Lee, Marti, Severinghaus, Kawamura, Yoo, Lee and Kim2006), meaning that the non-atmospheric initial argon (excess argon) has no significant effect on our samples.
Three of four phlogopite aliquots, comprising WZL1-1 and WZL1-2 from sample SZ16D004B1, and WZL2-2 from sample SZ16D002B2, show the ideal flat spectra encompassing 60.6 %, 76 %, and 61.3 % of the released total 39Ar, yielding the well-defined high precision plateau ages of 119.18 ± 0.08 Ma, 119.16 ± 0.07 Ma, and 119.14 ± 0.23 Ma, respectively (Fig. 13a, c, e). These well-defined plateau ages of individual phlogopite aliquots are reproducible with respective total fusion ages (Fig. 13a, c, e). In addition, the three phlogopite aliquots produce the isochron ages consistent with their respective plateau ages (Fig. 13b, d, h). Therefore, the well-defined high-precision plateau ages, as well as the reproducibility of the plateau, total fusion and isochron ages, imply that the effect of minor argon loss, indicated by the relatively younger ages in the initial steps (Fig. 13a, c, e), is not significant.
The other phlogopite aliquot, WZL2-1 from sample SZ16D002B2, has somewhat perturbed age spectra (Fig. 13e). However, a pseudo-plateau age of 118.9 ± 0.3 Ma is given by 8 to 11 steps with c. 42.7 % of the released total 39Ar. It is also reproducible with both the total fusion age at 118.8 ± 0.7 Ma (Fig. 13e) and the isochron age of 119.65 ± 0.43 Ma (Fig. 13f). Furthermore, the pseudo-plateau age is indistinguishable from the plateau age of aliquot WZL2-2 from the same sample SZ16D002B2 (Fig. 13e, g) and thus is considered to be geologically meaningful.
Different samples collected from the fresh and non-deformed NNE–SSW-trending lamprophyre dikes, which are moderately and steeply dipping, respectively, have plateau ages that are reproducible within uncertainties, meaning that these lamprophyre dikes formed in a single, short-lived magmatic event.
6. Discussion
The lamprophyre dikes and quartz veins in the Sizhuang gold deposit have various geometric properties regarding their orientations and sizes, revealing a complex deformational history. The lamprophyre dikes and quartz veins are dilational with mineral crystals normal to their generally rough wall surfaces in their majority. As we already mentioned, dikes are strongly affected by the mechanical properties of their host rocks and, more precisely, the host-rock lithology, stress field and pre-existing fractures (Pollard et al. Reference Pollard, Muller and Dockstader1975; Baer, Reference Baer1991). Previous studies have revealed that c. 90 % of the lamprophyre dikes trend from azimuths 0° to 040° (Li et al. Reference Li, Li, Santosh, Li, Gu, Lü, Zhang, Shen and Zhao2016), i.e. parallel to the Jiaojia Fault and the dominant Mesozoic tectonic fabric in the Jiaodong Peninsula, and only a small proportion of them trend NNW–SSE (Li et al. Reference Li, Li, Santosh, Li, Gu, Lü, Zhang, Shen and Zhao2016).
In contrast, the lamprophyre dikes in the Sizhuang gold mine are grouped into two major sets and a subsidiary one. The two main sets trend NNW–SSE and NNE–SSW, respectively, whereas a subsidiary set trends WNW–ESE. Although with various dips, the quartz veins mainly trend similarly to the NNE–SSW-trending lamprophyre dikes, suggesting their formations were penecontemporaneous. However, the quartz veins cut across the NNW–SSE-trending lamprophyre dikes sharply, indicating that the latter were formed relatively earlier than the quartz veins and the NNE–SSW-trending lamprophyre dikes. Therefore, the well-defined and high-precision plateau ages of 119.18 ± 0.08 Ma, 119.16 ± 0.07 Ma and 119.14 ± 0.23 Ma, obtained herein by the phlogopite 40Ar–39Ar dating on the NNE–SSW-trending lamprophyre dikes, indicate that the quartz veins and the NNE–SSW-trending lamprophyre dikes were formed at c. 119 Ma.
Furthermore, L Zhang et al. (Reference Zhang, Weinberg, Yang, Groves, Sai, Matchan, Phillips, Kohn, Miggins, Liu and Deng2020) performed the 40Ar–39Ar dating of muscovite from the quartz–sericite–pyrite altered granite in the Sizhuang deposit, which was cut by the lamprophyre dikes and the quartz veins. It has been well accepted that sericite and muscovite are both susceptible to isotopic resetting during thermal events and deformation (Chesley et al. Reference Chesley, Rudnick and Lee1999), as was verified by the widely divergent isotopic ages between 133 and 108 Ma by the 40Ar–39Ar dating of the sericite or muscovite in the gold deposits in the Jiaodong Peninsula (Li et al. Reference Li, Vasconcelos, Zhou, Zhao and Ma2006; Zhang et al. Reference Zhang, Dong and Shi2003; LQ Yang et al. Reference Yang, Deng, Goldfarb, Zhang, Gao and Wang2014; L Zhang et al. Reference Zhang, Weinberg, Yang, Groves, Sai, Matchan, Phillips, Kohn, Miggins, Liu and Deng2020). Therefore, it is unclear if the sericite or muscovite may have suffered later modifications. Accordingly, given the cutting relations between the lamprophyre dikes and quartz–sericite–pyrite altered granite in the Sizhuang deposit, the age of 120.5 ± 0.9 Ma by the 40Ar–39Ar dating of muscovite from the quartz–sericite–pyrite altered granite (L Zhang et al. Reference Zhang, Weinberg, Yang, Groves, Sai, Matchan, Phillips, Kohn, Miggins, Liu and Deng2020) probably reflects the emplacement age of the NNW–SSE-trending lamprophyre dikes; whereas the 120.1 ± 0.9 Ma (L Zhang et al. Reference Zhang, Weinberg, Yang, Groves, Sai, Matchan, Phillips, Kohn, Miggins, Liu and Deng2020) overlaps with, within analytical uncertainties (±2σ), the emplacement age of the NNE–SSW-trending lamprophyre dikes in the Sizhuang deposit.
The analysis and stress inversion of the available fault-slip data recorded close to the area of the Sizhuang gold deposit with the TRM defines two stress regimes, ST1 and ST2, which fit, respectively, in orientation with stress A (E–W extension during 135−121 Ma) and stress B (NW–SE extension between 120 and 93 Ma), as the latter were defined by B Zhang et al. (Reference Zhang, Weinberg, Yang, Groves, Sai, Matchan, Phillips, Kohn, Miggins, Liu and Deng2020). Based on the dating provided by those authors, ST1 is relatively older than ST2, indicating that the least principal stress axis rotated from E–W to NW–SE and the PE-TRN changed progressively to the TRN, under which the strike-slip tectonics is more prevalent. In addition, under the ST1, the trend of the activated fault is NNW–SSE, whereas under the ST2 the activated faults are those with the trends parallel to the Jiaojia Fault, i.e. NNE–SSW.
Considering the above ages for the ST1 and ST2 and the age of the lamprophyre dikes, we can conclude that the formation of the dikes and veins in the Sizhuang gold deposit occurred while a change from the stress regime ST1 to ST2 was in progress. Moreover, the geometric properties of the lamprophyre dikes and quartz veins provide details about the change from ST1 to ST2 and verify the transtension tectonics during this change.
The fuzzy clustering technique of Yamaji & Sato (Reference Yamaji and Sato2011) suggests two stress states for describing the formation of the lamprophyre dikes and two stress states for describing the formation of the quartz veins. These stress states have been grouped into three regimes A, B and C (Table 1).
As mentioned above, the strike distribution of the lamprophyre dikes peaks at NNW-trending and, to a lesser degree, along the NNE trend, suggesting abrupt changes in the trend of
 ${\sigma _3}$
(c. 50° flip). Furthermore, all the dikes have narrow thicknesses, with none wider than 1 m, and no multiple dyke injections were observed. Therefore, it is logical to state that the resulting stress regimes A and B imply unstable stress conditions for the formation of the lamprophyre dikes (Table 1). In contrast, the distribution of the poles to the quartz veins shows the dominance of NNE trending (Figs 7d and 9b), and the banded veins with sub-parallel bands of large thicknesses (up to 5 m) were commonly observed, reflecting rather stable stress conditions. Although the stress regimes B and C for the quartz veins indicate changes in the local stresses with time, the direction of extension (
 ${\sigma _3}$
) is always constant during quartz vein emplacement (Table 1).
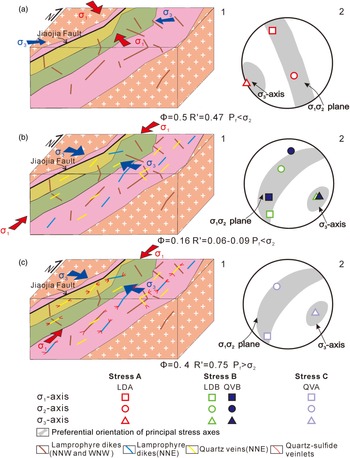
Extension and strike-slip tectonics, i.e. transtension and associated pre-existing structures, affect the emplacement of the lamprophyre dikes and quartz veins. In particular, the NNW–SSE-trending and the subsidiary WNW–ESE-trending lamprophyre dikes intruded into the pre-existing fractures interpreted herein as subsidiary R and R′ Riedel shears related to a left-lateral strike-slip deformation along the main faults like the TLF during Late Jurassic times under a NW–SE or N–S compression (or transpression) (Zhu et al. Reference Zhu, Niu, Xie and Wang2010). Under this strike-slip deformation, the Jiaojia Fault, which dips with intermediate dip angles, can be seen as a flower structure, off-strike and to the east of the TLF. In particular, stress regime A, i.e. LDA, is interpreted to represent the stress conditions in the initial stages when the NNW–SSE-trending lamprophyre dikes intruded into a large number of inherited structures (Fig. 14a). Dikes’ intrusion, at least at the initial stages, was characterized by
 ${P_{\rm{f}}}$
relatively high in magnitude values, almost equal to
 ${\sigma _2}$
(Fig. 10b, c). The formation of the main bodies of the NNE–SSW-trending lamprophyre dikes and quartz veins has been dominated by WNW–ESE extension, i.e. stress regime B (i.e. LDB and QVB) (Fig. 14b). Under this stress regime,
 ${P_{\rm{f}}}$
was very low and smaller in magnitude than
 ${\sigma _2}$
, giving rise to the emplacement of the dikes and veins into the structures oriented mainly normal to the
 ${\sigma _3}$
axis since the fractures’ permeability was poor, with only the structures that trend as the Jiaojia Fault facilitating it. Because of this, the quartz veins cross-cut the NNW–SSE-trending dikes driven by the stress regime A. However, the girdle-type distribution of the quartz vein poles implies that their formation should include the stage dominated by the increase in fluid pressure, i.e. stress regime C (QVA). Under such conditions, the smaller pre-existing structures with a wide range of orientations can dilate, giving rise to the local geometric complexities mainly in the tips of the NNE–SSW-trending dikes and veins (Fig. 14c).
Schematic cartoons (not to scale) showing the stress regime corresponding to lamprophyre dikes and quartz veins in the Sizhuang gold deposit. (a) E–W extension led to the development of the NNW–SSE-trending and subsidiary WNW–ESE-trending lamprophyre dikes. (b) WNW–ESE extension led to the development of the NNE–SSW-trending lamprophyre dikes and quartz veins at low P f. (c) WNW–ESE extension led to the formation of quartz veins with a wide range of orientations in the tips of the NNE–SSW-trending dikes and the NNE–SSW quartz veins at high P f.

Thus, the cross-cutting network of quartz veins and fractures and the dominance of NNE–SSW-oriented quartz veins in the Sizhuang gold deposit are attributed to
 ${P_{\rm{f}}}$
fluctuations between
 ${P_{\rm{f}}}$
>
 ${\sigma _2}$
and
 ${P_{\rm{f}}}$
<
 ${\sigma _2}$
leading to the local stress perturbations from the regional far stress field, which remains transtension with the
 ${\sigma _3}$
axis changing from E–W through WNW–ESE to NW–SE trend, as shown by the fault-slip analysis and their stress inversion with the TRM.
Conclusively, the lamprophyre dikes and quartz veins show ae change in extension from an E–W through WNW–ESE to NW–SE trend (Fig. 14). This change reflects a significant clockwise rotation in the palaeo-Pacific plate subduction direction, and the switching time was precisely dated by the lamprophyre dating at c. 119 Ma.
7. Conclusions
The lamprophyre dikes and quartz veins in the Sizhuang gold deposit situated in the Jiaodong Peninsula in China have been studied in detail to define the accurate age and the stress regimes of their emplacement. For this purpose, the phlogopite 40Ar–39Ar dating method and the fuzzy clustering technique of Yamaji & Sato (Reference Yamaji and Sato2011) are used. The dikes in their majority were dilational, trending mainly NNW–SSE and NNE–SSW with subsidiary WNW–ESE. The age of the NNE–SSW dike emplacement, which followed the inherited structures from a possible Late Jurassic strike-slip tectonics along the TLF, was at c. 119 Ma. The palaeostress reconstruction of the available fault-slip data provided by B Zhang et al. (Reference Zhang, Weinberg, Yang, Groves, Sai, Matchan, Phillips, Kohn, Miggins, Liu and Deng2020) in the broader region of the Sizhuang gold deposit with the stress inversion TRM (Tranos, Reference Tranos2015) defines an E–W pure extension – transtension (ST1), and a NW–SE transtension (ST2). These stress regimes verify the stress A (E–W extension during 135−121 Ma) and stress B (NW–SE extension between 120 and 93 Ma) defined by B Zhang et al. (Reference Zhang, Weinberg, Yang, Groves, Sai, Matchan, Phillips, Kohn, Miggins, Liu and Deng2020). More importantly, based on their type, i.e. pure extension – transtension (ST1) and transtension (ST2), we suggest a progressive shift in the direction of the least principal stress axis (
 ${\sigma _3}$
) from E–W to NW–SE and the increased strike-slip against dip-slip kinematics along the faults.
The palaeostress analysis of the dikes indicates that the shift from the E–W to NW–SE extension gave rise to the unstable stress conditions related to the intrusion of the dikes in the Sizhuang gold deposit, which is characterized by generally low
 ${P_{\rm{f}}}$
values. On the other hand, the quartz veins formed under relatively stable stress conditions, showing that their formation occurred while the shift in direction of the
 ${\sigma _3}$
axis ended.
In contrast, the emplacement of the larger to smaller quartz veins is characterized by the significant
 ${P_{\rm{f}}}$
fluctuations and the progressive increase of the
 ${P_{\rm{f}}}$
. As a result, we can argue that the normal stress along the faults decreases, facilitating the strike-slip more than the dip-slip kinematics along them. The change from the ST1 to the ST2 stress regime reflects the significant clockwise rotation in the palaeo-Pacific plate subduction direction and defines the switching time at c. 119 Ma as precisely obtained by the lamprophyre dating.
Acknowledgements
We want to thank C. Pascal and an anonymous reviewer for their useful revisions and the editor O. Lacombe for his constructive comments, which greatly improved the manuscript. We thank Professor Yusheng Zhai from the China University of Geosciences (Beijing) for his help in substantially improving the manuscript. This study was financially supported by the National Natural Science Foundation of China (Grant No. 41772061).
Conflict of interest
All the authors listed declare that the material is not of any third-party copyrighted, and there are no personal relationships or competing financial interests that could have appeared to influence the work reported in this paper.