


INTRODUCTION
Nearly all organisms are parasitized, but there are substantial differences in the rate of parasite exposure between individuals and also populations. Parasites reduce their host's fitness by decreasing survival and/or reproductive success (e.g. Köning and Schmid-Hempel, Reference Koskimäki, Rantala and Suhonen1995; Sheldon and Verhulst, Reference Sheldon and Verhulst1996). Immune function has evolved to counter these negative impacts. Individuals with an insurmountable immune response do not exist due to trade-offs between a costly immune system, and other life-history traits e.g. the number of offspring, as resources for these traits are limited (Zuk and Stoehr, Reference Zuk and Stoehr2002). The costs of immune function result from evolving immunity (antagonistic pleiotropy) and from physiological costs of maintaining and utilizing the immune system against pathogens. Even if the highly effective immune function would appear to be the norm, the interpopulation variation in the immune response is unexpectedly high (e.g. De Block et al. Reference De Block, Mc Peek and Stoks2008a).
Insects are excellent models for studying immune function in an evolutionary context. Their wide dispersal and survival depend to a large extent on effective immune function against miscellaneous microorganisms and parasites (Frank, Reference Frank2000; Suhonen et al. Reference Suhonen, Honkavaara and Rantala2010). Thus, it is clear that invertebrates must have very efficient means of recognizing and defending against potentially harmful microorganisms (Söderhäll and Cerenius, Reference Söderhäll and Cerenius1998). The immune system of insects is based mainly on innate immunity that relies on the interactions between haemocytes, i.e. the cellular component of arthropod blood and the ability of soluble compounds in the humoral system to recognize, and respond to non-self. The main immune response of invertebrates is encapsulation, i.e. the capacity to form a capsule of haemocytes, around a multicellular pathogen. Encapsulated pathogens are thought to be killed by a combination of isolation from nutrients and the active release of cytotoxic molecules into the capsule by host cells (reviewed by Lawniczak and Barnes, Reference Lawniczak and Barnes2007).
Our study taxon, odonates, is one of the most parasitized of all insects, harbouring both ecto- and endoparasites (Åbro, Reference Åbro1974, Reference Åbro1986). Although individuals are likely to be simultaneously infected by various parasite species, and the response to different parasites may vary, most former studies have concentrated on the effects of a single parasite taxon (e.g. Reinhardt, Reference Reinhardt1996; Andres and Cordero, Reference Andres and Cordero1998; Siva-Jothy, Reference Siva-Jothy2000, but see Honkavaara et al. Reference Honkavaara, Rantala and Suhonen2009). This study was conducted with the Northern Damselfly (Coenagrion hastulatum, Charpentier, 1825), which has probably the widest distribution of odonates in Finland (Dijkstra, Reference Dijkstra2006; Karjalainen, Reference Karjalainen2010) and is commonly infected by water mites and gregarines (Corbet, Reference Corbet1999). Both parasite taxa are spatially variable and might produce distinct patterns of resistance among damselfly host populations. Owing to the wide distribution of damselfly C. hastulatum, they encounter a diverse set of environments. Both temperature and length of photoperiod vary across the C. hastulatum range and are important regulators of the invertebrate host immune response (e.g. De Block et al. Reference De Block, Slos, Johansson and Stoks2008b; Corby-Harris and Promislow, Reference Corby-Harris and Promislow2008). Across spatial scales, such environmental variation could cause spatial patterns in the ability of the host to resist parasites. In this study, we chose C. hastulatum sample sites from a wide geographical gradient because, according to the geographical mosaic theory of co-evolution, selection pressures are likely to vary between northern and southern sample sites with, for example, substantially different photoperiod mean temperature and level of parasitism (Thompson, Reference Thompson1994). This can result in significant genetic differences between subpopulations of a species. These differences may include pathogen defence levels.
The most abundant endo- and ectoparasites in these damselflies are water mites, (Acari: Hydrachnida) and gregarines (Protozoa) (Robinson, Reference Robinson1983; Åbro, Reference Åbro1990). Ectoparasitic water mites drain substantial amounts of body fluids through the chitinous exoskeleton of the host damselfly, which is likely to reduce the damselfly's survivorship and lifetime reproductive success (Forbes and Baker, Reference Forbes and Baker1991; Neubauer and Rehfeldt, Reference Neubauer and Rehfeldt1995; Leung and Forbes, Reference Leung and Forbes1997). In the damselflies, the immunological response to water mite infection is melanotic encapsulation of the mite's feeding tube, the stylostome (Forbes et al. Reference Forbes, Muma and Smith1999). Other parasites, the endoparasitic gregarines are extracellular sporozoan parasites of invertebrates. Within the family of Actinocephalidae, the gregarines are cosmopolitan mid-gut endoparasites of damselflies (e.g. Åbro, Reference Åbro1990, Reference Åbro1996; Ilvonen et al. Reference Ilvonen, Ilvonen, Kaunisto, Krams and Suhonen2011). Gregarines reduce the energy absorbed from the food by its host (Siva-Jothy and Plaistow, Reference Siva-Jothy and Plaistow1999). Also, individuals that have a high burden of trophozoites often have ruptured and/or blocked mid-guts, which are likely to reduce the host's longevity (Åbro, Reference Åbro1990, Reference Åbro1996). Moreover, as longevity is a major determinant of fitness in many odonates (e.g. Sokolovska et al. Reference Sokolovska, Rowe and Johansson2000), and energy resources are vital for an individual's immune response and reproduction (Mesterton-Gibbons et al. Reference Mesterton-Gibbons, Marden and Dugatkin1996), gregarines are very likely to have dramatic impacts on host fitness.
In the previous studies in odonates, it has been shown that water mites and gregarine parasite burden reduces flight ability, fat content and muscle output, effectiveness of finding mate, breeding success, female fertility, male condition, and to increase mortality rate (Siva- Jothy and Plaistow, Reference Siva-Jothy and Plaistow1999; Forbes et al. Reference Forbes, Muma and Smith2002; Marden and Cobb, Reference Marden and Cobb2004; Schilder and Marden, Reference Schilder and Marden2006; Forbes and Robb, Reference Forbes, Robb and Córdoba-Aguilar2008; Rantala et al. Reference Rantala, Honkavaara and Suhonen2010). Furthermore, the length of the photoperiod has been shown to affect both phenoloxidase, the main component of the invertebrate immune response, and fat content, which are tightly linked to fitness in damselflies (Plaistow and Siva-Jothy, Reference Plaistow and Siva-Jothy1996; Rolff and Siva-Jothy, Reference Rolff and Siva-Jothy2004; De Block et al. Reference De Block, Mc Peek and Stoks2008a). On the other hand, fat content has been shown to also affect individual size in invertebrates (Boggs and Freeman, Reference Boggs and Freeman2005). Finally, the size of an individual may play a role in parasite infection rate, so that larger individuals may harbour more parasites, for example because of the enhanced carrying capacity, or because a larger size may represent a greater resource for more individual parasites (Bush et al. Reference Bush, Fernández, Esch and Seed2001).
Most previous damselfly studies were conducted at an individual level in one population, but interpopulation level studies are particularly scarce (but see De Block et al. Reference De Block, Slos, Johansson and Stoks2008b) and most studies have focused only on a single parasite taxon while ignoring other possible infection agents (but see Honkavaara et al. Reference Honkavaara, Rantala and Suhonen2009). In this study our main goal was to untangle the relationship between variation in parasite burden and variation in immune response across different insect populations. We measured immune responses in the C. hastulatum damselfly to see whether these are related to natural ecto- and endoparasite infection levels, the size of the individual measured by length of the wing, and length of day (latitude).
MATERIALS AND METHODS
Description of study areas and fieldwork
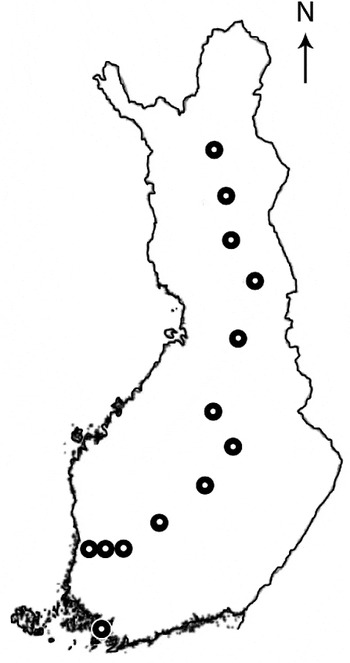
The data were collected in Finland between Kemiö (60°5′N, 22°4′E) and Sodankylä (67°31′N, 26°4′E), during 20–27 of June in 2009 from 13 different populations (Fig. 1). Samples were collected across an approximately 880 km latitudinal gradient, consisting of virtually the whole area of continuous distribution of C. hastulatum in Finland (Dijkstra, Reference Dijkstra2006; Karjalainen, Reference Karjalainen2010), thus providing a large geographical gradient with varying photoperiod and mean temperature. According to the Finnish Meteorological Institute, the mean temperature varies approximately 6 °C between the most southern and most northern sample sites (colder in north), and odonates develop faster as larvae in warmer conditions in temperate regions (e.g. Corbet, Reference Corbet1999; Johansson et al. Reference Johansson, Sniegula and Brodin2010; Karjalainen, Reference Karjalainen2010). Thus, it was assumed that northern individuals emerge somewhat later in Finland and therefore the samples from the northern sites were collected generally a few days later to compensate for the slight delay in emergence. In Finland, the whole flight period of the study organism, C. hastulatum, lasts for roughly 3·5 months a year. Our samples were collected during 8 days, using as many same aged individuals as possible, in order to deal with the individuals in the same part of the flight period. All sample sites are freshwater watersheds. Sample site location was determined to the nearest 50 metres grid of sample collection area by use of a GPS-device. From each population, 12 males and 12 females (except from Vehniä: 14 males and 8 females, and from Kuusamo: 11 males and 12 females) of C. hastulatum were captured: in total 309 individuals.
Locations of the study populations of Coenagrion hastulatum in Finland are indicated with filled dots (n=13).
When samples were collected, each individual's age was determined by stiffness of the wings, as described by Plaistow and Siva-Jothy (Reference Plaistow and Siva-Jothy1996) for Calopteryx damselflies, and by colouration of the body. Only sexually mature, i.e. ‘adult coloured’ and stiff-winged individuals, were accepted for this study. Samples were kept in a small, cylindral 48 ml plastic container, until the rest of the samples were netted. Each container had a piece of wet towel in order to avoid drying of the specimen.
Activation of the immune system of damselfly
Multicellular pathogens activate an encapsulation reaction of the immune system of damselflies in nature. This relatively simple, yet efficient immune response can be activated also by artificial ‘pathogens’ or rather ‘foreing body’, such as nylon inserts, and its efficiency can be analysed precisely (e.g. Rantala and Roff, Reference Rantala and Roff2007; Cordoba-Aguilar et al. Reference Cordoba-Aguilar, Jimenez-Cortes and Lanz-Mendoza2009; González-Santoyo et al. Reference González-Santoyo, Córdoba-Aguilar, González- Tokmanand and Lanz-Mendoza2010). To challenge the damselfly's immune system, we inserted a 2·0 mm long piece of nylon (diameter 0·18 mm) ‘implant’ that had been sterilized with alcohol, through the third abdominal pleura on the dorsal side of the sternal tergal margin in order to mimic the natural penetration of the parasite through the exoskeleton. Thereafter, the immune system of the damselflies was allowed to respond to this implant for exactly 720 min (12 h). This time was chosen because our preliminary studies have shown that it delivers the largest differences between immune responses of C. hastulatum. During the incubation, all samples were kept in their individual plastic containers, at constant temperature (21 ± 0·5 °C) and standardized humidity in an RS-IF-202 incubator. After incubation, the implant was gently removed and air-dried. Thereafter, inserts were stored within 12 h at −12 °C and finally, after all the samples were collected, inserts were freeze-dried at −27 °C. Odonate samples were stored in 70% ethanol for further analysis in the laboratory.
Removed inserts were photographed in the laboratory through a stereomicroscope from two opposite directions, so that inserts where placed vertically towards the camera, and rotated 180° before the second photograph. All the inserts were knotted in order to have the loose end bent. By using this bent end as a support, rotation was precise. All photographs of the inserts were taken in a standardized set-up, i.e. identical lighting, camera equipment and settings. Thereafter photographs were analysed using the Image J computer program in order to measure the optical density of the formed capsulation film. Hence, individual values consist of a combination of the thickness of cell layer and the darkness of the cells, caused by a melanization reaction. The higher the value, the more efficient the immune response is assumed to be. This method, comparing cell layer thickness and melanization reaction of cells, has been used successfully in previous studies and has been proven to associate with an individual's ability to react against natural pathogens (e.g. Rantala and Roff, Reference Rantala and Roff2007).
Wings were cut off the body of odonates and placed between 2 thin microscope slides in order to prevent bending of the wing and other disturbing factors. Both hind wings of individuals were measured to the nearest 0·01 mm from the second antenodal crossvein with a caliper and the average of the wings was calculated. This measuring method is extremely accurate, as described by Tynkkynen et al. (Reference Tynkkynen, Rantala and Suhonen2004). As in many other insects, wing length can be used as a standard estimate of body size in odonates (Forbes and Baker, Reference Forbes and Baker1991; Corbet, Reference Corbet1999; Koskimäki et al. Reference Koskimäki, Rantala and Suhonen2009). The size was measured for the reason that the larger individuals may harbour more parasites, for example because of the enhanced carrying capacity, or because a larger size may represent a greater resource for more individual parasites (Bush et al. Reference Bush, Fernández, Esch and Seed2001). Numbers of water mites were calculated from the surface of damselflies with a stereomicroscope. In addition, few recently fallen mites (altogether 14 scars out of 6347 mites), recorded from the scars on damselflies, were included into prevalence and intensity estimates. Afterwards specimens were dissected with a fine surgical blade and numbers of gregarines were calculated from the interior of the individuals.
Statistics
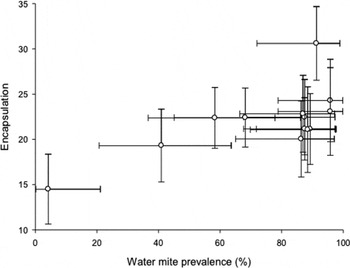
We calculated the prevalence of water mites and gregarine parasites for each population, as the total number of parasitized individuals, divided by the number of all individuals in the population (Bush et al. Reference Bush, Lafferty, Lotz and Shostak1997). Prevalence has been shown to be a relatively stable measure of infection of parasites (e.g. Hassall et al. Reference Hassall, Lowe, Harvey, Watts and Thompson2010, but see Nagel et al. Reference Nagel, Robb and Forbes2010) over the years. The prevalences of both water mites and gregarines were arcsin square transformed to satisfy assumption of normality. After transformation both variables fulfilled normal distribution (z = 1·19, n = 13, P = 0·119 and z = 0·71, n = 13, P = 0·703, respectively). Thereafter 95% confidence intervals were calculated for the prevalence and mean encapsulation rate of the populations (Fig. 2) (see Zar, Reference Zar1999).
Prevalence and 95% confidence intervals of water mites (%) in relation to the encapsulation response. A dot represents the mean values of sample populations (n = 13).
To explain variance in encapsulation response between populations, we used multiple linear regression analysis. In this model, the population mean encapsulation response was used as an independent variable, and (i) prevalence of both water mites and (ii) gregarines, (iii) the mean size of the individual (as length of the wing to nearest 0·1 mm) and (iv) the latitude as the measure of length of day (in km) were used as explanatory variables (Table 1). The latitude was measured to the nearest 50 metres of the sampling site's centre by using GPS. The multiple regression model was performed with stepwise selection. All 13 study populations were considered as independent observations. Analyses were conducted with PASW Statistics 18 software.
Result from multiple regression analysis The final model: F1,11 = 10·24, P = 0·008, r 2 = 0·44.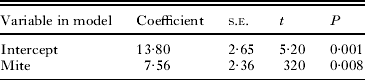
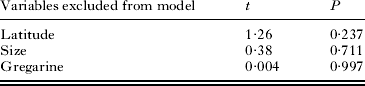
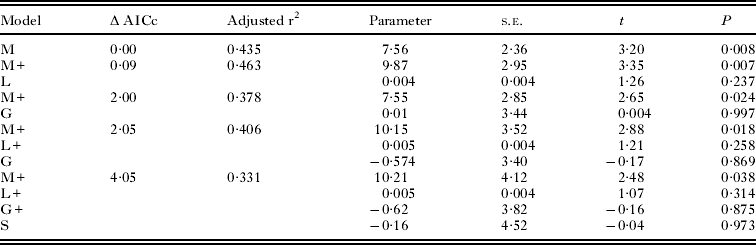
Model selection based on Akaike's Information Criteria (Anderson et al. Reference Anderson, Burnham and Thompson2000) was used to find out which of the alternative hypotheses best explain interpopulation variation in the immune response. Model selection can be used only if the data remain the same in all models tested. Altogether 4 main effects referring to the hypotheses (water mite, gregarine, latitude and individual size) were entered in computing alternative models (Table 2). The best model was selected based on Akaike's Information Criteria for small samples (AICc) (Andersson et al. Reference Anderson, Burnham and Thompson2000) where the model with the lowest AICc-value fits best to the data.
Individual model results of top models (with a Δ AICc <4) explaining the immune response in Coenagrion hastulatum populations in Finland
RESULTS
Overall, water mite and gregarine prevalence was high (grand mean from population was 76·3% (s.d. = 27·0) and 56·7%, (s.d. = 24·8), respectively. Further, 9 populations out of 13 had water mite prevalence greater than 80% (Fig. 1). The multiple regression model showed that interpopulation variation in immune response increased with increasing prevalence of water mites (Tables 1 and 2, Fig. 2). On the contrary, we did not find a statistically significant association between the immune response and the prevalence of gregarines (Tables 1 and 2). To further describe the mean number of parasites found in the infected hosts (the zeros of uninfected hosts were excluded), we calculated the mean intensity for both water mites and gregarines. The mean intensity of water mites was 27·3 ± 32·8 (mean±s.d.), range between 1 and 190 (infected individuals n = 240 out of 309). For gregarines, the mean intensity was 47·0 ± 79·1, range between 1 and 430 (infected individuals n = 178 out of 309) in the sample populations.
DISCUSSION
In this study, we found a strong interpopulation level association between the prevalence of water mite infection and the average immune response in C. hastulatum damselfly populations. In other words, more parasitized populations had an increased average immune response to ‘artificial pathogen’ with which their immune system was challenged. In addition, an alternative model from AIC included also the latitude and individual size. However, the prevalence of gregarine parasites did not explain the interpopulation variation in immune response of C. hastulatum.
In previous studies, the interpopulation difference in the immune response has been explained for example, by the differences in the length of the larval period (De Block et al. Reference De Block, Slos, Johansson and Stoks2008b). In this study, the mean temperature varied between sample sites by roughly 6 °C and the maximum length of the day from 18 to 24 h, which is likely to have effects, for example, on the length of the growth period, as the damselfly larvae do not grow substantially in water below a temperature of 10 °C (e.g. Karjalainen, Reference Karjalainen2010). In addition, diet, temperature and reproductive behaviour have been shown to affect the immune response in insects (Braune and Rolff, Reference Braune and Rolff2001; Schmid-Hempel, Reference Schmid-Hempel2004; De Block et al. Reference De Block, Slos, Johansson and Stoks2008b). Here we found a fundamental complementary factor to explain the detected difference in the immune response, as there was a strong interpopulation level association between the immune response of the C. hastulatum and the water mites. An explanation for our results may be that C. hastulatum populations are (i) locally adapted to chronic water mite infection, (ii) individual damselflies have an effective, ‘induced’ immune response against parasites, or (iii) a combined effect of both of these effects. One possible explanation for our results may be the geographical mosaic theory of co-evolution (Thompson, Reference Thompson1994), in which selection pressures vary between local populations with e.g. a substantially different level of parasitism, photoperiod and/or mean temperature (here latitude). This can result in significant immunity differences between C. hastulatum populations. The positive association between the water mite burden and the immune response may be due to local adaptation to chronic stress of parasite burden, so that the immune response is initially higher in heavily parasitized populations. If local population was adapted to local water mite burden, infection rate between years has to be stable and/or dispersal between populations must be low. If dispersal between populations is high and/or infection rate between nearest populations varied considerably, the selection may break down the local adaptation process. In previous studies, the prevalence of water mites was fairly constant between the years (Hassall et al. Reference Hassall, Lowe, Harvey, Watts and Thompson2010, but see Nagel et al. Reference Nagel, Mlynarek and Forbes2011). Also, it has been shown that distance is a main restricting factor for dispersal of damselflies and populations seem to be essentially restricted to their natal pond, especially small species such as Coenagrionidae damselflies (e.g. Angelibert and Giani, Reference Angelibert and Giani2003). Furthermore, Coenagrion mercuriale was found to be extremely sedentary, with dispersal limited to an area of contiguous habitat. The median net lifetime movement was 31·9 m and 66% of individuals moved less than 50 m in their lifetime. Movements of greater than 500 m were rare and the longest recorded movement was 1·79 km (Rouquette and Thompson, Reference Rouquette and Thompson2007). Coenagrion mercuriale is presumably the most sedentary of its genus, but other Coenagrion species do also have weak dispersal abilities. Thus, according to these studies and personal observations from C. hastulatum dispersal abilities, we assume that dispersal between our study sites with tens of kilometers distance is fairly insignificant. Consequently, we consider local adaptation as a highly possible explanation for the strong association between the immune response and the water mite burden.
In this study, the other parasite taxon, endoparasitic gregarines, did not affect the interpopulation level immune response. This is consistent with several previous studies, which failed to find evidence for gregarine parasite infection and immunity in damselflies (Cordoba-Aguilar et al. Reference Cordoba-Aguilar, Conteras-Garduno, Peralta-Vazquez, Luna-Gonzalez, Campa-Cordova and Ascencio2006; Contreras-Garduno et al. Reference Contreras-Garduno, Cordoba-Aguilar and Peralta-Vazquez2008; Honkavaara et al. Reference Honkavaara, Rantala and Suhonen2009). However, gregarine parasites have other fitness costs, for example they absorb energy from their host (Siva-Jothy and Plaistow, Reference Siva-Jothy and Plaistow1999). Also, individuals that have a high burden of trophozoites often have ruptured and/or blocked mid-guts, which are likely to reduce the host's longevity (Åbro, Reference Åbro1990, Reference Åbro1996). Moreover, as longevity is a major determinant of fitness in many odonates (e.g. Sokolovska et al. Reference Sokolovska, Rowe and Johansson2000), and energy resources are vital for an individual's immune response and reproduction (Mesterton-Gibbons et al. Reference Mesterton-Gibbons, Marden and Dugatkin1996), gregarines are very likely to have a negative impact on host fitness.
An alternative model, based on Akaike's Information Criteria, which included either the prevalence of water mites, the latitude, or the individual size, fitted only slightly less well than the models with only prevalence of water mites. The role of individual size may originate from the fact that the larger individuals may physically harbour more parasites, e.g. because of the enhanced carrying capacity, or because a larger size may represent a greater resource for more individual parasites (Bush et al. Reference Bush, Fernández, Esch and Seed2001). Latitude, in turn, has effects on temperature, as well as the length of the photoperiod. According to long-term data from the Finnish Meteorological Institute, the average temperature varies by approximately 6 °C between the southernmost and the northernmost sample sites during one year. Winters in southern Finland (average day-time temperature is below 0 °C/32°F) are usually 4 months long and in northern Finland, nearly 7 months long, affecting e.g. freezing of the water body. In addition, the maximum length of the day varies from roughly 18 to 24 h, from south to north, during the main flight period of C. hastulatum. In previous studies, the length of the photoperiod has been shown to affect PO, the main component of the immune system activity in damselfly species (De Block et al. Reference De Block, Slos, Johansson and Stoks2008b). Moreover, the length of the photoperiod has been shown to affect fat content in damselflies (De Block et al. Reference De Block, Slos, Johansson and Stoks2008b), and fat content in turn may be linked to individual size (Plaistow and Siva-Jothy, Reference Plaistow and Siva-Jothy1996; Boggs and Freeman, Reference Boggs and Freeman2005; Koskimäki et al. Reference Koskimäki, Rantala and Suhonen2009). Both fat content and PO are tightly linked to fitness in damselflies (Plaistow and Siva-Jothy, Reference Plaistow and Siva-Jothy1996; Siva-Jothy and Plaistow, Reference Siva-Jothy and Plaistow1999; Rollf and Siva-Jothy, Reference Rolff and Siva-Jothy2004). As these traits seem to be somewhat linked, there is likely to be some compensatory effects between them, which may conceal some part of the association. Thus further studies are needed, ideally with environmental variables, to see how the environment affects these evolutionary responses. Moreover, in order to create a causative link between the immune response and the effects of parasites, traits should be examined in a variety of genetic backgrounds and under controlled conditions.
In addition to the innate immunity, recent studies have shown that invertebrates do also have certain immune mechanisms that could be classified as ‘induced’ immunity, thus being functionally more protective upon secondary pathogen exposure (Arala-Chaves and Sequeira, Reference Arala-Chaves and Sequeira2000; Schmid-Hempel, Reference Schmid-Hempel2005; Sadd and Schmid-Hempel, Reference Sadd and Schmid-Hempel2006). This may be an alternative explanation for our results. It may be that the effective response to high infection rate by water mites has raised the immune response for ‘artificial pathogen’, with which we measured the immune response. In a previous study in Lestes damselflies Nagel et al. (Reference Nagel, Robb and Forbes2010) found that the level of parasite infection and immune response varied interannually, a pattern that could not be explained by local adaptation to chronic parasite stress. Furthermore it is important to bear in mind that these explanations do not exclude each other, so further studies are required to resolve the potential role for induced immunity effects to operate in different populations.
To conclude, C. hastulatum showed a positive association between the immune response and water mite prevalence. In addition, individual size and latitude also associated with the immune response. This is to say that when determining associations between the immune response and other traits, it seems to be crucially important to take both the parasite history of a population and the individual size and latitude into account.
ACKNOWLEDGEMENTS
We thank Pipsa Lappalainen for crucial help with laborious sample collection and the Ph.D. seminar group at University of Turku for valuable comments. Work was financially supported by Societas pro Fauna et Flora Fennica (K.M.K.), The Finnish Cultural Foundation (K.M.K.) and Academy of Finland (J.S.).



