

INTRODUCTION
Understanding the structure of the material on which the learner operates is relevant to any theory of language acquisition. Classic approaches have characterized the input as deeply problematic for learning, as being both (1) too impoverished to present clear evidence for the deep generalizations that underlie human language (e.g. Crain & Pietroski, Reference Crain and Pietroski2002), and (2) too rich to allow the learner to isolate important global patterns among many irrelevant local regularities (e.g. Yang, Reference Yang2004). Theorists have attempted to solve this input problem by postulating strong constraints on language learning mechanisms (e.g. Baker, Reference Baker2005). Several recent advances, however, suggest the value of a new look at the input. First, experimental studies of learning have shown that humans and other animals have general-purpose but powerful statistical learning mechanisms that can find deep regularities in the language input (e.g. Saffran, Aslin & Newport, Reference Saffran, Aslin and Newport1996; Yu & Smith,Reference Yu and Smithin press). Second, new computational techniques have made it possible to study the statistical regularities in large corpora of natural language, including speech between parents and children (e.g. Redington, Chater & Finch, Reference Redington, Chater and Finch1998; Mintz, Reference Mintz2003). Just how much statistical learning can contribute to language acquisition, though, depends on what regularities are present in the learning environment, on the learner's ability to grasp them, and on their utility as indicators of deeper truths about language. The last is particularly important – for statistical learning to do its job, the salient regularities in the perceptual environment must be informative; they must correlate with structure and meaning. With these issues in mind, the present study examines some regularities in a large corpus of parent speech to children that may be relevant to early verb meanings.
Acquisition of verb meanings is an interesting test case for examining statistical regularities, both because verbs are especially challenging for young learners and because there is already some evidence that word/word relations are useful for verb acquisition. Verbs are particularly abstract, relational entities whose meanings are usually not directly perceptible (e.g. Gentner, Reference Gentner, Stan and Kuczaj1982; and many of the papers in Hirsh-Pasek & Golinkoff, Reference Hirsh-Pasek and Golinkoff2006). Indeed, there are classes of early-learned verbs that have no observable referents, including psychological state verbs like look, think, want, believe and know. Even verbs that seem to refer to observable actions often refer to relations from a particular perspective; for example, the exact same perceptual event could be an example of buying, selling, giving, receiving or many other verbs. In brief, meaning maps between verbs and the world are not transparent. All this suggests that children may need to learn verb meanings through their relations to other words in the input.
Many previous researchers (e.g. Brown, Reference Brown1957; Gleitman, Reference Gleitman1990; Naigles, Reference Naigles1990) have suggested that word/word relations in general, and syntactic frames specifically, are important for learning verbs – that the subcategorization frames in which a verb appears in caretaker speech offer potential cues to word meanings for the language learner. The ‘Human Simulation Paradigm’ experiments have shown that knowledge of nearby nouns, syntactic frames and real-word scenes make independent and cumulative contributions to adults' ability to identify masked verbs in speech (e.g. Gleitman, Cassidy, Nappa, Papafragou & Trueswell, Reference Gleitman, Cassidy, Nappa, Papafragou and Trueswell2005). Merlo & Stevenson (Reference Merlo and Stevenson2001) demonstrated that it is possible to semantically classify verbs according to the statistical distributions of their argument structures in a large corpus of written text. Lederer, Gleitman & Gleitman (Reference Lederer, Gleitman, Gleitman, Tomasello and Merriman1995) demonstrated that it is possible to semantically classify verbs according to the distributions of their usages in syntactic frames in maternal speech to children. It has also been suggested that children might use the selectional preferences exhibited in the linguistic input (the sets of nouns that the child actually hears as subjects and objects) to help learn verbs (Wykes & Johnson-Laird, Reference Wykes and Johnson-Laird1977). None of these studies, however, has systematically examined the regularities that characterize large corpora of speech to young learners. Just what are the regularities in the input between individual verbs and their subjects, or between individual verbs and their objects? Are there sufficient regularities to enable a statistical learner to partition verbs into meaningful categories? These are the questions examined in this paper.
Although the analyses reported here are sensitive to many possible regularities that might be found in child-directed speech (and thus that might be useable by child learners), they are particularly sensitive to the potential role that pronouns might play in specifying categories of verb meanings. Three considerations suggest that pronouns might provide bootstraps to verb meaning. First, pronouns are among the most frequently used words in spoken English (Leech, Rayson & Wilson, Reference Leech, Rayson and Wilson2001), most syntactic subjects in spontaneous spoken adult discourse in general are pronouns (Chafe, Reference Chafe1994), and pronouns are also the most frequent syntactic subjects in English-speaking children's speech (Valian, Reference Valian1991). This makes sense in light of the fact that parental speech to children is typically about the ‘here and now’ (Brown & Bellugi, Reference Brown and Bellugi1964) and is therefore full of deictic terms, including demonstratives and other pronouns (Clark & Wong, Reference Clark and Wong2002). The present paper provides a comprehensive description of the frequency of pronouns as subjects and objects in parental child-directed speech (PCDS) in English. Second, for statistical learning devices, closed-class lexical items (such as determiners, conjunctions, prepositions and pronouns) are likely to be powerful precisely because they are limited in number and high in frequency (and thus provide the opportunity for ample reliability in any predictive relation). The specific purpose of the present study is to determine those predictive relations and their reliability. Third, several prior results suggest the developmental relevance of pronouns in verb learning. For example, Cameron-Faulkner, Lieven & Tomasello (Reference Cameron-Faulkner, Lieven and Tomasello2003) observed that parents use the inanimate pronoun it far more frequently as the subject of an intransitive sentence than of an transitive one. As Cameron-Faulkner et al. note, this suggests that parents use intransitive sentences more often than transitives for talking about inanimate objects. The studies reported in this paper seek to determine what other predictive relations relevant to verb meaning might be present in the input.
Analyses of child speech also point to the potential value of this last goal. Pronouns – especially it and that – are some of the earliest words to combine in multiword expressions (Braine, Reference Braine1976). It has been suggested (e.g. Lieven, Pine & Baldwin, Reference Lieven, Pine and Baldwin1997; Childers & Tomasello, Reference Childers and Tomasello2001) that pronouns may form the fixed element in lexically-specific frames (such as I do it) acquired by early language learners as a way into learning syntactic frames – so-to-speak ‘pronoun islands’, something like Tomasello's ‘verb islands’ (Tomasello, Reference Tomasello1992). Indeed, Jones, Gobet & Pine (Reference Jones, Gobet, Pine, Gleitman and Joshi2000) performed a related distributional analysis on a corpus of child-directed speech and found that their artificial language learner formed a number of pronoun islands based on certain high-frequency pronouns. Other work (Childers & Tomasello, Reference Childers and Tomasello2001) has demonstrated that only children trained with both nouns and pronouns are able to comprehend and produce transitive utterances with nonce verbs, suggesting that – in comprehension as well as production – English-speaking children may build early linguistic constructions around particular pronoun configurations. Researchers have also noted that children frequently use it after a verb. Indeed, Lieven et al. (Reference Lieven, Pine and Baldwin1997) remark that the fact that it appears so widely on a range of verbs suggests that it may mark the development of an emergent ‘verb’ category. Taken together, these results suggest that young children may not only build syntactic constructions around verbs but also build some of their knowledge of verbs themselves around other kinds of consistent lexical material, including pronouns.
In summary, the present research seeks to describe statistical regularities among verbs and lexical items in the leading (subject) and trailing (object) positions that surround verbs, and test whether a simple mechanism can learn these regularities. The statistical description reported in Studies 1–3, only recently made possible by the availability of large corpora and advances in computational techniques to analyze them, is relevant to understanding both the solutions and the limitations presented to the learner by the complexity of the input. Importantly, the statistical regularities that characterize language may not always be discernable in experimental studies with small numbers of subjects, nor from introspection. Rather, finding the most salient regularities may require a corpus study. The intriguing possibility is that large-scale corpus analyses may find useful and important regularities that are not obvious on a small scale (see Mintz, Reference Mintz2003, for a case in point). The simulation reported in Study 4 demonstrates that the discovered statistical regularities are learnable by general learning mechanisms.
STUDY 1
The main analyses are presented as Study 1, which examines a large corpus of parental speech to children, specifically examining patterns of co-occurrence among individual lexical items – verbs and the nouns and pronouns that are the subjects and objects of those verbs.
METHOD
Parental utterances from the CHILDES database (MacWhinney, Reference MacWhinney2000) were coded for syntactic categories, then subjected to principal components analysis (PCA), clustering and statistical analysis. The target children in the transcripts were aged approximately 1 ; 2–6 ; 9. The mean age of target children represented in the transcripts coded for this study was 3 ; 0 (SD=1 ; 2).
Materials
The corpora used were: Bates, Bliss, Bloom (1970), Brown, Clark, Cornell, Demetras, Gleason, Hall, Higginson, Kuczaj, MacWhinney, Morisset, New England, Post, Sachs, Suppes, Tardif, Valian, Van Houten, Van Kleeck and Warren-Leubecker. Full references may be found in the CHILDES database manual (MacWhinney, Reference MacWhinney2000). An Internet application randomly selected transcripts, assigned them to coders as they became available, collected coding input and stored it in a MySQL database. The application occasionally assigned the same transcript to all coders, in order to measure reliability. Five trained undergraduates performed the coding. Clustering and other statistical analyses were performed in MATLAB, Python and R.
Procedure
For each main tier line, coders identified the speaker, the addressee and the syntactic frame (no verb, question, passive, copula, intransitive, transitive or ditransitive), as described below. They then coded each word for its syntactic category in that utterance (subject, auxiliary, verb, direct object, indirect object or oblique – others were ignored). The guiding principles of the coding scheme were to stay close to the surface structure of the input and attribute minimal knowledge to the child. The coding scheme allowed analysis of utterances in which the child was most likely to grasp the syntactic relations between arguments and verbs (utterances in canonical SVO word order) while isolating utterances that are likely to cause confusion about syntactic relations (utterances with inverted word order, including passives and some questions). It also avoided attributing knowledge of argument structure to children, by coding only overtly expressed arguments.
The coding application sequentially presented a coder with each main tier line of each assigned transcript, together with several lines of context; the entire transcript was also viewable by clicking a link on the coding page. For each line, the coder indicated: (a) whether the speaker was a parent, target child or other; (b) whether the addressee was a parent, target child or other; (c) the syntactic frames of up to three clauses in the utterance; and (d) for each clause, up to three each of subjects, auxiliaries, verbs, direct objects, indirect objects and obliques.
Because many utterances were multi-clausal, the unit of analysis for assessing pronoun–verb co-occurrences was the clause rather than the utterance. Nouns appearing in prepositional phrases were coded as obliques (with the exception of recipients indicated using to, which were coded as indirect objects). Object complements were indicated by coding the direct object of the matrix verb as ‘(clause)’ and coding the constituents of the complement clause as the next clause associated with the utterance. This was intended both to simplify the coding scheme and to avoid attributing too much grammatical knowledge to the child – the analysis does not presuppose that the child can convert an utterance into an accurate parse tree, only that she can identify verbs and the surrounding nouns.
The syntactic frames were: no verb, question, passive, copula, intransitive, transitive and ditransitive. These were mutually exclusive; that is, each clause was tagged as belonging to one and only one frame, according to which of the following rules it matched first:
- Rule 1.
Utterances with no main verb (such as Yes or OK) were coded as no verb.
- Rule 2.
Clauses that were both marked as interrogatives (using the ‘?’ utterance terminator in CHILDES) and had inverted word order were coded as questions.
- Rule 3.
Clauses in the passive voice, such as John was hit by the ball, were coded as passives.
- Rule 4.
Clauses with a copula (including be, seem and become) as the main verb, such as John is angry, were coded as copulas.
- Rule 5.
Clauses with no overtly expressed direct object, such as John ran, were coded as intransitives. Obliques were ignored. Thus, John ran on the grass was also coded as an intransitive.
- Rule 6.
Clauses with a direct object (or an object complement) but no indirect object, such as John hit the ball, were coded as transitives. Again, obliques were ignored.
- Rule 7.
Clauses with an indirect object, such as John gave Mary a kiss, were coded as ditransitives. Again, obliques were ignored.
All nouns were coded in their singular forms, whether they were singular or plural (e.g. boys was coded as boy), and all verbs were coded in their infinitive forms, whatever tense they were in (e.g. ran was coded as run).
A few notes are in order about utterances that do not obviously fall neatly under one of the rules above. Imperatives were coded in exactly the same way as declaratives, using only their overtly expressed arguments. For example, Go! was coded as an intransitive, Drop it! as a transitive, and Bring it to me! as a ditransitive; in all of these cases, the utterance was coded as not having a subject. Fragments containing a verb were also coded using all and only overtly expressed arguments. For example, After he left was coded as an intransitive with subject he. Any interrogative clause having inverted word order was coded as a question, regardless of whether it began with a wh-word. For example, both Where did you go? and Did you go to the bank? counted as questions. Clauses merely ending with question marks but not having inverted word order were also not coded as questions. For example, both You went to the bank? and What happened next? were coded as intransitives.
In total, 59,977 utterances were coded from 123 transcripts. All of the coders coded 7 of those transcripts for the purpose of measuring reliability. Average inter-coder reliability (measured for each coder as the percentage of items coded exactly the same way as by each other coder) was 86·1%. It is not possible to calculate Cohen's kappa coefficient, which adjusts for chance agreement, for this data, because kappa is only applicable for two raters. However, given the number of variables, the number of levels of each variable (3 speaker types, 3 addressee types, 7 clause types and 6 syntactic relation slots with up to 3 open-ended values each), and the number of coders (5) in the present study, the probability of chance agreement is very low.
A total of 24,286 PCDS utterances were coded, including a total of 28,733 clauses. More than a quarter (28·36%) of the PCDS clauses contained no verb at all; these were excluded from further analysis. Clauses that were questions (16·86%), passives (0·02%) and copulas (11·86%) were also excluded from further analysis. The analysis was conducted using only clauses that were intransitives (17·24% of total PCDS clauses), transitives (24·36%) or ditransitives (1·48%), a total of 12,377 clauses.
Principal components analysis and hierarchical clustering were used for data analysis and the log-likelihood ratio (LLR) was used for a quantitative measurement of the statistical strength of co-occurrence relationships (Dunning, Reference Dunning1993).
RESULTS
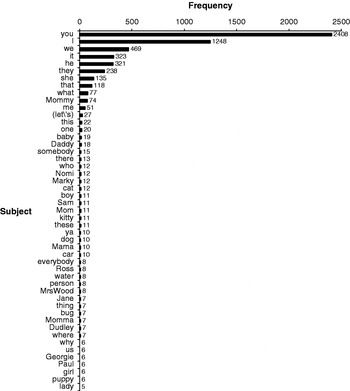
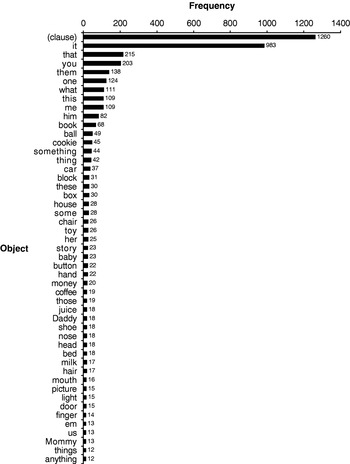
The most frequent subjects and objects in the corpus, by far, are pronouns. Figure 1 shows the words most frequently used as subjects, and Figure 2 shows the words most frequently used as objects. It is clear from Fig. 1 that the subjects you and I are exceptionally frequent in parental speech to children, followed by we, it, he, they, she and that. The first noun that is not a pronoun in Fig. 1 is Mommy, which is less than 1/30th as frequent as you. (The high frequency of the question word what as a syntactic subject in Fig. 1 is a consequence of the fact that what was coded as the subject of utterances such as What gives? and What goes ‘quack’? that were not considered questions according to Rule 2 above. This issue is discussed in more detail below.) It is clear from Fig. 2 that the pronoun it is exceptionally frequent as the object of a verb, rivaled only by the use of a complement clause, and followed mostly by other pronouns: that, you, them, this, me and him. The first common noun in Fig. 2 is book, roughly 1/14th as frequent as it. The overwhelming frequency of pronouns in the parental input suggests that they may play an important role in language acquisition.
The 50 most frequent syntactic subjects in parental child-directed speech ranked by their number of occurrences, showing raw frequency.

The 50 most frequent syntactic objects in parental child-directed speech ranked by their number of occurrences, showing raw frequency.

The following subsections report three analyses of noun–verb co-occurrence: principal components analysis, hierarchical clustering analysis and log-likelihood ratio analysis. Within each subsection, verbs and their subjects are discussed first, followed by verbs and their objects.
Principal components analysis
In order to examine the relationships between verbs and their syntactic objects, a verbs-by-objects matrix was formed from the clauses in the corpus sample. The verbs-by-objects matrix contained only verbs used with a direct object; its size was 524 verbs by 907 nouns (objects). Each cell contained the proportion of times that verb was used with that noun (as object) in a coded clause. This matrix may be regarded as specifying the positions of the verbs in ‘object noun space,’ that is, an abstract hyperdimensional space formed by considering each object noun as a dimension. Each verb may be located along each dimension according to the proportion of times it is used with the corresponding object noun. For instance, a verb never used with a particular noun as object would be at zero along the dimension corresponding to that noun, whereas a verb always used with that noun as object would be at one on that dimension.
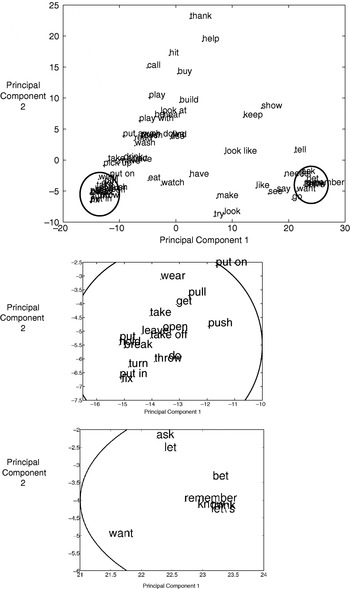
It is impossible to visualize this 907-dimension space directly. However, principal components analysis (PCA) may be used to project the verbs into the two orthogonal dimensions that preserve as much of the variance in the data as possible. Fig. 3 shows the resulting plot. There are two dense ‘clumps’ of verbs in Fig. 3, shown in the insets. In the first, which occupies the lower left corner of the main plot, are verbs such as get, push, pull and put that, while often semantically light, primarily relate to physical motion. This is especially clear in contrast with the other clump, which occupies the lower right corner of the main plot and contains verbs such as want, remember, know, think and bet that primarily relate to mental states. The fact that each of these clumps contains verbs that are close to each other in object noun space indicates that there is something similar about the objects typically used with the verbs within each clump, although it does not indicate precisely what that similarity is. The fact that the verbs within each clump also appear to be semantically similar is intriguing and discussed in more detail below.
Verbs plotted in the first two principal components of syntactic object space. The insets magnify the clusters circled in the main diagram.

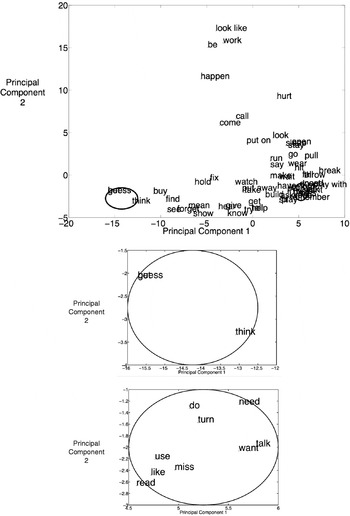
The analysis of subjects used the same techniques as the analysis of objects. The verbs-by-subjects matrix contained only verbs used with an overt subject; its size was 621 verbs by 317 nouns (subjects). Fig. 4 shows the PCA plot. As with Fig. 3, it is a bit difficult to interpret because of the dense overlap. However, there are three verbs in the lower left corner (bet, guess and think) that appear semantically related in that they all have to do with degrees of belief or knowledge. Similarly, there is a dense ‘clump’ of verbs in the lower right corner, that contains four verbs (need, want, miss and like) that have to do with attitudes. Here again, it is clear that there is some structure in the space of verbs in subject space.
Verbs plotted in the first two principal components of syntactic subject space. The insets magnify the clusters circled in the main diagram.

One issue with using PCA for this sort of data is that it finds a set of axes that may consist of arbitrary (linear) transformations of the axes in the original data, and thus may be difficult to describe linguistically. Another is that projection of the data into two of the principal components for plotting may not capture essential variance in the data – the verbs that overlie each other in a PCA plot may lie at different depths along the third principal component (or even a further one), not captured in a two-dimensional graph. The value of the PCA plots shown here is that they demonstrate that there is some non-arbitrary structure in the co-occurrences of verbs with syntactic subjects and objects. They also suggest that this surface structure may correspond to deeper, semantic regularities. However, addressing that issue requires other tools.
Cluster analysis
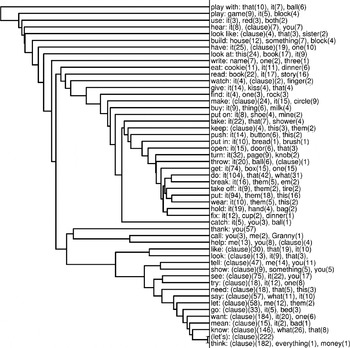
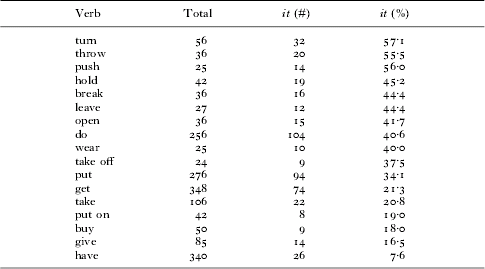
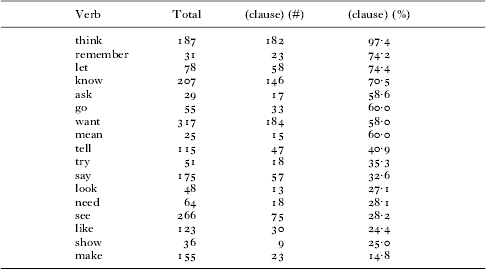
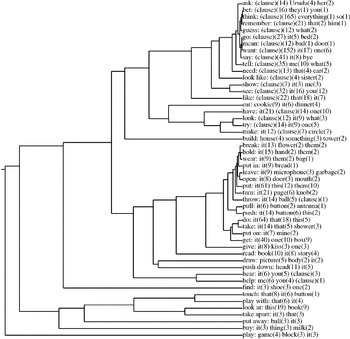
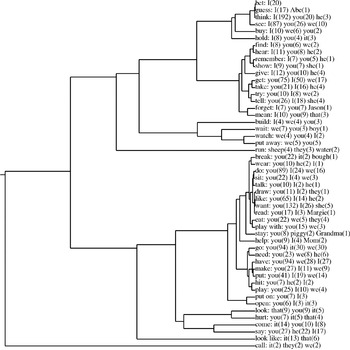
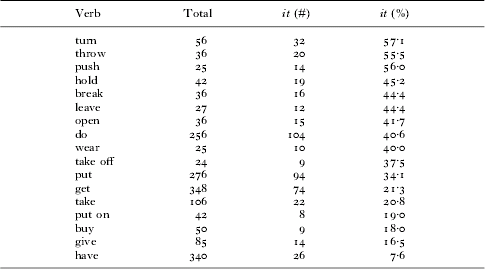
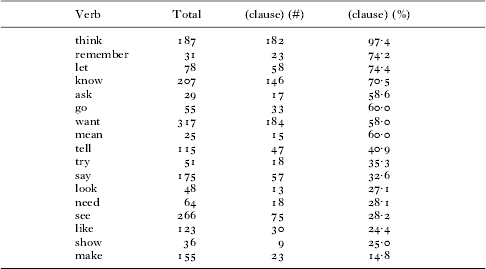
Another common tool for analyzing proximities or similarities in high-dimensional spaces is hierarchical cluster analysis. Roughly speaking, this sort of cluster analysis finds the hierarchical structure of the proximities among points in a set of data (what are the two closest points, the two next closest, and so on), and joins them together such that they can be visualized as a ‘tree’ or dendrogram very much like the cladogram or ‘tree of life’ illustrations familiar from discussions of evolution. Fig. 5 shows the results of a cluster analysis of the 50 most frequent verbs in object noun space, together with the nouns they most frequently take as objects. There are two dense clusters in Fig. 5. One contains verbs that occur predominantly with the syntactic object it. These verbs – such as hold, put, break, throw and turn – are also semantically related in that they describe physical motion or transfer. Table 1 provides a more detailed list of the verbs most commonly used with it. The second dense cluster in Fig. 5 contains verbs that occur predominantly with complement clauses. Table 2 contains a more detailed list of these verbs, many of which – including think, remember, know, want and need – relate to mental states. The rest of the verbs in Fig. 5 take a variety of concrete nouns, some more consistently than others. For example, in the child's world (as it is represented in CHILDES), one almost always eats a cookie and plays a game. In the child's linguistic input, co-occurrence with the object it is characteristic of physical motion or transfer verbs, co-occurrence with a complement clause is characteristic of mental state and communicative verbs, and there is a variety of other verbs that each tend to select a narrow set of nouns as objects.
Cluster diagram showing proximity relationships among the 50 most frequently used verbs in the space of syntactic objects (including complement clauses as ‘(clause)’). In all cluster diagrams in this paper, the clusters were generated by pairwise complete-linkage hierarchical agglutinative clustering over Euclidean distance between verbs. Labels indicate the three object nouns most commonly used with the corresponding verb, with the number of co-occurrences in square brackets.

Verbs most frequently used with the syntactic object it. For each verb, the table shows the total number of occurrences of that verb in the corpus sample described in the text, the total number of occurrences of that verb with the object it, and the percentage of total occurrences that were with the object it. Some of these verbs do not appear in Fig. 5 because, although they were used frequently with it, they were not among the 50 most frequent verbs overall
Verbs most commonly used with complement clauses. For each verb, the table shows the total number of occurrences of that verb in the corpus sample described in the text, the total number of occurrences of that verb with a complement clause, and the percentage of total occurrences of that verb that were with complement clauses. Some of these verbs do not appear in Fig. 5 because, although they were used frequently with clauses, they were not among the 50 most frequent verbs overall
In the corpus sample, the verb thank occurs 100% of the time with the object you. Of course, this is because thank you is a fixed phrase, and arguably, there is no sense in claiming that you is actually the syntactic object of thank in such usages. One might argue, therefore, that the analysis should exclude fixed phrases such as thank you. This point is discussed in more detail below.
In the clustering of verbs in subject-noun space (Fig. 6), the subjects divide the most common verbs into three classes: verbs whose subject is most frequently I, verbs whose subject is most frequently you and verbs whose subject may be either I or you with roughly equal frequency. There are also some other verbs that take a variety of subjects. The distribution of psychological verbs among these clusters is particularly interesting.
Cluster diagram showing proximity relationships among the 50 most frequently used verbs in the space of syntactic subjects.

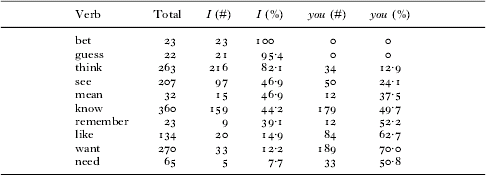
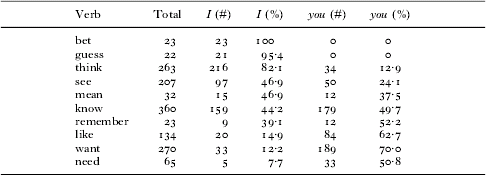
Table 3 compares psychological verbs with respect to their usage with I and you as subjects. Psychological verbs whose most common subject is I include bet (23 out of 23 uses with a subject, or 100%), guess (21/22, 95·4%) and think (216/263, 82·13%). Parents were not discussing their gambling habits with their children – bet was being used to indicate the epistemic status of a subsequent clause (how certain they were that it was true), as were the other verbs in this cluster. Psychological verbs whose most common subject is you include like (84 out of its 134 total uses with a subject, or 62·7%), want (189/270, 70·0%) and need (33/65, 50·8%). Parents are using these verbs to indicate the deontic status of a subsequent clause (the speaker's inclination, volition or compulsion with respect to the proposition expressed by the complement). Thus, it appears that, in the child's input, epistemic verbs are used with the subject I more frequently than with you, whereas deontic verbs are used with the subject you more often than with I. This makes ecological sense – in the developmental ecology, the parents are the ones who know things, and the children are the ones who need things. However, the psychological verbs that take I and you more or less equally as subject include not only mean (15 out of 32 uses, or 46·9%, with I and 12 of 32 uses, or 37·5%, with you) and remember (I: 9/23, 39·1%; you: 12/23, 52·2%) but also know (I: 150/360, 44·2%; you: 179/360, 49·7%).
Psychological verbs commonly used with subject I or you. For each verb, the table shows the total number of occurrences of that verb in the corpus sample described in the text, the total number of occurrences of that verb with the subject I, the percentage of total occurrences of that verb that were with the subject I, the total number of occurrences of that verb with the subject you, and the percentage of total occurrences of that verb that were with the subject you. Some of these verbs do not appear in Fig. 6 because, although they were used frequently with I or you, they were not among the 50 most frequent verbs overall
Log-likelihood ratio
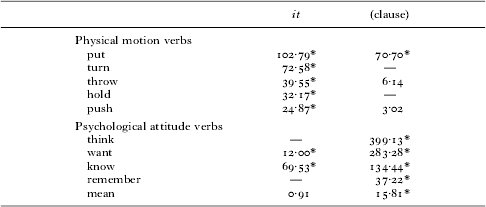
Raw frequencies, however, can be deceptive. A token frequency measurement does not account for pure chance (how likely is it that these clusters of verbs with particular kinds of objects would emerge by mere coincidence?), nor does it adjust for raw frequency (given that it is the most common object in the corpus sample, how likely is it that many verbs would occur most frequently with it?) or inverse frequency (even if it is frequently the object when put is the verb, is it also the case that put is frequently the verb when it is the object?). The log-likelihood ratio (LLR) between representative verbs and objects is a better measure than frequency. The LLR between two words A and B indicates how much more likely it is than would be expected by chance that B (an object, say) will occur in the same utterance as A (a verb), considering their overall frequencies.
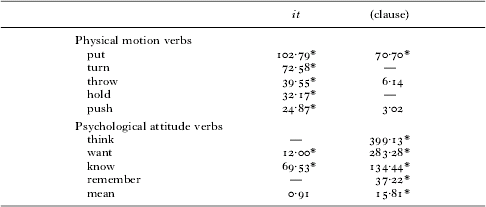
As shown in Table 4, the LLR analysis confirmed that it tended to occur with physical motion verbs far more often than would be predicted by chance, and that clauses occurred with most physical motion verbs, if at all, only about as much as would be predicted by chance. The verb put is an exception to this general rule, because it occurs with a clause (in utterances like I'll put what I think is reasonable) more often than would be predicted by chance. Conversely, as shown in Table 4, complement clauses tended to occur with psychological attitude verbs more often than would be predicted by chance, whereas it only occurred more often than would be predicted by chance with two of five psychological attitude verbs. The exceptions were want (uses such as Oh, I want it now) and know (No, that's wrong and you know it). Nevertheless, overall, it is somewhat more likely that a physical motion verb will occur with it than with a complement clause, and substantially more likely that a psychological attitude verb will occur with a complement clause than with it.
Log-likelihood ratios for uses of object it or a clause with physical motion verbs and psychological attitude verbs
* indicates p<0·01.
— indicates no co-occurrences.
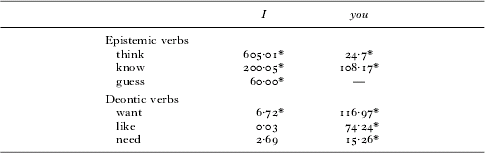
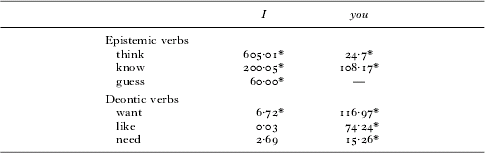
The LLR measure also demonstrates that I is significantly more likely to be the subject of epistemic verbs, including know, than you is. Conversely, you is more likely to be the subject of deontic verbs. As shown in Table 5, I occurred with epistemic verbs far more often than would be predicted by chance. The subject you also occurred more often with think and know than would be predicted by chance, but with a much lower likelihood than I. Note, in particular, that the LLR between I and know is nearly twice that between you and know, even though I and you appear as the subject of know with almost equal frequency. The subject I is a much better indicator that the verb could be know than is the subject you, taking their overall frequencies into account. That is, it is substantially more likely overall that the subject I will appear with an epistemic verb than it is that the subject you will appear with an epistemic verb. By contrast, as shown in Table 5, the subject you clearly tended to occur with deontic verbs far more often than chance would predict. The subject I was no more likely than chance would predict to appear with the verbs like and need and was only slightly more likely than chance to occur with the verb want. Overall, it is substantially more likely that the subject you will appear with a deontic verb than I will appear with a deontic verb. The high LLR between you and know is due to the frequency of fixed phrases such as You know? (and variants like Ya know? and Y'know?).
Log-likelihood ratios for uses of subject I or you with epistemic verbs and deontic verbs
* indicates p<0·01.
— indicates no co-occurrences.
There are many other significant co-occurrences in the corpus, some of which involve triadic correlations between specific verbs, specific nouns and pronouns. For example the objects book and story are more likely to appear with the verb read than would be predicted by chance (LLR=131·51, 128·39). Both the object book and the object this are likely to appear with the phrasal verb look at (LLR=67·28, 88·01). Similarly, not only is it likely to appear as the object of turn (as discussed above), but so is page (LLR=81·89). Likewise for play, which makes not only the objects ball, blocks, game and house more likely, but also the objects this and it. These are potentially important on several fronts. The child may learn an association between pronouns such as this and it and inanimate objects, like books and pages. Subsequently, the child may take co-occurrence of an unknown verb with the pronouns this and it as an indication that the unknown verb has a meaning similar to other verbs that take inanimate objects. Conversely, the verb tell selects strongly for the pronouns us and me as well as for Mommy and Daddy. Hence, the child may learn that verbs taking us and me as objects have to do with communicating with or directing attention toward other people.
DISCUSSION
Although pronouns are semantically ‘light’, their particular referents determinable only from context, they may nonetheless be potent forces on early lexical learning by identifying (statistically pointing to) some classes of verbs as being more likely than others. The results of Study 1 clearly show that there are statistical regularities in the co-occurrences of pronouns and verbs that the child could use to discriminate between broad classes of verbs. The verb clusters identified in Study 1 share more than their associations with pronouns – each cluster corresponds roughly to a broad class of verbs with similar semantic aspects.
Specifically, when followed by it, the verb is likely to describe physical motion, transfer or possession. When followed by a relatively complex complement clause, by contrast, the verb is likely to attribute a psychological state. Pronouns may also help learners partition verbs that express psychological attitudes toward events and states of affairs into two rough categories – on the one hand, verbs that express deontic status (need, want) and, on the other, verbs that express epistemic status (think, bet or guess). If the subject is I, the verb is likely to have to do with thinking or knowing, whereas if the subject is you, the verb is likely to have to do with needing or wanting. As discussed above, this regularity most likely reflects the ecology of parents and children – parents think and children need – but it could nonetheless help children distinguish these two classes of verbs. All this reinforces the potential value of examining the distributional relations among pronouns and verbs in language to young children.
STUDY 2
The main analysis included all utterances that had a verb and either a subject or an object, without excluding fixed phrases such as Thank you, You know or What gives? It also included verbs used in the second and third clauses of utterances such as Let's go in which the subject of the second verb is unclear. This is the most conservative approach – to consider all of the utterances children hear, without giving the analysis (or children) prior knowledge of stock phrases. Still, given this decision, the overall patterns reported above might somehow be due to the frequency of such highly frequent phrases. In addition, early reviewers of this research raised concerns about whether questions had been coded consistently. Accordingly, the analysis was repeated with a post-processed set of data.
METHOD
In the post-processing phase, a second group of three coders, none of whom contributed to the original coding, reviewed the codings of utterances coded as questions and utterances containing question words such as what. This resulted in changes to approximately 1·4% of codings, all of which the authors discussed and agreed upon. Again, only PCDS was included. In total, 24,290 PCDS utterances were coded. More than a third of the PCDS utterances (8,121/24,290=33·43%) contained no verb at all; these were excluded from further analysis, leaving 16,169 (=24,290–8,121) PCDS utterances with verbs. For the results reported here, only the first clause of each utterance was considered (16,169 clauses). As in Study 1, clauses that were questions (5,080/24,290=20·91% of total PCDS utterances), passives (3=0·01%) and copulas (2,731=11·24%) were also excluded from further analysis. The analysis was conducted using only clauses that were intransitives (3,065=12·62% of total PCDS utterances), transitives (5,009=20·62%) or ditransitives (281=1·16%), a total of 8,355 clauses. In this set of 8,355 clauses, there were 4,129 instances where a verb was used with a subject and 4,392 instances where a verb was used with an object. This may seem like a high rate of subject omission, but keeping in mind that the sample includes many imperatives, it is roughly in line with previous analyses of child-directed speech (e.g. Cameron-Faulkner et al., Reference Cameron-Faulkner, Lieven and Tomasello2003). From these sets, all utterances where the main verb was thank, know, let or let's were excluded, because parents frequently used those verbs in fixed phrases, and it would have been impractical to manually distinguish their uses in routines and fixed phrases from productive uses. This entailed excluding 306 verb-subject instances and 495 verb-object instances. Thus, 3,823 subject-verb uses and 3,897 verb-object uses were included in the second analysis.
RESULTS
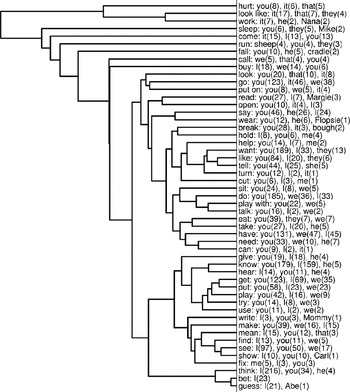
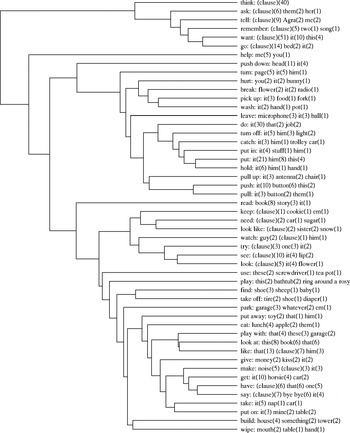
The results obtained with the post-processed data were essentially the same as those for the original data. The most frequent subjects and objects are still pronouns, by far. The clusters – and their associations with semantic aspects of the verbs in them – are, if anything, even clearer and more distinct than with the original data, as shown in Figures 7 and 8.
Cluster diagram showing proximity relationships among the 50 most frequently used verbs in the space of syntactic objects (including complement clauses as ‘(clause)’), from post-processed data.

Cluster diagram showing proximity relationships among the 50 most frequently used verbs in the space of syntactic subjects, from post-processed data.

STUDY 3
Studies 1 and 2 were based on a wide age range (1 ; 2–6 ; 9) that arose from an unbiased sample from CHILDES. Several other studies have shown changes in the nature of various aspects of CDS in accordance with changes in the child's linguistic ability, including changes in parents' use of pronouns in recasts of children's utterances (Sokolov, Reference Sokolov1993) and in mothers’ referential use of pronouns (Oshima-Takane & Derat, Reference Oshima-Takane and Derat1996). Hence, it appears possible that the patterns found in Studies 1 and 2 could be limited to only part of the wide age range that was studied. The fact that caregivers know and children need, for example, may change as the child attains more knowledge (and more interest in asserting that knowledge), and as the child is more capable of doing (or getting) things independently. Moreover it is unlikely that six-year-olds are still learning the core meanings or argument structures of the verbs under study here. Because the data used in Studies 1 and 2 was centered at 3 ; 0, there is every reason to expect that the deeper regularities found in those studies really exist at the ages at which children are learning many verbs – the amount of speech addressed to children younger than 2 ; 0 or older than 4 ; 0 was relatively small. Nevertheless, it is worthwhile to test that the regularities do exist in the speech addressed to children learning the frequent verbs at the focus of Studies 1 and 2. The purpose of Study 3 was to confirm that this was indeed true.
In order to restrict the analysis to the age range in which the relevant verbs are learned, it is necessary to determine what that age range is. Lexical development norms for ‘Action Words’ from the MacArthur-Bates Communicative Development Inventory (MCDI) (Dale & Fenson, Reference Dale and Fenson1996) were used to determine the relevant age range. The age at which a verb is typically learned may be estimated by considering its median comprehension age, defined here as the first month at which at least 50% of children in the normed MCDI data were reported to comprehend the verb. The MCDI Words and Gestures form (the ‘Infant Form’) measures both comprehension and production in children aged 0 ; 8–1 ; 4. Of the 55 verbs in the Action Words section of the Infant Form, 10 (mostly simple physical verbs like kiss, dance and hug) have a median comprehension age that is younger than the minimum target child age in the sampled data (1 ; 2). Speech addressed to the youngest children in the sampled data is therefore relevant to verb learning.
Determining the maximum relevant age is more difficult. Because Studies 1 and 2 suggest that pronouns might play a role in learning to distinguish psychological verbs from physical verbs, it is important to determine the ages at which children are learning psychological verbs as well as physical verbs. The MCDI Words and Sentences form (the ‘Toddler Form’), which is normed for children aged 1 ; 4–2 ; 6, contains a number of important psychological verbs, including like, think and wish. However, the Toddler Form is normed only for production, not comprehension.
The median comprehension age for verbs that appear only on the Toddler Form was estimated by, first, estimating the comprehension lag (the difference between the median production age from the Toddler Form and the median comprehension age from the Infant Form), and second, subtracting the estimated comprehension lag from the median production age of verbs that appear only on the Toddler Form. The comprehension lag is about nine months (N=35, M=8·83, SD=1·82). Median comprehension ages estimated by this method range as high as 2 ; 6 (for the verbs tear and think). Speech addressed to children as old as 2 ; 6 is therefore relevant to learning the verbs considered in Studies 1 and 2. This estimation procedure is not ideal, but it is reasonable given the normed lexical acquisition data that are currently available. Furthermore, the results are in accord with other evidence in the literature (e.g. Johnson & Maratsos, Reference Johnson and Maratsos1977), which suggests that children only begin to correctly understand psychological verbs like think and know in the second half of the third year.
METHOD
Study 3 used the same coded data as used in Study 2 but excluded data where the target child was older than 2 ; 6. All other procedures were the same.
RESULTS
The results of Study 3 were very similar to the results of Studies 1 and 2. The most common syntactic objects in parental speech addressed to children aged 1 ; 2–2 ; 6 are, besides complement clauses, it, that and you. The most frequent subjects are you, I and we. Of the top ten subjects, eight are pronouns. Of the top ten objects other than complement clauses, again eight are pronouns.
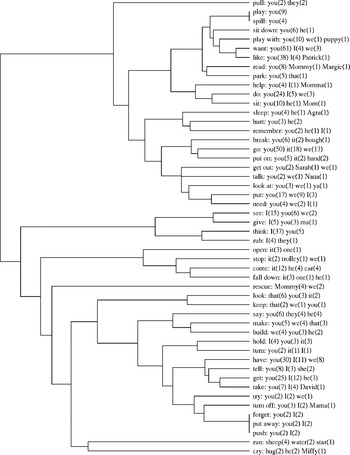
For the most part, the clusters – and their associations with semantic aspects of the verbs in them – are very similar to those obtained in Studies 1 and 2, as shown in Fig. 9 and Fig. 10. In Fig. 9, the psychological verbs think, remember and want cluster together in virtue of their frequent co-occurrence with complement clauses, whereas physical verbs such as put, push and pull cluster together in virtue of their frequent co-occurrence with the object it. On the other hand, the verbs need and like appear in a different cluster. In the case of like, this is because parents of children aged 1 ; 2–2 ; 6 used it most frequently with the object that rather than with a complement clause. This is presumably due to a simplification created by ‘motherese’. In the case of need, the sample for this age range includes only a few uses, two of which are uses with a complement clause. This is a danger of reducing the sample size – some regularities only emerge when the sample is large enough to capture them. It is also interesting that need and like could be considered specializations of the fundamental deontic verb want – whether the child wants something because she likes it or wants something because she needs it is a fine point that apparently does not concern parents too much in the younger years. In any case, as may be seen in Fig. 10, the deontic verbs want, like and need all cluster together in virtue of their uses with the subject pronoun you, whereas the epistemic verb think appears in a different cluster because it occurs most commonly with subject I.
Cluster diagram showing proximity relationships among the 50 most frequently used verbs in the space of syntactic objects (including complement clauses as ‘(clause)’), from post-processed data where target child is aged 1 ; 2–2 ; 6.

Cluster diagram showing proximity relationships among the 50 most frequently used verbs in the space of syntactic subjects, from post-processed data where the target child is aged 1 ; 2–2 ; 6.

STUDY 4
The results thus far show that there are regularities in the statistical relations between pronouns and verbs in speech addressed to children. However, they do not show that these regularities are learnable, nor that they have generalizable consequences that might give children a leg up in learning – that observing the kinds of subjects and objects with which an unknown verb is used, for example, might give the child a cue as to the broad meaning class of the unknown verb by activating known verbs with similar selectional preferences. The purpose of Study 4 was to demonstrate that a simple, mechanical statistical learning device could learn the regularities uncovered by Study 1 and generalize them in this manner.
To demonstrate that a simple statistical learner can actually exploit the regularities in pronoun–verb co-occurrences in parental speech to children, a simple connectionist network called an autoassociator was trained on the original corpus data. An autoassociator learns to reproduce each input pattern at the output. In the process, it compresses the pattern through a small set of hidden units in the middle, forcing the network to find the most important statistical regularities among the elements in the input data and allowing it to find global generalizations masked by local noise. In this case, the inputs (and thus the outputs) are lexical items in syntactic relations (subject, verb and object), with individual inputs presented in the same frequency as in parental speech to children. Thus, the regularities that the network can learn are the co-occurrences among surface lexical units.
The purpose of these simulations is to analyze the regularities in the corpus of parental speech – to discover the most potent statistical patterns. These kinds of simulations are particularly interesting because they do not just memorize the data, but also, when given just a piece of the input, fill in the missing part, revealing the higher-order regularities that form the basis of generalization. The goal here is not to provide a psychological model of the particular statistical learning mechanism that a child might use. Rather, the simulations assume only that some statistical learning mechanism compresses the data to find important regularities, learning lower- and higher-order patterns, and that it generalizes.
The analysis involves determining what regularities the network finds in the data, particularly whether, when given a pronoun frame, it can retrieve information about the missing verb. Given Study 1, some particularly important regularities are: (1) whether an unknown verb that occurs frequently with it as an object is likely to be a physical verb, whereas an unknown verb that occurs frequently with a complement clause is likely to be a psychological verb; and (2) whether an unknown psychological verb that occurs frequently with I as a subject is likely to be an epistemic verb, whereas one that occurs frequently with you as a subject is likely to be deontic.
METHOD
Data
The network training data consisted of the subject, verb and object of all the original coded utterances that contained the 50 most common subjects, verbs and objects. There were 5,835 such utterances. The inputs used a localist coding wherein there was exactly one input unit out of 50 activated for each subject, and likewise for each verb and each object. Absent and omitted arguments counted among the 50. For example, the utterance John runs had three units activated even though it has only two words – the third unit being the no object unit. Similarly, the utterance Get it had three units activated, including the no subject unit. This allows a direct comparison with Studies 1–3, which were based on data that contained not only canonical SVO utterances but also intransitive (SV) and subjectless (V and VO) utterances. With 50 units each for subject, verb and object, there were 150 input units to the network. Active input units had a value of one, and inactive input units had a value of zero.
Network architecture
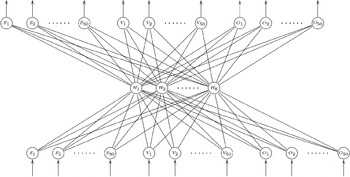
The network consisted of a two-layer 150–8–150 unit autoassociator with a logistic activation function at the hidden layer and three separate softmax activation functions (one each for the subject, verb and object) at the output layer – see Fig. 11. Using the softmax activation function, which ensures that all the outputs in the bank sum to 1, together with the cross-entropy error measure, allows interpreting the network outputs as probabilities (Bishop, Reference Bishop1995). The network was trained by backpropagation to map its inputs back onto its outputs. It is well known that this sort of network performs non-linear dimensionality reduction at its hidden layers, extracting statistical regularities from the input data. The hidden layer contained eight units, based on pilot runs that varied the number of hidden units. Networks with fewer hidden units either did not learn the problem sufficiently well or took a long time to converge, whereas networks with more than about eight hidden units learned quickly but tended to overfit the data.
Network architecture.

Training
The data was randomly assigned to two groups: 90% of the data was used for training the network, while 10% was reserved for validating the network's performance. Starting from different random initial weights, ten networks were trained until the cross-entropy on the validation set reached a minimum for each of them. (Using multiple networks ensures that the results are not idiosyncratic to a single set of initial weights potentially stuck in a local minimum – the different networks are analogous to different subjects in an experiment.) Training stopped after approximately 150 epochs of training, on average. At that point, the networks were achieving about 81% accuracy on correctly identifying subjects, verbs and objects from the training set. Further training could have achieved near perfect accuracy on the training set, with some loss of generalization, but it is better to avoid overfitting.
Testing
To test generalization, the networks were presented with incomplete utterances to see how well they would ‘fill in the blanks’ when given only a pronoun or only a verb. That is, after training, the networks were tested with incomplete inputs corresponding to isolated verbs and pronoun frames. For example, to see what a network had learned about it as a subject, the network was tested with a single input unit activated – the one corresponding to it as subject. The other input units were set to zero. Output unit activations were recorded and averaged over all ten networks. Once a network has learned the regularities inherent in a corpus of complete PCDS utterances, testing it on incomplete utterances (e.g., ‘ … it’ and ‘I …’) allows examining what it has gleaned about the relationship between the given parts (subjects and objects) and the missing parts (verbs).
RESULTS
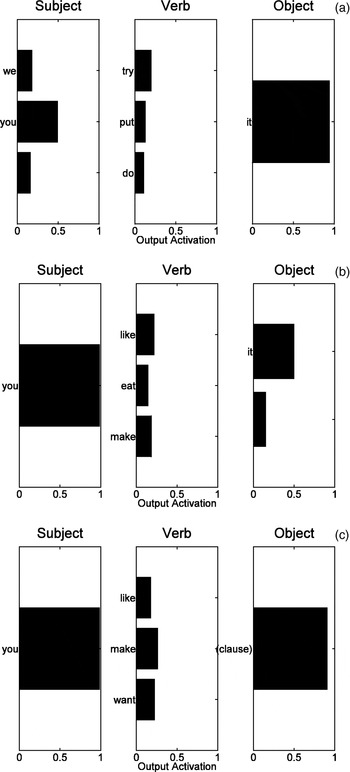
The networks learn many of the simple co-occurrence regularities observed in the data, but they also demonstrate certain higher-order co-occurrences not detected by the first-order analysis reported in Studies 1–3. For example, when tested on the object it (Fig. 12a), the most activated verbs are try, put and do. Both put and do are among the verbs most frequently associated with object it in the input (Table 1), but try is not. However, Fig. 12a shows that the subject you has also been associated with the object it, and Fig. 6 shows that try is most frequently used with subject you. The network has learned a higher-order generalization: if the object is it, then it is likely that the subject is you and, when the frame is You … it, then it is likely that the verb is try. This is actually a coarse description of a nuanced performance, because the network is not doing step-by-step conditional reasoning and also takes into consideration the likelihood that the subject is we or null, as well as the combined inverse likelihoods (e.g. given that the verb is try, put or do, what is the most likely object?). Perhaps a better way to describe the generalization the network is expressing is this: given that the object in a clause from PCDS is very likely it, then the subject is most likely you but could be we or null, and the verb is likely to be try, put or do.
Mean network output responses (a) to the object it; (b) to the subject you; and (c) to the subject you and the object ‘(clause)’ simultaneously. Responses from subject units are shown in the left column, those from verbs in the middle, and those from objects on the right. Within each syntactic category, output units are ordered according to the frequency of the corresponding words in the input (lower bars correspond to higher frequency words). The length of each bar reflects the average activation of the corresponding unit in the networks. Activations across all 50 output units for each syntactic category always sum to one; for legibility, only the most highly activated units are shown in the diagram.

To consider another example, the verbs most activated by the subject you are like, make and eat (Fig. 12b). All three are indeed used most frequently with subject you (Fig. 6), but so are many other verbs. However, note that the network also draws the conclusion that the object is likely to be it. Thus, a coarse way of describing the network's generalization in this case would be: given that the subject in a PCDS clause is very likely you, then the object is most likely to be it but could also be null and the verb is likely to be like, make or eat.
Another aspect of the network's generalizations may be observed when it is prompted simultaneously with a subject and an object, for example you as the subject and ‘(clause)’ as the object (Fig. 12c). In that case, the network deduces that the most likely verbs are make, want and like. Although this test of a ‘triadic structure’ goes beyond the analysis in Studies 1–3, it does give rise to an interesting generalization. A simple way to state this generalization would be: given that the subject of a PCDS utterance is very likely you and that the object of the same utterance is very likely a clause, then the most likely verbs are make, want or like. All three verbs are among those most likely to co-occur with a clause (Table 2) and all three are also among those most likely to co-occur with subject you (Fig. 6).
This demonstrates that the network model is sensitive to high-order correlations among words in the input, not merely the first-order correlations between pronoun and verb occurrences. At the same time, the networks are sensitive to the simpler first-order generalizations discovered in Study 1. For example, to test the hypothesis that the networks learn that psychological attitude verbs are more likely than physical motion verbs to take a clause as an object, they were tested with the frames ‘I … (clause)’ and ‘You … (clause)’ using psychological and physical verbs. The psychological verbs were think, want, know and remember. (The verb mean, although listed in Table 4, was not among the top 50 verbs used in the corpus and therefore was not used in the network training.) The physical verbs were put, turn, throw and hold. (Here again, one of the verbs considered in Study 1 – push – was not among the top 50 verbs used in the corpus and therefore was not used in the network training.) The networks activated psychological verbs more strongly at the output (M=0·047, SD=0·152) than the physical verbs (M=0·002, SD=0·014). This order-of-magnitude difference at the outputs was significant across different networks (t(80)=2·62, p=0·01, d=0·4). Results are similar for the converse (on average, physical verbs are significantly more activated when the object is it) and for the epistemic/deontic distinction (on average, epistemic verbs are significantly more activated when the subject is I, whereas deontic verbs are significantly more activated when the subject is you).
The means reported for the network simulation study above may seem low to a psychologist accustomed to experimental data from children. However, we must consider that the measurement for each subject (network) was activation over 50 trials (each of 50 output nodes, one for each verb). The network architecture (in particular, the softmax function at each output unit) constrained the measurements across all 50 trials for each subject to sum to 1·0. (One might imagine a survey that asks adults to rate 50 items by allocating a total of, say, 100 points among them.) Therefore, the chance value (the value we would expect if our subjects were completely unbiased, that is, did not prefer any verb to any other) on every trial would be 1/50, or 0·02. The empirical values are reliably different from chance. Furthermore, the test verbs for the physical and psychological classes were chosen prior to the network simulation, by virtue of the fact that they were the most frequent verbs of those types in the input. In fact, other psychological verbs and verbs of communication (e.g. like, hear, see, say) were among the verbs most highly activated at the network outputs, and other physical verbs (e.g. open, break, build, touch) were among the least highly activated. Finally, the networks also activated highly common ‘light’ verbs (e.g. do, go, get) to some degree, reflecting the fact that these are very frequent in the input. Although the networks are sensitive to the subtle physical/psychological distinction for which we tested them, they do not ignore (nor should they) the more obvious regularities in the data. The statistical regularities here may be subtle, but they are without a doubt sufficiently large to be reliably discriminated by downstream processing in a neural network and therefore, in principle, by a child.
Study 4 shows that a network model finds roughly the same regularities in the corpus data that the statistical techniques used in Study 1 find, and therefore that some equally simple statistical learning machine could be part of a mechanism for learning the meanings of new verbs. These results do not depend on using an autoassociation network, nor do they imply that children actually use an autoassociation architecture to learn language. Any statistical learner that is able to discover both first- and higher-order correlations will produce results similar to the ones shown here. An autoassociator is merely a simple means of demonstrating in principle that a mechanical learner can extract the same regularities from the data that were found in Study 1.
CONCLUSIONS
Study 1 showed that there are statistical regularities in lexical co-occurrences between pronouns and verbs in the speech that children hear from their parents. It also demonstrated that these lexical regularities correspond to certain broad semantic regularities, including regularities that distinguish between psychological and non-psychological verbs, as well as between deontic and epistemic psychological verbs. Studies 2 and 3 demonstrated that these regularities are not artifacts due to the inclusion of fixed phrases or the use of a wide age range. Study 4 demonstrated that a simple statistical machine could learn these regularities, including subtle higher-order regularities that are not obvious in a first-order analysis of the input data. The network does not learn the meanings of verbs per se. Rather, it learns the formal associations between lexical tokens of verbs and pronouns, and it can use these regularities to predict the verb in an incomplete sentence.
Taken together, these results demonstrate that regularities that could be helpful for learning verbs are present in the child's input, and that the regularities are learnable in principle. Although not definitive by any means, these results contribute to the growing body of evidence that general-purpose statistical learning mechanisms operating on the evidence available in the child's environment are sufficient for language acquisition. Admittedly, the results presented here do not demonstrate acquisition of as ‘deep’ a regularity as the complex generalizations that Crain & Pietroski (Reference Crain and Pietroski2002) argue can only be stated in terms of the highly abstract syntactic notion of c-command. Nevertheless, by showing that lexical correlations may reflect semantic correlations, this paper adds to the converging evidence that working ‘bottom-up’ from the data may eventually be sufficient to explain the phenomenon of language acquisition. Because this paper has taken the word as the fundamental unit for statistical analysis, it also does not directly address Yang's (Reference Yang2004) argument that, because there are an infinite range of possible statistical correlations in the environmental input, infants must be innately predisposed to use the right ones. Here again, however, the paper adds to the accumulating evidence that infants may begin by correlating many aspects of their environmental input, likely weighted by salience, and gradually weed out those that are uninformative. The informative correlations then become units upon which higher-order correlations may be built. A single paper cannot resolve this dispute – it remains to be seen whether the growing evidence for statistical learning across many levels will ultimately be sufficient to explain language acquisition without an innate, domain-specific language acquisition device.
How could learning these co-occurrences help the child learn the meanings of verbs? In the first place, hearing a verb framed by pronouns may help the child isolate the verb itself – having simple, short, consistent and high frequency slot fillers could make it that much easier to segment the relevant word in frames like He … it. That is, pronouns may ‘highlight’ verbs by consistently bracketing them with simple, frequent markers, making it easier to segment them from the speech stream.
Second, the information provided by the particular pronouns used in a given utterance might help the child isolate the relevant event or action from the blooming, buzzing confusion around her. In English, pronouns can indicate animacy, gender and number, and their order can indicate temporal or causal direction or sequence (e.g. You … it versus It … you). In other words, which pronouns are used may indicate the animacy, gender and number of the participants in the action or event that an utterance describes, and their order may further indicate temporal sequence or causal direction. This could help the child to focus on the relevant meanings.
Finally, one set of verb–pronoun co-occurrences may lead to another. Once the child has learned at least one verb and its pattern of correlations with pronouns, when she hears another verb used with the same or a similar pattern of correlations, she may hypothesize that the unknown verb is semantically similar to the known verb. The network model learned and exploited precisely these patterns to make informed guesses about which words might be missing in an incomplete utterance, and so, potentially, could a child. For example, a learner who understood want but not need might observe that you is usually the subject of both and conclude that want, like need, has to do with her desires and not, for example, a physical motion or someone else's state of mind. The pronoun–verb co-occurrences in the input may thus help the child narrow down the class to which an unknown verb belongs, allowing the learner to focus on further refining her grasp of the verb through subsequent exposures. In a sense, this is what the networks do – they predict the most likely missing verb based on co-occurrences with pronouns and high-frequency nouns. This is compatible with the view that pronouns may form the fixed element in lexically-specific frames (e.g. Pine & Lieven, Reference Pine and Lieven1993; Childers & Tomasello, Reference Childers and Tomasello2001), but it also suggests the somewhat subtler hypothesis that the relations between pronouns and verbs (as well as frames) may be graded and probabilistic. If this hypothesis turns out to be correct in children, then it would provide further evidence for the already well-documented phenomenon that both children and adults use intra-linguistic cues, including utterance structure, to help learn the meanings of verbs (e.g. Gleitman, Reference Gleitman1990). It would also support the notion (e.g. Gentner, Reference Gentner, Stan and Kuczaj1982) that children learn verbs, whose referents are often not directly accessible from observation alone, in part by tracking their uses with known nouns.
Given that the regularities exist and are learnable in principle, the next logical question is whether children actually pick up on these regularities – whether these particular statistical regularities really matter in language acquisition. There are two levels to these patterns – surface properties (such as lexical co-occurrences) and the deeper regularities they point to (such as semantic similarities or verb classes). As noted in the Introduction, a learner may pick up on surface regularities that are short, salient and frequent, but there is no point to learning only the surface regularities – they are really only of value if they point to deeper meanings. The purpose of most learning, especially language learning, is not merely to spit back the input but to find deeper regularities that can be used generatively. The simulation reported in this paper is not in itself a solution to this problem, but it does demonstrate that simple surface regularities such as lexical co-occurrences can point to semantic similarities that can further be bound to and grounded in children's own activities and goals.
One might predict that, to the extent that children attend to the lexical regularities described in this paper, they should, at a minimum, use pronouns and verbs together with roughly the same frequencies and co-occurrence patterns that they hear in their parents' speech to them. However, merely reproducing some aspects of the surface regularities would not make sense in the ecology of parent and child, where the adult is the ‘knower’ and the child is the ‘wanter’. Whereas the adult says I know and you want, the child who has actually found her way to the deeper semantic regularities should initially use verbs such as know and believe primarily to talk about others, especially parents (you), and use those such as want and need to talk about herself (I). This regularity has in fact been reported in children's speech (Bloom, Reference Bloom1993).
Another way to assess these ideas experimentally is to use tasks other than production. To the extent that pronoun–verb co-occurrences contribute to verb learning, children's comprehension of ordinary verbs should be better when they are used in frames that are consistent with the regularities in the input than when they are used in frames that are inconsistent with those regularities. Thus, a further step would be to show that children can and do actually use these regularities to comprehend known verbs. An additional empirical prediction follows: children should also be better able to generalize comprehension of novel verbs when they are presented in frames consistent with these regularities.
The analysis of the input and the simulation study reported here necessarily focused on certain surface regularities (lexical co-occurrences between verbs, subject nouns and object nouns) to the exclusion of others, as all such simulations and analyses must. One can only discover the kinds of regularities one looks for, of course. There are surely many other statistical patterns in the data, and thus other patterns might be found by examining other features or relations. Moreover, some of these other regularities (including referential co-occurrences, phonotactic co-occurrences and co-occurrences among function words) are undoubtedly worth attending to. Nonetheless, merely examining a small portion of the space of possible surface-level regularities turns up patterns corresponding to higher-order categories that should be useful to a learner. Large-scale computational corpus studies like those presented here will therefore continue to be valuable hypothesis-generating tools for research into language acquisition.
It is important to acknowledge that this paper focuses exclusively on parental child-directed speech. However, some children learn language in cultures where parents do not address them directly until they already speak (Lieven, Reference Lieven, Gallaway and Richards1994). Even in Western cultures, less than 20 percent of the speech that children hear is addressed to them (van de Weijer, Reference van de Weijer2001), and it has been suggested that overheard speech plays a particularly important role in learning to use pronouns correctly (e.g. Oshima-Takane, Reference Oshima-Takane1988). All this suggests that the non-PCDS that children hear may play a powerful role in language acquisition. The extent to which the regularities found in this study also exist in overheard speech to children of relevant ages remains a topic for future research.
In this paper, the tools of computational linguistics and machine learning were used to discover some regularities in the input and suggest some ways in which they might be usable. These tools are applicable to a wide array of fascinating questions related directly and indirectly to the research reported in this paper. An obvious next step, currently under investigation, is to examine the overall distribution of pronouns in child-directed speech. The analysis reported in this paper focuses on pronouns that are arguments to verbs. Pronouns also appear in many other places in CDS, so an analysis of the relative frequency of pronouns immediately before and after verbs in CDS, as opposed to in other positions, would help determine how good a cue pronouns might be for learning about verbs. It would also be interesting to examine whether and how the regularities in parental speech change as children grow up. With an even larger sample than used in the current studies, a developmental analysis would be possible.
Another interesting question for further exploration is whether pronouns play an especially important role in English. Different kinds of surface patterns may be critical to learning ‘verb heavy’ languages like Japanese and Tamil. Indeed, even for English, it is a very interesting question how children use cues from actual speech, which does not consistently express the argument structures that linguists have argued are core properties of verbs (e.g. Levin, Reference Levin1993), in order to learn language.
Large-scale computational assays of the input like the one described in this paper provide a novel and powerful means of examining what children hear and say. However, some of the patterns that may be found by such means – such as the differential use of I and you – are surely specific to parental speech to children. Merely calculating statistics over large sets of input data is not sufficient for advancing the state of knowledge about language acquisition – the developmental psychologist's sensitivity to the ecology of the language-learning environment will always play an essential role in this enterprise.