Introduction
Perovskite chalcogenides have been gaining increased attention as a class of emerging semiconductors with rich tunability and excellent optoelectronic properties in the visible to infrared spectrum [Reference Sun, Agiorgousis, Zhang and Zhang1, Reference Wang, Gou and Li2, Reference Kuhar, Crovetto, Pandey, Thygesen, Seger, Vesborg, Hansen, Chorkendorff and Jacobsen3, Reference Ju, Dai, Ma and Zeng4, Reference Niu, Joe, Zhao, Zhou, Orvis, Huyan, Salman, Mahalingam, Urwin, Wu, Liu, Tiwald, Cronin, Howe, Mecklenburg, Haiges, Singh, Wang, Kats and Ravichandran5, Reference Niu, Sarkar, Williams, Zhou, Li, Bianco, Huyan, Cronin, McConney, Haiges, Jaramillo, Singh, Tisdale, Kapadia and Ravichandran6, Reference Filippone, Sun and Jaramillo7, Reference Niu, Zhao, Zhou, Huyan, Zhao, Wu, Cronin, Wang and Ravichandran8, Reference Hanzawa, Iimura, Hiramatsu and Hosono9, Reference Swarnkar, Mir, Chakraborty, Jagadeeswararao, Sheikh and Nag10]. Perovskite chalcogenides can be viewed as the inorganic alternative to hybrid organic–inorganic halide perovskites, with a stable, benign, abundant composition, and ultrahigh absorption coefficients. On the other hand, perovskite chalcogenides can also be viewed as the chalcogenide counterparts of perovskite oxides, with a much lower band gap and improved response to visible and infrared light [Reference Sun, Agiorgousis, Zhang and Zhang1, Reference Bennett, Grinberg and Rappe11]. The combination of ultrahigh absorption coefficient and predicted high carrier mobility, along with tunable band gap, good thermal and aqueous stability, and benign, earth-abundant composition, creates opportunities for a broad range of photonic, optoelectronic, and energy applications, including solar cells [Reference Sun, Agiorgousis, Zhang and Zhang1, Reference Wang, Gou and Li2, Reference Ju, Dai, Ma and Zeng4, Reference Niu, Sarkar, Williams, Zhou, Li, Bianco, Huyan, Cronin, McConney, Haiges, Jaramillo, Singh, Tisdale, Kapadia and Ravichandran6], photodetectors [Reference Niu, Joe, Zhao, Zhou, Orvis, Huyan, Salman, Mahalingam, Urwin, Wu, Liu, Tiwald, Cronin, Howe, Mecklenburg, Haiges, Singh, Wang, Kats and Ravichandran5, Reference Niu, Zhao, Zhou, Huyan, Zhao, Wu, Cronin, Wang and Ravichandran8, Reference Swarnkar, Mir, Chakraborty, Jagadeeswararao, Sheikh and Nag10], lighting devices [Reference Hanzawa, Iimura, Hiramatsu and Hosono9], and photoelectrochemical devices [Reference Kuhar, Crovetto, Pandey, Thygesen, Seger, Vesborg, Hansen, Chorkendorff and Jacobsen3].
These materials were known to exist for a long time, and the synthetic efforts can date back to over half a century ago [Reference Hahn and Mutschke12, Reference Clearfield13, Reference Lelieveld and Ijdo14, Reference Huster15]. Synthetic methods of ceramic samples include heating a binary sulfide mixture for several weeks [Reference Lee, Kleinke and Kleinke16], sulfurization of corresponding oxides with CS2 [Reference Clearfield13, Reference Okai, Takahashi, Saeki and Yoshimoto17] or H2S [Reference Lelieveld and Ijdo14], and solid-state reaction with catalytic addition of iodine [Reference Niu, Huyan, Liu, Yeung, Ye, Blankemeier, Orvis, Sarkar, Singh, Kapadia and Ravichandran18]. Crystal growth efforts have been reported for perovskite-related Ruddlesden–Popper (RP) phases [Reference Hung, Fettinger and Eichhorn19, Reference Chen, Eichhorn and Wong-Ng20, Reference Chen, Wong-Ng and Eichhorn21] and hexagonal phases [Reference Huster15]. However, most reports on perovskite chalcogenides were limited to the structural studies of polycrystalline samples. Recently, these materials were rediscovered and explored as a class of semiconductors for optoelectronic applications. Experimental explorations of relevant physical properties started on the prototypical perovskite chalcogenide BaZrS3 [Reference Niu, Huyan, Liu, Yeung, Ye, Blankemeier, Orvis, Sarkar, Singh, Kapadia and Ravichandran18, Reference Meng, Saparov, Hong, Wang, Mitzi and Yan22, Reference Perera, Hui, Zhao, Xue, Sun, Deng, Gross, Milleville, Xu, Watson, Weinstein, Sun, Zhang and Zeng23, Reference Gross, Sun, Perera, Hui, Wei, Zhang, Zeng and Weinstein24, Reference Niu, Milam-Guerrero, Zhou, Ye, Zhao, Melot and Ravichandran25]. Synthesis of high-quality samples is of vital importance in such explorations. Meng et al. [Reference Meng, Saparov, Hong, Wang, Mitzi and Yan22] synthesized BaZrS3 by conventional solid–state reaction of binary mixtures with repeated annealing. Perera et al. [Reference Perera, Hui, Zhao, Xue, Sun, Deng, Gross, Milleville, Xu, Watson, Weinstein, Sun, Zhang and Zeng23] synthesized BaZrS3 by high-temperature sulfurization of oxides with CS2. We have demonstrated the synthesis of BaZrS3 with catalytic addition of iodine in a solid-state reaction to enable a one-shot synthesis with much shorter time [Reference Niu, Huyan, Liu, Yeung, Ye, Blankemeier, Orvis, Sarkar, Singh, Kapadia and Ravichandran18]. However, growth of single crystals for BaZrS3 is yet to be demonstrated, which is critical to study the intrinsic optical properties of this model perovskite chalcogenide material. In this work, we will report the crystal growth of BaZrS3, along with its n = 2 Ruddlesden–Popper phase Ba3Zr2S7.
Results and discussion
Crystal growth and morphology
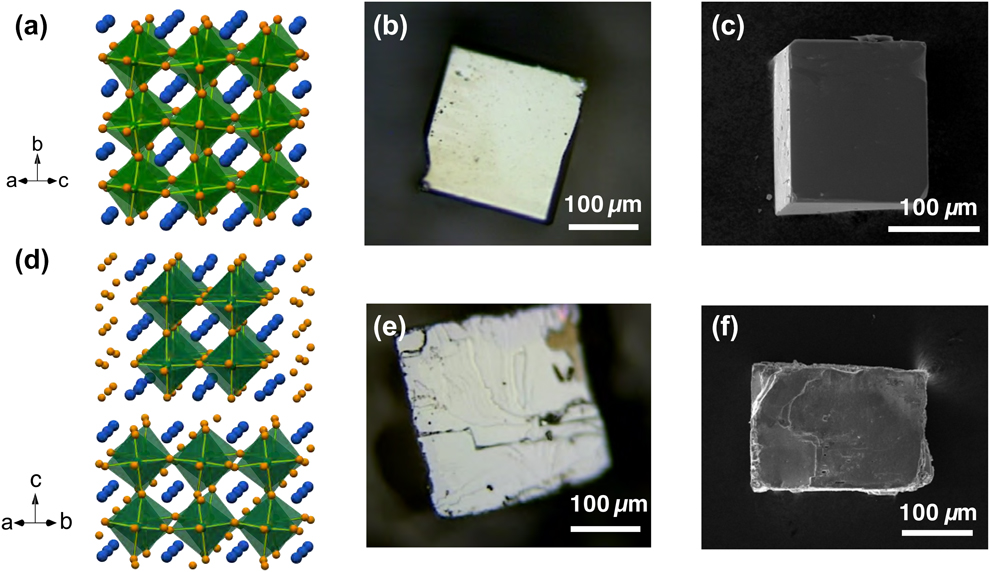
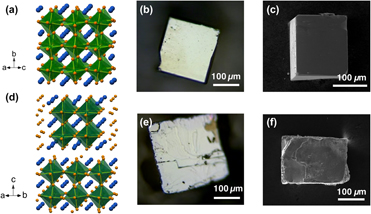
Single crystals were grown using the salt flux method with BaCl2 flux. We have also tried growing these crystals with other salts such as KI and BaCl2/MgCl2 eutectic. The results were similar, and the salt removing process was notably easier, but the obtained crystals were not as large. In the case of BaZrS3, the predominant morphology of the obtained crystals was cube-like with sharp edges and well-defined surfaces that correspond to crystal facets, as shown in the images in Figs. 1(b) and 1(c). The obtained BaZrS3 crystals were up to 500 μm in size and showed shiny/reflective metallic luster when observed at normal incidence. In the case of RP phases, the attempt for single-phase crystal growth by varying the stoichiometry of precursors was not successful. Salt flux growth is a slow process, and the energy barriers to get across RP phase boundaries are presumably shallow as they possess similar chemistry and structure. As a result, obtained crystallites were a mixture of the RP phases, with the relative yield affected by the starting stoichiometry. For Ba3Zr2S7, the predominant crystal morphology was square platelets, with a similar shiny metallic luster on the surface. However, when looked under a microscope, the top platelet crystal facets are not as well defined and show layer-like terraces on the surfaces, as shown in Figs. 1(e) and 1(f), presumably due to the stacking of perovskite slabs and rock-salt layers along the c axis. The isolated Ba3Zr2S7 crystal pieces were up to 300 μm in size. A small amount of Ba4Zr3S10 crystallites were also found in certain cases. However, the efforts to consistently grow large Ba4Zr3S10 crystals were not successful.
Schematic crystal structure for (a) BaZrS3 and (d) Ba3Zr2S7. The blue, orange, and green spheres represent Ba, S, and Zr, respectively. The ZrS6 octahedra are highlighted. Optical pictures of (b) BaZrS3 and (e) Ba3Zr2S7 crystals. SEM images of (c) BaZrS3 and (f) Ba3Zr2S7 crystals.

Crystal structure of BaZrS3
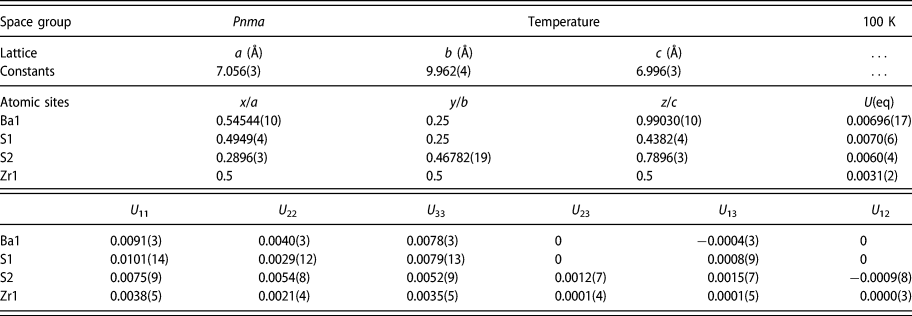
We have performed single-crystal X-ray diffraction analysis for the crystals. We observed twinning in the BaZrS3 crystals and had to break the crystals into smaller pieces to obtain a reasonable solution to the diffraction analysis. A lustrous dark red plate-like specimen of BaZrS3, approximate dimensions 0.005 × 0.008 × 0.008 mm, was used for the X-ray crystallographic analysis. The measurement was performed using Mo Kα radiation at 100 K. Integration of the data using an orthorhombic unit cell yielded a total of 4218 reflections to a maximum θ angle of 30.54° (0.70 Å resolution), of which 798 were independent (average redundancy 5.286, completeness = 94.8%, R int = 5.33%, R sig = 4.55%) and 623 (78.07%) were greater than 2σ(F 2). The final cell constants of a = 7.056(3) Å, b = 9.962(4) Å, c = 6.996(3) Å, and volume = 491.8(3) Å3 are based upon the refinement of the XYZ centroids of 1919 reflections above 20σ(I) with 9.169° < 2θ < 60.88°. Data were corrected for absorption effects using the multi-scan method (SADABS). The ratio of minimum to maximum apparent transmission was 0.764. The calculated minimum and maximum transmission coefficients (based on crystal size) are 0.7310 and 0.8970. The structure was solved and refined using the space group Pnma, with Z = 4 for the formula unit, BaZrS3. The final anisotropic full-matrix least-squares refinement on F 2 with 29 variables converged at R 1 = 3.36% for the observed data and wR 2 = 7.57% for all data. The goodness-of-fit was 1.162. The largest peak in the final difference electron density synthesis was 1.804 e−/Å3 and the largest hole was −1.788 e−/Å3 with a root-mean-square deviation of 0.356 e−/Å3. On the basis of the final model, the calculated density was 4.386 g/cm3 and F(000), 576 e−.
The detailed structural parameters are shown in Table I. Based on these parameters, schematic crystal structures were constructed, as shown in Fig. 1(a). BaZrS3 is isostructural with GdFeO3 and adopts the distorted perovskite structure with a space group of Pnma, which agrees well with previous polycrystalline studies [Reference Clearfield13, Reference Lelieveld and Ijdo14, Reference Niu, Huyan, Liu, Yeung, Ye, Blankemeier, Orvis, Sarkar, Singh, Kapadia and Ravichandran18]. The octahedra share corners to form a three-dimensional network. This structure differs from the ideal cubic perovskite in several ways. If we consider a “pseudo-cubic” structure with three axes pointing along the directions the octahedra are connecting corners, while the b axis of the orthorhombic cell is aligned with one of the directions, a and c axes are close to the face diagonals of the other two pseudo-cubic axes. The pseudo-cubic cell constant, or effectively the spacing between octahedra, is 4.968 Å along [101] and  $\left[ {10\bar{1}} \right]$ directions, and 4.981 Å along the [010] direction in BaZrS3. Thus, to grow high-quality epitaxial films of BaZrS3, one can use substrates with a square symmetry and lattice constants of around 4.97 Å for commensurate epitaxy or around 3.51 Å for incommensurate epitaxy.
Space group, lattice constants, atomic coordinates, equivalent isotropic atomic displacement parameters (Å2), and anisotropic atomic displacement parameters (Å2) from X-ray crystallographic analysis for BaZrS3.

Octahedra tilting in BaZrS3
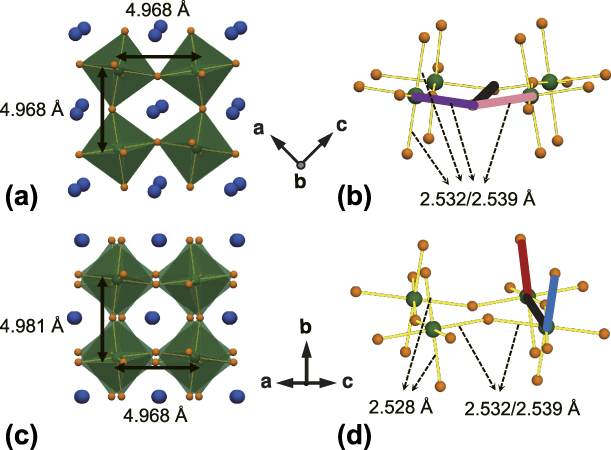
One key feature in BaZrS3 crystal structure is the tilting of ZrS6 octahedra. The tilting along the b axis is in phase, with adjacent octahedral layers in the ac plane rotating toward the same direction and remaining perfectly overlapped when viewed along the b axis, as shown in Fig. 2(a). The tilting along [101] and  $\left[ {10\bar{1}} \right]$ directions are out of phase, with adjacent octahedra layers twisted in opposite directions, as shown in Fig. 2(c). The tilting amplitude can be calculated by analyzing the torsion angle of the Zr–S bonds. For in-phase tilt, the tilting angle is half of the difference between 180° and the Zr–S–S–Zr torsion angle linking the octahedra in the same layer, as shown in Fig. 2(b). For out-of-phase tilt, the tilting angle is half of the S–Zr–Zr–S torsion angle linking the octahedra in two adjacent layers, as shown in Fig. 2(d). The extracted tilting angles along [101] and
 $\left[ {10\bar{1}} \right]$ directions are the same, −7.027° (negative denoting out-of-phase tilt), while the tilting angle along [010] is 9.0005° (positive denoting in-phase tilt). The obtained results show that BaZrS3 adopts a Glazer tilting system of a −b +a − (or standardized a +b −b −) [Reference Woodward26]. It is worth noting that although Zr is sitting in the center of ZrS6 octahedra, the octahedra are slightly distorted, with three pairs of Zr–S bonds having bond lengths of 2.532 Å, 2.539 Å, and 2.528 Å. The shortest pair of bonds are along [010], while the octahedra with pairs of 2.532 Å and 2.539 Å Zr–S bonds are alternated along [101] and
 $\left[ {10\bar{1}} \right]$. If we compare [010] to [101]/
 $\left[ {10\bar{1}} \right]$, the shorter Zr–S bonds (2.528 Å compared to 2.532 Å and 2.539 Å) and larger octahedra (Zr–Zr) spacing (4.981 Å compared to 4.968 Å) are enabled by a larger Zr–S–Zr bond angle (160.236° compared to 156.905°) due to the larger octahedra tilting amplitude around [010] (9.0005° compared to 7.027°). The in-phase tilting around the b axis also results in the net displacement of S atoms, and consequently displacement of Ba atoms in the ac plane.
(a) Schematic structure viewed along the b axis in BaZrS3 shows the in-phase tilt where the tilting of adjacent octahedra layers is overlapping. (b) Ball-stick model in perspective view showing the Zr–S–S–Zr torsion angle (purple–black–pink) to calculate the in-phase tilting angle. (c) Schematic structure viewed along the (101) direction in BaZrS3 shows the out-of-phase tilt where the tilting of adjacent layers is in the opposite direction. (d) Ball-stick model in perspective view showing the S–Zr–Zr–S torsion angle (blue–black–red) to calculate the out-of-phase tilting angle. The octahedra spacing (Zr–Zr distance) and octahedra shape (Zr–S bond length) along different directions are marked in the schematics.

Crystal structure of Ba3Zr2S7
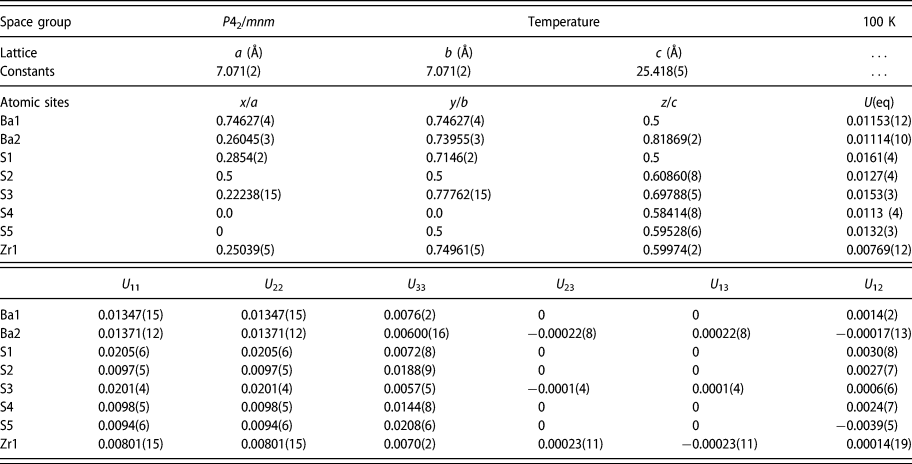
For Ba3Zr2S7, previous studies identified several possible structural variants, I4/mmm [Reference Chen, Eichhorn and Wong-Ng20], P42/mnm [Reference Hung, Fettinger and Eichhorn19], and Cccm [Reference Saeki, Yajima and Onoda27]. We performed single-crystal X-ray diffraction (XRD) studies on the grown crystals at 100 K and found that the crystals adopted the P42/mnm space group as shown in Table II. A dark red prism-like piece of Ba3Zr2S7 crystal, approximate dimensions of 0.056 × 0.086 × 0.118 mm, was used for the X-ray crystallographic analysis in the same set-up. Integration of the data using a tetragonal unit cell yielded a total of 29,151 reflections to a maximum θ angle of 28.32° (0.75 Å resolution), of which 898 were independent (average redundancy 28.762, completeness = 99.7%, R int = 4.3%, and R sig = 1.14%) and 743 (82.74%) were greater than 2σ(F 2). The structure was solved and refined using the space group P42/mnm, with Z = 4 for the formula unit, Ba3Zr2S7. The final cell constants of a = 7.071(2) Å, b = 7.071(2) Å, c = 25.418(5) Å, α = 90°, β = 90°, γ = 90°, and volume = 1270.9(8) Å3 are based upon the refinement of the XYZ centroids of 6657 reflections above 20σ(I), with 6.412° < 2θ < 56.35°. Data were also corrected for absorption effects. The ratio of minimum to maximum apparent transmission was 0.724. The final anisotropic full-matrix least-squares refinement on F 2 with 40 variables converged at R 1 = 2.15% for the observed data and wR 2 = 5.16% for all data. The goodness-of-fit was 1.139. The largest peak in the final difference electron density synthesis was 1.067 e−/Å3 and the largest hole was −0.722 e−/Å3 with a root-mean-square deviation of 0.146 e−/Å3. On the basis of the final model, the calculated density was 4.28 g/cm3 and F(000), 1440 e−. A schematic of the obtained crystal structure is shown in Fig. 1(d). The stacking of perovskite slabs and rock-salt layers is along [001]. Within the perovskite layers, the octahedra are connecting corners along [110] and  $\left[ {1\bar{1}0} \right]$. In the slightly distorted tetragonal P42/mnm structure, the octahedra tilting is only present along one of the in-plane directions. The out-of-phase tilting with a tilting angle of −7.863° keeps alternating from one block of double layer to the next due to the screw axis 42 around [001].
Space group, lattice constants, atomic coordinates, equivalent isotropic atomic displacement parameters (Å2), and anisotropic atomic displacement parameters (Å2) from X-ray crystallographic analysis for Ba3Zr2S7.

Mosaicity and texture analysis
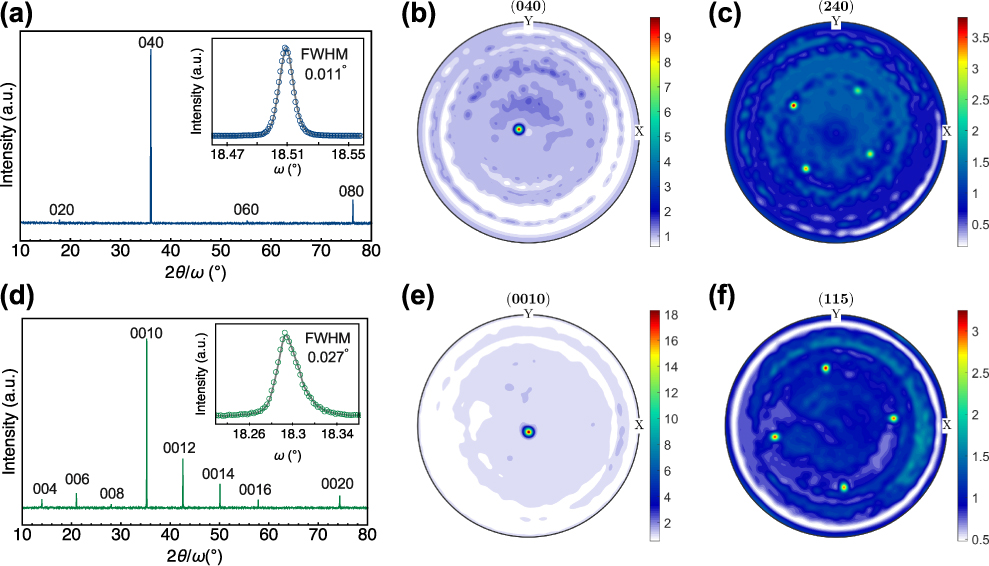
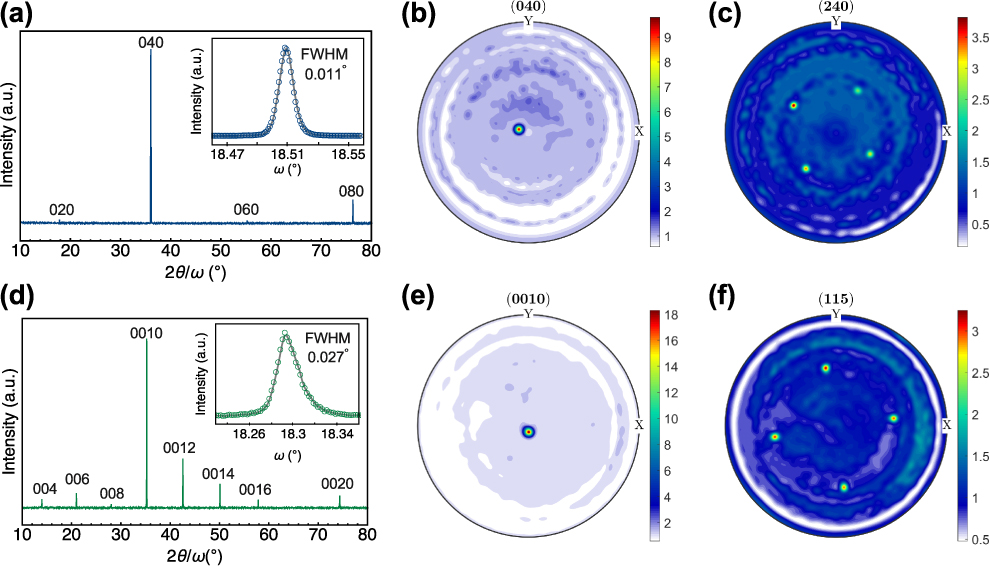
For the bigger crystals of BaZrS3 and Ba3Zr2S7, we performed specular XRD scans on isolated crystal pieces in an X-ray diffractometer with monochromatic radiation. For BaZrS3, a set of narrow 0k0-type reflections were observed, as shown in Fig. 3(a). The most intense reflections have a full width at half maximum (FWHM) of less than 0.04°. We also performed high-resolution rocking curve (RC) measurements. The inset is the RCs of the most intense 040 reflection. Notably, we obtained a RC FWHM of 0.011° for the BaZrS3 crystal, indicating highly structural quality of the single crystal with low mosaicity. We note that cubic-looking crystals could also show (101) orientation. As mentioned earlier, the difference in lattice spacing between these two directions is less than 0.3%. Specular XRD scan of Ba3Zr2S7 showed a set of 00l-type peaks, as shown in Fig. 3(d). This proves that the terminating crystal facets with layer-like features are the (00l) plane. For Ba3Zr2S7, the RC width is notably larger, with a FWHM of 0.027° for 0010 reflection, presumably arising from a higher degree of mosaicity associated with the layered nature of the crystal structure. The phase and orientation of the single-crystal samples were also examined by X-ray pole figure analysis. The 040 and 240 pole figures of a BaZrS3 crystal are shown in Figs. 3(b) and 3(c). Figure 3(b) indicates (040) planes are aligned to the normal of the sample surface, confirming the orientation. The spot is slightly off the center due to the small misalignment of the sample when mounted on the stage. Figure 3(c) exhibits the 4-fold symmetry of the (042) poles, resulting from very similar values for a and c lattice parameters. The 0010 and 115 pole figures of a Ba3Zr2S7 crystal are shown in Figs. 3(e) and 3(f). Similarly, Fig. 3(e) confirms (00l) orientation and Fig. 3(f) exhibits the 4-fold symmetry of the (115) poles in the tetragonal crystal system.
Specular XRD scan of individual crystals for (a) BaZrS3 and (d) Ba3Zr2S7. The insets are RCs of the most intense peaks with the circular symbols being the measured data and the solid lines are a guide to eye to extract the FWHM. FWHM was obtained with Gaussian fitting. Pole figures for (b) BaZrS3 040, (c) BaZrS3 240, (e) Ba3Zr2S7 0010, and (f) Ba3Zr2S7 115 plotted as orientation density function. The color bars indicate multiples of distribution function.
High-resolution electron microscopy
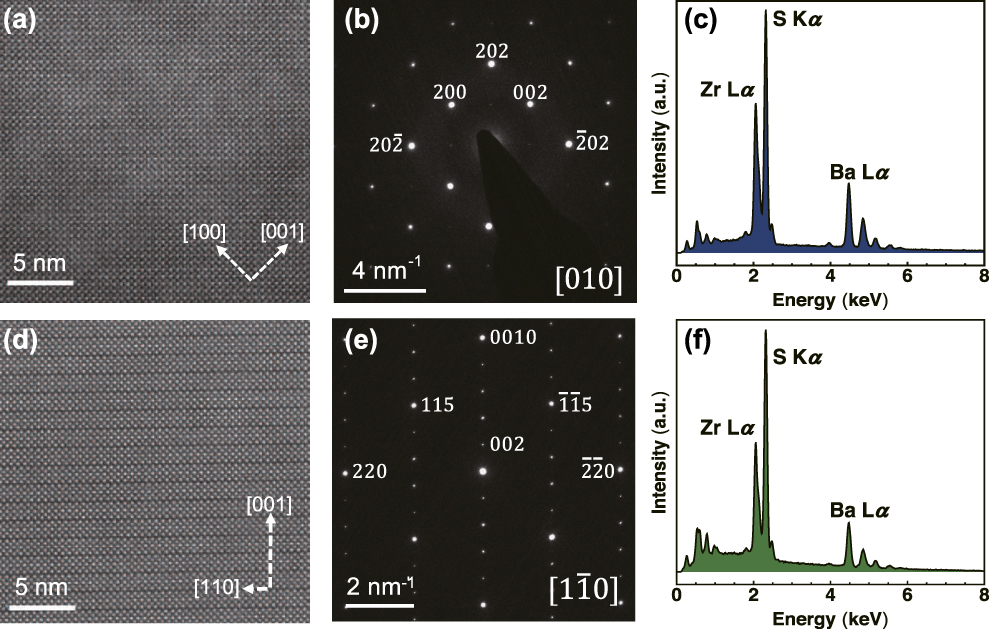
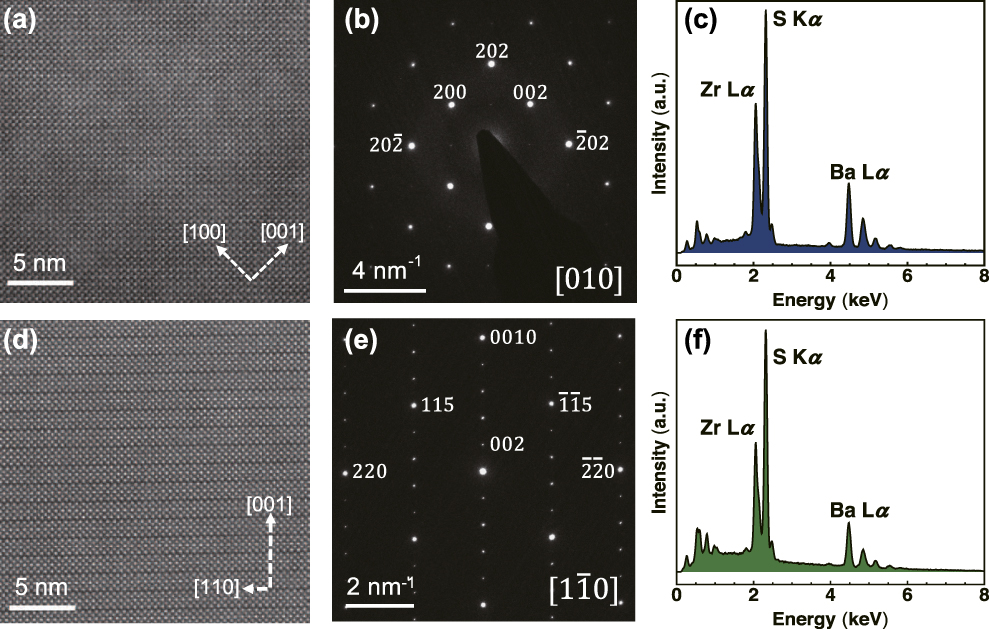
We further performed scanning transmission electron microscopy (STEM) studies on the crystals. The high-angle annular dark-field (HAADF) image of a BaZrS3 and a Ba3Zr2S7 crystal and corresponding selected area electron diffraction (SAED) patterns are shown in Fig. 4. In Fig. 4(a), we can see the extended 3D corner-sharing octahedra network and a pseudo-cubic pattern in BaZrS3. We were not able to resolve the subtle Ba displacements in STEM, and the HAADF collection angle excludes scattering from the lighter S atoms. Given the small difference in spacing between the three quasi-cubic directions, (020), (101), and  $\left( {10\bar{1}} \right)$, the image and diffraction pattern can be indexed with either [010] or [101] being the zone axis. In Ba3Zr2S7, as shown in Fig. 4(d), one can see the double-layer perovskite blocks stacked along [001]; the blocks are offset by half a unit cell along the face diagonal of the in-plane square lattice. The diffraction pattern in Fig. 4(e) can be indexed with a zone axis of
 $\left[ {1\bar{1}0} \right]$ (or equivalently [110]). The denser diffraction spots along (001) are due to the much larger lattice constants of the c axis. The bright 0010 spot and weaker 004, 006, and 008 spots resemble very well the intensity of the peaks we see in the specular scan in Fig. 3(d). Such highly symmetric SAED patterns indicate high crystallinity of the grown crystals over the selected region and agree well with the pole figure analysis. Chemical composition analysis by energy dispersive X-ray spectroscopy (EDS) with varying locations and magnifications on the crystals showed only expected elements in a consistent ratio, as shown in Figs. 4(c) and 4(f).
The cross-sectional STEM images of (a) BaZrS3 viewed along the b axis and (d) Ba3Zr2S7 viewed along the [110] direction. Corresponding SAED patterns of (b) BaZrS3 and (e) Ba3Zr2S7. EDS spectra of (c) BaZrS3 and (f) Ba3Zr2S7 samples taken at 400×. The obtained Ba:Zr:S ratios are 1.06:1:3.04 and 1.56:1.1:3.45, respectively.
Conclusion
The growth of high-quality BaZrS3 crystals was achieved using the flux growth method with BaCl2 flux. Through X-ray diffraction analysis of the crystal, the space group of Pnma with lattice constants of a = 7.056(3) Å, b = 9.962(4) Å, and c = 6.996(3) Å was extracted for BaZrS3. The octahedral tilting system was identified to be a +b −b −, with in-phase tilting of 9.0005° around [010] and out-of-phase tilting of −7.027° around [101] and  $\left[ {10\bar{1}} \right]$. STEM images and electron diffraction pattern were used to probe the local crystallinity of the crystal. High-resolution X-ray RC (FWHM of 0.011°) and pole figure analysis for 040 and 240 reflections revealed overall high crystallinity of the grown crystal. Ba3Zr2S7 crystal was also grown using a similar method by varying the starting precursor stoichiometry ratio. X-ray diffraction analysis of the Ba3Zr2S7 crystal showed a P42/mnm structure and a RC FWHM of 0.027°. STEM image with [110] zone axis and corresponding diffraction pattern, along with pole figure analysis for 0010 and 115, were shown to further establish high crystallinity. We expect the crystal growth of perovskite chalcogenides to enable more advanced spectroscopic and transport measurements to study their optoelectronic properties.
Experimental section
Materials synthesis
The single crystals were grown using the salt flux method in sealed quartz ampoules with BaCl2 flux. Barium sulfide powder (Sigma-Aldrich, 99.9%), zirconium powder (STREM, 99.5%), and sulfur pieces (Alfa Aesar, 99.999%) were stored and handled in an argon-filled glove box. Stoichiometric quantities of precursor powders with a total weight of 0.5 g were mixed and loaded into a 3/4-inch-diameter quartz tube with 1.5 mm thickness along with around 0.5 g BaCl2 (Alfa Aesar, 99.998%) inside the glove box. The tube was capped with ultra-torr fittings and a bonnet needle valve to avoid exposure to the air, until it was evacuated and sealed using a blowtorch. The sealed tubes were about 12 cm in length. The tubes were heated to 1050 °C at a ramping rate of 0.3 °C/min, held at 1050 °C for 40 h, and then cooled to 400 °C at a cooling rate of 1 °C/min, and then allowed to naturally cool down after that by shutting off the furnace. The obtained samples were washed with deionized water repeatedly to remove the excess flux, and dried with acetone and isopropyl alcohol. In some cases, the residue flux after washing was removed by sonicating the crystals in isopropyl alcohol.
RC measurement
The specular X-ray diffraction and RC measurements were carried out in a Bruker D8 advanced X-ray diffractometer in parallel beam configuration, using a germanium (004) two-bounce monochromator for Cu Kα1 radiation.
Pole figure analysis
X-ray pole figure analysis was carried out using a Bruker D8 Discover GADDS with a Co Kα source, 1/4 Eulerian cradle, and Vantec-2000 area detector. The pole figure data were collected with 1° resolution in rotation at tilts of 25°, 50°, and 75° to ensure coverage over the entire pole sphere. The two-dimensional diffraction data were reduced with Bruker Multex area 2 software, and the pole figures were analyzed in MTEX texture analysis software [Reference Bachmann, Hielscher and Schaeben28].
Single-crystal X-ray diffraction
The single-crystal X-ray diffraction data were collected on a Bruker SMART APEX DUO 3-circle platform diffractometer using Mo Kα radiation (λ = 0.71073 Å) monochromatized by a TRIUMPH curved crystal monochromator. The diffractometer was equipped with an APEX II CCD detector and an Oxford Cryosystems Cryostream 700 apparatus for low-temperature data collection. The crystals were mounted in a Cryo-Loop using Paratone oil. The measurement was performed at 100 K. A complete hemisphere of data was scanned on ω (0.5°) at a detector distance of 50 mm and a resolution of 512 × 512 pixels. A total of 2520 frames were collected. The frames were integrated with the Bruker SAINT software package using a SAINT V8.38A (Bruker AXS, 2013) algorithm. The structure was solved and refined using the Bruker SHELXTL software package [Reference Sheldrick29].
Electron microscopy
Scanning electron microscopy (SEM) images were obtained in a JEOL JEM-7001F analytical field-emission scanning electron microscope equipped with EDAX Apollo X 10 mm2 EDS. The SEM images and EDS spectra were acquired with 15 kV accelerating voltage and a working distance of 15 mm. A thin layer of Pt was sputter-coated on the crystals to mitigate the charging effects. Magnifications ranging from 100× to 10,000× were used to check the consistency of chemical composition ratios across the crystals. The spectra shown were recorded at 400×. We used the commercially pre-analyzed BaS as a standard, and measured its EDS side by side with the crystals to serve as calibration for Ba:S ratios. The BaS powders were sealed under argon until entering the SEM chamber to minimize potential oxidation. The Ba:S ratio obtained in BaS across multiple magnifications was consistently 1.14:1, justifying the need for such calibration.
The STEM images were acquired using an aberration-corrected FEI Titan (Thermo Fisher Scientific Inc.) transmission electron microscope operated at an accelerating voltage of 300 kV. Samples for TEM observations were prepared by focused ion beam (FIB) milling using a Ga-ion beam at an accelerating voltage of 30 kV, followed by a cleaning/polishing procedure by Ar-ion milling at 1.5 kV and 700 V to remove FIB-induced residual Ga and surface amorphization in the sample.
Supplementary material
The following files are available in supplementary information.
• BaZrS3.cif: cif file from X-ray diffraction analysis of BaZrS3 crystal.
• Ba3Zr2S7.cif: cif file from X-ray diffraction analysis of Ba3Zr2S7 crystal.
To view supplementary material for this article, please visit https://doi.org/10.1557/jmr.2019.348.
Acknowledgments
J.R., S.N., and B.Z. acknowledge the Air Force Office of Scientific Research under award number FA9550-16-1-0335 and Army Research Office under award number W911NF-19-1-0137. S.N. acknowledges the Link Foundation Energy Fellowship. R.J. and K.Y. acknowledge support from the National Science Foundation under contract No. 1751736, “CAREER: Fundamentals of Complex Chalcogenide Electronic Materials”. M.E.M. and E.B. acknowledge support by the Air Force Office of Scientific Research under award number FA9550-15RXCOR198. E.B. acknowledges the National Science Foundation Graduate Research Fellowship under grant No. DGE-1450681. The authors gratefully acknowledge the use of facilities at the Core Center of Excellence in Nano Imaging at University of Southern California and the use of facilities and instrumentation supported by NSF through the Massachusetts Institute of Technology Materials Research Science and Engineering Center DMR-1419807.