Introduction
Effective management of invasive species is one of the greatest environmental challenges globally due to the increasing negative influences many alien species are exerting on ecosystems and human welfare (Mack et al., Reference Mack, Simberloff, Lonsdale, Evans, Clout and Bazzaz2000; Veitch et al., Reference Veitch, Clout and Towns2011). Although management for many invasive taxa such as mammals, especially rodents, has greatly improved over the past few decades (Campbell & Donlan, Reference Campbell and Donlan2005; Howald et al., Reference Howald, Donlan, Galván, Russell, Parkes, Samaniego, Wang, Veitch, Genovesi, Pascal, Saunders and Tershy2007; Oppel et al., Reference Oppel, Beaven, Bolton, Vickery and Bodey2010), management efforts remain rudimentary for other taxa such as ants (Williams et al., Reference Williams, Collins and Oi2001; Silverman & Brightwell, Reference Silverman and Brightwell2008; Hoffmann et al., Reference Hoffmann, Abbott, Davis, Lach, Parr and Abbott2010, Reference Hoffmann, Davis, Gott, Jennings, Joe, Krushelnycky, Miller, Webb and Widmer2011).
One of the greatest impediments to the successful management of invasive species is a lack of biological knowledge of the target organism, or selected control agents (Buckley, Reference Buckley2008; Esler et al., Reference Esler, Prozesky, Sharma and McGeoch2010). For example, although eradications of ship rat Rattus rattus on four islets in the French Caribbean were apparently successful, rats were re-detected on two islets within 3 years due to individuals re-invading from the mainland (Pascal et al., Reference Pascal, Brithmer, Lorvelec and Vénumière2004; Abdelkrim et al., Reference Abdelkrim, Pascal and Samadi2007). The finding that rats were capable of self-dispersing across multiple hundreds of meters of sea (Abdelkrim et al., Reference Abdelkrim, Pascal, Calmet and Samadi2005) resulted in the size of the ‘eradication unit’ for rats being increased. The subsequent changes to management protocols, based on the new biological information, improved rat eradication efforts, and is partly responsible for eradication of rats being by far more successful than for any other taxa (Howald et al., Reference Howald, Donlan, Galván, Russell, Parkes, Samaniego, Wang, Veitch, Genovesi, Pascal, Saunders and Tershy2007).
Although research focusing on invasive species has increased exponentially throughout the last century (Richardson & Pyšek, Reference Richardson and Pyšek2008), the biology and ecology of most species inside their native range, let alone their exotic range, is too poorly understood to fully create knowledge-based decisions and management protocols (Simberloff, Reference Simberloff2003; Esler et al., Reference Esler, Prozesky, Sharma and McGeoch2010). This issue is particularly problematic when an exotic species occurs in novel environments in its exotic range, where its biology may differ substantially from that in its native range (Bøhn et al., Reference Bøhn, Sandlund, Amundsen and Primicerio2004; Heller, Reference Heller2004; Kelehear et al., Reference Kelehear, Brown and Shine2012). For example, on a tropical Hawaiian mountain, the temperate weed Verbascum thapsus displays great differences of plant size, flowering and generation time to that displayed on temperate mountains in its exotic range (Ansari & Daehler, Reference Ansari and Daehler2010), and its life history varies greatly latitudinally throughout its exotic range in North America, much more so than in its native range (Gross & Werner, Reference Gross and Werner1978).
Among invasive taxa, ants have been highly successful as invasive species (Holway et al., Reference Holway, Lach, Suarez, Tsutsui and Case2002), partly attributable to failures in managing them and preventing further dispersal (Williams et al., Reference Williams, Collins and Oi2001; Hoffmann et al., Reference Hoffmann, Abbott, Davis, Lach, Parr and Abbott2010). One exception to the poor history of invasive ant management has been the eradication efforts against yellow crazy ant Anoplolepis gracilipes in northern Australia. Within this single program, 22 discrete infestations covering 79 ha have been demonstrated to have been eradicated, and eradication is presumed for at least another ten locations covering >500 ha (Hoffmann, Reference Hoffmann2010; Hoffmann et al., Reference Hoffmann, Davis, Gott, Jennings, Joe, Krushelnycky, Miller, Webb and Widmer2011; Hoffmann unpublished data). This program differs from most ant management programs in that it has embraced an active adaptive approach (Walters & Holling, Reference Walters and Holling1990; Hauser & Possingham, Reference Hauser and Possingham2008; Hoffmann & Abbott, Reference Hoffmann, Abbott, Lach, Parr and Abbott2010), whereby research is conducted on-site, as part of the management program, to refine and improve project actions and thus project outcomes. This approach enhances management outcomes as information gained on-site is not confounded by potential geographic variations in the ant's biology, and is also learnt in real-time, providing immediate benefits to the program.
The active adaptive approach taken by the crazy ant eradication program was vitally important, because in the early stages of the program, although treatment efficacy was high, eradication was not being achieved. Part of this problem was believed to stem from much of the protocols of all aspects of the project being based on ‘gut feeling’, information from elsewhere in the world, or from other species, rather than on-site information of the target species. To solve this problem, key components of the ant's biology that may affect treatment efficacy (e.g., reproductive phenology) or assist our ability to create knowledge-based protocols (e.g., nest density and distribution, rate of spread and daily activity patterns) were identified and researched.
Here I detail this research into the biology and ecology of A. gracilipes conducted throughout northern Australia that was used to modify eradication protocols to greatly improve eradication success, or was gathered to commence addressing the unknown influence of such biological factors on eradication success. In doing so, I demonstrate how such knowledge can be used within invasive species management programs generally, especially for ants, and particularly how it was vital to dealing with critical issues that otherwise would have resulted in management failures.
Methods
Study area
The study was conducted within northeast Arnhem Land (12°11′S, 136°46′E) in Australia's Northern Territory. The regional climate is tropical monsoonal with high temperatures (17–33 °C) throughout the year and an annual rainfall of approximately 1200 mm falling predominantly during the summer wet season. The landscape is dominated by savanna woodland within which other minor habitats are embedded.
Spatially discrete populations of A. gracilipes were studied within three distinct habitats: savanna woodland, dry vine thicket and monsoon rainforest. Savanna woodland is dominated by eucalypts to heights of approximately 15 m, with an understorey to 3 m predominantly of acacias and grasses. The canopy is open (20% cover; Williams et al., Reference Williams, Duff, Bowman and Cook1996). Dry vine thicket is a semi-evergreen rainforest usually found on coastal dunes that are water-restricted during the dry season, with low to intermediate canopy heights (3–15 m) that are mostly interlocked (>90% cover; Russell-Smith, Reference Russell-Smith1991). Monsoon rainforests are evergreen rainforests associated with permanent moisture or in topographic positions providing shelter from fire. The canopy is high (approximately 20 m) and completely interlocked (>95% cover; Russel-Smith, Reference Russell-Smith1991).
Nest density and distribution
Nest density and spatial arrangement were quantified in three 10 m×20 m plots, one in each of the three dominant habitat types: savanna, vine thicket and rainforest. These three habitats potentially represent a range of habitat suitability to A. gracilipes from the least to the most suitable, respectively (see Hoffmann & Saul, Reference Hoffmann and Saul2010 for details). Measurements were conducted in the savanna and vine thicket plots in August 2006 and the rainforest plot in September 2006. This survey was not a replicated design aimed at conducting statistical tests, rather it was performed to gain insight into the range of nest densities and spatial arrangements within this region at the time when nest densities were expected to be the lowest.
Within each plot, nests (defined here as potentially permanent nesting locations, such as underground holes and hollowed logs, but not leaf litter) were located by disturbing all leaf litter and surface materials. Nest entrances closer than 40 cm to each other were considered to be of the same nest based on personal experience of nest excavations. Distances recorded were from each nest to the closest nest as well as to the closest tree, and from each tree to the closest tree. Trees were only included if they had a diameter at breast height (DBH: diameter at 1.3 m)>3 cm. The DBH of each tree was also recorded.
The non-parametric Kruskal–Wallis analysis of variance (ANOVA) was used to compare the distance between nests in the three habitats, and the non-parametric Mann–Whitney U-test was used to compare tree metrics (distance between the closest trees and DBH) with the metrics of the tree closest to A. gracilipes nests within the three habitats. Both of these tests were conducted using Statistica v11.
Nest characteristics and queens
Nest characteristics were quantified by excavating nests between October 2006 and January 2010. Data collection occurred haphazardly, both temporally and spatially, thus the nest information reflects the regional patterns. Nests were defined as any location (i.e., within log, underground and within leaf litter) that contained workers and brood. Nests were located by visual searches. Data recorded were: nest location; maximum nest depth; number of queens; and depth of queens. Not all data were recorded for all nests, and in such instances those nests were excluded from specific analyses.
Activity
Circadian ant activity was measured by counting the number of ants passing a point on a foraging trail on a tree trunk over a 60 s period. Six foraging trails on six trees, spaced more than 10 m apart were used as replicates. Foraging data were collected hourly for a 24 h period on 9 and 10 September 2007. Temperature data were measured at 1 m (ambient temperature) and 3 mm (ant height) using a Fluke thermocouple thermometer corresponding with each ant activity count. Because all foraging trails were in the full shade all day the two temperature measurements were almost identical, so only the ambient temperature was used in analyses. Relative humidity data were obtained from a meteorology recording station located less than 1 km away.
All analyses were conducted using ant activity expressed as the proportion of maximum activity recorded for each foraging trail. General linear models with binomial errors were used to determine the relationship of ant activity with temperature and relative humidity using the program R (R Development Core Team, 2010). Models created were (1) null which assumed that ant activity is best described by a single mean, (2) ambient temperature, (3) relative humidity and (4) temperature+humidity. The models were ranked for suitability using Akaike's Information Criterion (AIC), which favours both model fit and model simplicity. Lower AIC values indicate greater support for a model relative to the other models. Absolute AIC values are not important; only the differences in AIC between models are, with differences of <2 indicating no real difference between models, and differences >10 that the indicating models are greatly different (Burnham & Anderson, Reference Burnham and Anderson2002).
Rate of spread
The supercolonial nature of A. gracilipes is believed to be partly derived from dispersal in the absence of a nuptial flight, instead involving the migration of a newly inseminated queen and a small group of workers to generally within a few meters of the parent colony (Rao et al., Reference Rao, Veeresh and Viraktamath1991). On a local scale, this dispersal method results in nests spaced only a few meters apart and thus populations have relatively sharp distributional boundaries, thereby providing the opportunity for detailed measurements of rate of spread.
Three sites with one nest (1 site) and four interconnected nests (2 sites) were found persisting in areas previously subject to toxic treatment and were monitored with haphazard timing for almost 4 years to simulate population growth and spread at the early stages of an invasion. Assessments involved tuna lures, teaspoon amounts of tuna, being placed in grids of 2 m spacing for 20 m in all directions around the known nest(s). Nests were defined as permanent locations (i.e., holes, logs, rocks, but not leaf litter) from where workers were recruiting to lures. Nests were mapped by following the trails of workers from lures after approximately half an hour. Visual inspections were also conducted up to 50 m from known nests to ensure that incipient nests had not been created farther than where the lure sampling was being conducted.
For calculating the infestation area, an arbitrary figure of 1 m2 was applied when only a single nest occurred. For two nests, the area was defined as the distance between the two nests plus 1 m (i.e., half a meter either side of each nest). Calculation of larger areas was based on the polygon produced by the peripheral nests plus half a meter.
The number of nests and the area of infestation were modeled with time. The commencement time (t=0) was defined as the first sample of the site with a single nest. Because a new incursion first involves the establishment of a single colony, the time axis placement (age) of the two sites commencing with four nests needed to be assigned. The time determinations for these two sites were made by fitting their area measurements into an initial area vs. time correlation of the first (single nest) site. I used the model of area rather than of nest number because it provided the strongest correlation (R 2=0.945 vs. 0.884). Because the first sample for each site was conducted in different months, to account for potential seasonal variation in nest number and infestation area, the modeled t=0 determinations were further adjusted by the difference in the sample times (days) between these sites and the first site. All data were fitted with an exponential trend line because the innate capacity of growth for any population is exponential (Raven & Johnson, Reference Raven and Johnson1992), and this is what would be expected at least for the early stages of an invasion.
Abundance cycle and reproductive phenology
The annual abundance cycle and reproductive phenology of A. gracilipes was determined by quantifying the annual pattern of pupae production. Samples were collected haphazardly from nest excavations throughout the landscape from April 2004 to December 2009, and informal observations continued until October 2011. All pupae found within nests were collected, and then determined in the laboratory as being either a worker, male or queen. Determinations were made under a dissecting microscope, with the brood being visible within the pupal case when immersed in alcohol and placed on a black background. Queen pupae were immediately recognizable by their disproportionally large size compared to all others. Male pupae had developing wings, or where they were still too early in the development process could be identified from workers by their larger size.
Parasites and nest co-inhabitants
During nest excavations, any other invertebrates found that were believed to be clearly dwelling with A. gracilipes and not just living in the soil nearby, were collected. These, and ecto-parasites found on the bodies of A. gracilipes workers were sent to specialists for identification.
Results
Nest density and distribution
The plots within the three habitats of savanna, vine thicket and rainforest and the additional plot within a cleared area of vine thicket contained nine, 28, 32 and 44 nests, respectively, equating to one nest per 22, 7.1, 6.3 and 4.6 m2, respectively. The mean distance between the closest nests within the three habitats was 4.9, 2.4 and 1.9 m, respectively (table 1), with all three being statistically different to each other (Kruskal–Wallis ANOVA; H 2,69=27.5, P<0.0001). The nest density was such that within both the rainforest and the vine thicket, all nests were found within 1–4 m of each other, but within the savanna, the nests were farther than 3 m apart (fig. 1a).
Frequency distributions of: (a) distance between closest nests; (b) distance between closest trees; and (c) distance from each nest to the closest tree, as well as (d) the relationship between the distance from each nest to the closest tree with tree diameter, in the three habitats of rainforest (squares) vine thicket (triangles) and savanna (diamonds).

Means (cm)±SE of tree and nest metrics in three habitats.

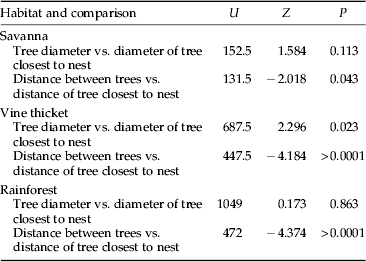
If A. gracilipes were nesting in random locations, then a histogram of the distance from each nest to the closest tree would be expected to display an approximately equivalent pattern to that displayed by the distance between trees (fig. 1b). This was not the case, with the distance between trees being significantly greater than the distance from each colony to the closest tree in all habitats (table 1). Notably, one-third of nests in rainforest, almost two-thirds in vine thicket and two of the nine in savanna were at the base of a tree (fig. 1c) and 45, 68 and 56%, respectively, were within 50 cm of a tree. Nests were also preferentially located beside relatively large trees, with almost all trees with DBH >24 cm having a nest at its base and the diameter of tree closest to each nest being on average 39% greater than the mean diameter of all trees in the plots (table 1). However, these differences in mean plot tree DBH and the mean DBH of the closest tree to each nest only proved statistically significant within the vine thicket (table 2). There was no clear overall relationship between the distance of nests from the closest tree and tree DBH (fig. 1d).
Results of Mann–Whitney U-tests of tree metrics versus the metrics of the tree closest to A. gracilipes nests within the three habitats.

Nest characteristics and queens
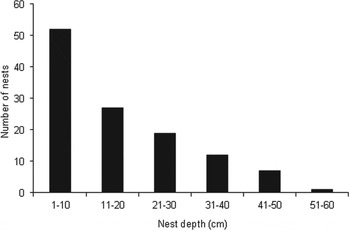
A total of 279 nests were assessed. Of the 205 nests whose locations were recorded, most (60%) were underground, predominantly (89%) occurring in an open area rather than underneath a rock or log. A further 23% were within leaf litter, 10% were underneath a log or rock but did not extend into the soil and 7% were within a tree, termite mound or log. Some seasonality was evident for nests within leaf litter, with most (83%) occurring during the ‘wet season’ (October–March). Of the underground nests, most were shallow, with 44% being less than 10 cm deep, and 67% being less than 20 cm deep (fig. 2). The deepest nest was 60 cm.
Number of underground nests within nest depth size classes.

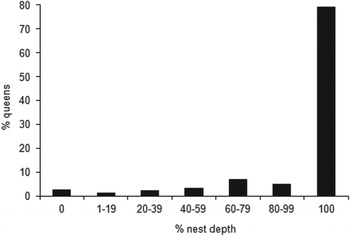
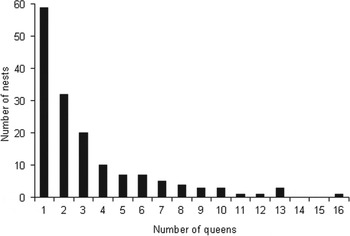
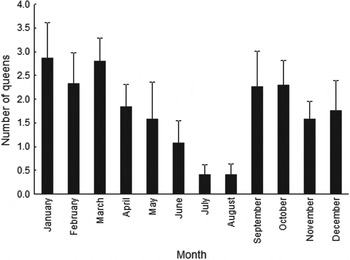
Of the 278 nests assessed for the presence of queens, only 156 (56%) contained queens. Of the 62 underground nests containing queens, most queens (80%) were located at the deepest chamber (fig. 3), but queens were found at all relative nest depths, including at the surface in leaf litter. When queens were present, most often (38%) only one queen was present. 71% of nests contained up to three queens (fig. 4), and the most queens found within a nest was 16. There was clear seasonal variation in the number of queens per nest (fig. 5), with the number being lowest in July and August just prior to the emergence of virgin queens in September, with queen numbers then remaining steadily high until April.
Proportion of queens found at relative nest depths in 68 nests located underground.

Histogram of the number of queens per nest.

Average (±SE) number of queens per nest per month.

Activity
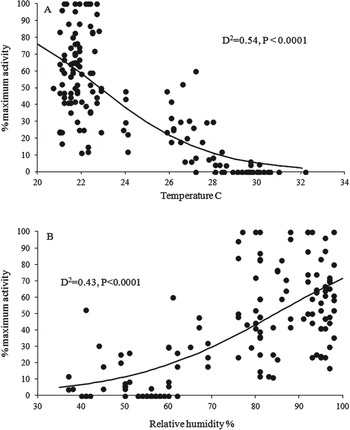
The daily activity pattern of A. gracilipes followed a unimodal pattern, with peak activity occurring largely nocturnally, and ceasing during mid-day (fig. 6). Both ambient temperature (fig. 7a) and relative humidity (fig. 7b) were strongly related to ant activity (D 2=0.54 and 0.43, P<0.0001, respectively), with the combination of both providing the best model (AIC difference=10; D 2=0.55).
Average (±SE) activity rates of six A. gracilipes foraging trails within a 24 h period expressed as the percentage of the maximum activity of each trail.

Relationship between ant foraging activity expressed as the percentage of the maximum activity of each foraging trail, with ambient temperature (a) and relative humidity (b). D 2 is the proportion of the deviance explained by the model.

Rate of spread
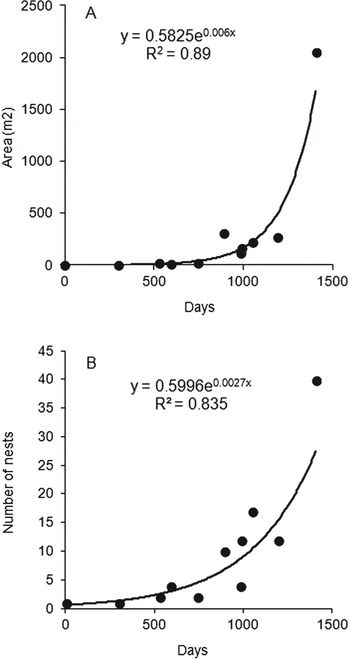
The increase in infested area and number of nests correlated highly with time (R 2=0.89 and 0.85, respectively) (fig. 8), increasing exponentially after about 1000 days.
Relationship between (a) infestation area and (b) number of nests with time.

Abundance cycle and reproductive phenology
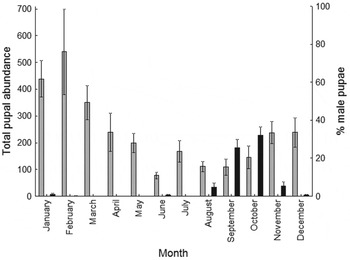
Total brood production followed a unimodal pattern, with greatest numbers in February and the lowest around August and September (fig. 9). Although June samples had the lowest average number of pupae, June and December, appear to have lower than expected pupae abundance most likely due to a nuance of the site from where these monthly samples were predominantly collected. Males were found every month, predominantly between August and November, peaking in October when on average 32% of brood were males. In all other months, there were typically only one or a few individuals found among all samples. Queen pupae were never found in nest excavations, and were only observed four times in four different locations over 7.5 years, always in September. Two observations were of one nest, and a third was of two nests among many nests inspected within three approximately 2500 m2 areas in 2008 and 2011. The fourth involved many nests within a single small population (~1 ha) in 2011.
Average (±SE) number of pupae (grey columns), and average proportion of male pupae (black columns) per nest in each month.

Parasites and nest co-inhabitants
One ectoparasite was found, being a parasitic larva of an erythraeid, possibly from the genus Leptus. Five nest co-inhabitants were found, being the Cucurbit Shield Bug Megymenum affine Boisduval (Family Dinidoridae), an unidentified spider species from the genus Cryptothele (Family Zodariidae), two unidentified woodlice species from two families (Armadillidae and Trachelipidae) and an unidentified Opilionid in the genus Dampetrus (Family Assamiidae).
Discussion
Nest density and distribution
Nests were not randomly distributed, with up to two-thirds of nests located at the base of a tree, especially the relatively large trees. This strategic placement of nests has also been observed for Linepithema humile (Heller & Gordon, Reference Heller and Gordon2006), and is not surprising as trees provide important carbohydrate resources to ants, and the proximity of a nest to a food source aids resource monopolization (Oliver et al., Reference Oliver, Pettitt, Leather and Cook2008). Carbohydrates dominate A. gracilipes colony dietary requirements, regulating its population density (Haines & Haines, Reference Haines and Haines1978; Veeresh, Reference Veeresh, Eder and Rembold1987; O'Dowd et al., Reference O'Dowd, Green and Lake2003; Savage et al., Reference Savage, Rudgers and Whitney2009), as is the case for many other ants (Davidson et al., Reference Davidson, Cook, Snelling and Chua2003), especially invasive species (Helms & Vinson, Reference Helms and Vinson2008; Rowles & Silverman, Reference Rowles and Silverman2009; Wilder et al., Reference Wilder, Holway, Suarez, LeBrun and Eubanks2011). The availability of carbohydrates to A. gracilipes likely influences this, and other ants’ competitive abilities, as has been found for L. humile (Kay et al., Reference Kay, Zumbusch, Heinen, Marsh and Holway2010). The relationship between the nest proximity to a tree and the identity of tree species, especially differentiating trees with and without carbohydrate resources available to A. gracilipes, was not studied here, but warrants attention.
Nest density varied from one per 6.3 to 22 m2. Only three other studies have quantified A. gracilipes nest densities. In the Seychelles, maximum nest density was one per 14.9 m2, none being underground (Haines & Haines, Reference Haines and Haines1978). In coconut palm plantations in New Guinea, Young (Reference Young1996) also found that A. gracilipes rarely nested in the soil, but ephemeral nests (i.e., in leaf litter, which were excluded here) could occur up to one per 2 m2. Finally, on Christmas Island, Abbott (Reference Abbott2005) found nest entrance densities reached 10.5 per m2; however, at this density these entrances would not constitute discrete nests. Indeed what constitutes a discrete nest within the high density populations on Christmas Island is not readily clear (personal observation).
The nest densities recorded here for A. gracilipes are comparable to those recorded for the unicolonial ant L. humile, also with nest density varying among habitats. Heller et al. (Reference Heller, Ingram and Gordon2008) found L. humile nest density in northern California varied from one nest per 6 m2 in annual grassland to one per 25 m2 in perennial grassland, and one per 14.3 m2 in woodland. Ingram (Reference Ingram2002) reported nest densities varied from approximately one per 22 m2 to one per 484 m2 in multiple Hawaiian habitats. Finally, Heller (Reference Heller2004) found nest densities were similar between sites in this ant's native range in southern Rio Paraná in Argentine and northwest California, ranging between one per 5 and 10 m2.
Just as the nest density varies among habitats, the nest density of many supercolonial invasive ants also varies seasonally, but this dynamic has received little attention to date (Haines & Haines, Reference Haines and Haines1978; Rao & Veeresh, Reference Rao and Veeresh1991; Heller et al., Reference Heller, Sanders and Gordon2006). This knowledge is vital if we are to understand the nest temporal dynamics relative to population cycles and responses to the heterogeneity of resources and abiotic conditions. I have observed such nest temporal dynamics in Arnhem Land, but these are yet to be quantified. Notably, density measurements here were conducted at the time of the lowest annual ant abundance. Such temporal dynamics at the local scale have significant, yet to-date unquantified, implications for the flow of resources throughout a supercolony (discussed later) and invasion dynamics at the landscape scale (Heller et al., Reference Heller, Sanders and Gordon2006).
Nest location and density information serve many management purposes. First for detection and mapping, and subsequently for post-treatment assessments, knowing that most nests are found at the base of trees, particularly large trees, streamlines the effort required, and also enhances search integrity. Second, for post-treatment assessments, nest density prior to treatment provides a biological benchmark to guide the effort and integrity of the assessments. In addition to the basic requirement of not detecting a species for 2 years to declare eradication success, assessments should be conducted at a density greater than the nest density to maximize the likelihood of detection.
Third, the nest location information provided strong evidence that carbohydrate supply was a major driver of A. gracilipes populations and therefore regulating carbohydrate supply would appear to be an obvious management action. In northern Australian savannas, burning the vegetation a few weeks prior to treatments removed all plant-based carbohydrates from the low-level Acacia spp., and most insect-derived sources (predominantly from hemipteran bugs) except from the canopies of the tallest trees. This nutritional restriction likely provided better bait uptake and consumption, (these have not been not quantified), but is evidenced by better treatment success than in unburnt savanna (unpublished data). Indirect control of the pest ant via control of its symbionts is developing as a management tool, and may well be the key to management of A. gracilipes on Christmas Island.
Nest characteristics and queens
That A. gracilipes has very flexible and dynamic nesting habits is well documented (Haines & Haines Reference Haines and Haines1978; Rao & Veeresh Reference Rao and Veeresh1991, Reference Rao and Veeresh1994; Young, Reference Young1996), just as in the case for numerous invasive ant species (Heller & Gordon, Reference Heller and Gordon2006; Buczkowski, Reference Buczkowski2010; Tindo et al., Reference Tindo, Masse, Kenne, Mony, Orivel, Fotio, Kuaté, Djiéto-Lordon, Fomena, Estoup, Dejean and Foucaud2012). Similarly, A. gracilipes and other supercolonial ant species display great variation in the number of queens per nest (Ingram, Reference Ingram2002; Espadeler et al., Reference Espadeler, Rey and Bernal2004; Orivel et al., Reference Orivel, Grangier, Foucaud, Le Breton, Andrès, Jourdan, Delabie, Fournier, Cerdan, Facon, Estoup and Dejean2009; Buczkowski, Reference Buczkowski2010), with queen numbers recorded here being among the lowest recorded for A. gracilipes. What remains unclear, however, is how nest location and queen number affect treatment success. For example, it is possible that arboreal nests will not necessarily be affected by treatments that are only conducted on the ground. This is particularly a concern for management of the little fire ant Wasmannia auropunctata where much management effort has been placed on arboreal treatments (Vanderwoude et al., Reference Vanderwoude, Onuma and Reimer2010). However, ground-level treatments have achieved multiple eradications of W. auropunctata in numerous complex Australian environments (Gary Morton unpublished data). Arboreal nests have never been found for A. gracilipes in northern Australia, and all treatments are conducted aerially, thereby supplying bait to the canopy anyway.
Nothing is known for any ant species about how queen number per nest/colony affects treatment efficacy. Presumably the more queens there are, the lower the efficacy would be, but this would be affected by queen to worker ratios, food processing and dissemination pathways, application timing relative to social dynamics, queen dominance hierarchies and possibly other factors.
Investigations into all such aspects of colony dynamics and how it affects bait efficacy would no doubt yield important breakthroughs for treating ants.
Activity
In northern Australian savannas A. gracilipes is clearly nocturnal, with its activity rapidly declining in the morning as temperatures increase until there is very little or no foraging occurring in the middle of the day. Prior to conducting this analysis, guesswork was required as to determining when the conditions (temperature) were too unsuitable for the ant such that the work being conducted was unreliable (i.e., searches were not detecting ants that were present). Based on the time of day when work typically stops and starts (fig. 6), this critical threshold equates to approximately 10% of maximum ant activity which is a surprisingly low number. Just as for the use of nest density information, activity information provides a biological basis to a fundamental work protocol which ensures that work conducted has the highest integrity.
Rate of spread
This is the first time that the rate of spread has been determined for any ant species at the equivalent of the establishment phase. All other equivalent work assessed the moving front of an established infestation. Importantly, the measurements conducted here are only meaningful for species dispersing via budding, not nuptial flights which can result in dispersal over multiple kilometers.
The rate of spread at this primary invasion stage increased exponentially, but was not studied long enough for it to plateau to a relatively steady rate in equilibrium to the respective environmental conditions. Rate of spread at the primary stages of invasion remains as one of the least quantified aspects of invasive ant biology, but clearly is important to help determine the treatment buffer zone, to allow for range expansion between the timing of mapping and treatment. Additionally, the rate of spread knowledge assists to estimate the age of an infestation, which has implications for assessing the likelihood of additional accidental human-assisted dispersal, as well as for tracing the source of the infestation. Notably, rate of spread should be considered on an annual basis, not on daily or weekly timeframes because the range expansion is predominantly associated with new sexual reproduction, and this does not normally occur throughout the year in invasive ants, but is instead restricted to a ‘breeding season’.
Abundance cycle and reproductive phenology
Knowledge of the seasonality of worker abundance is particularly useful for assessing treatment efficacy, because only with this knowledge can the relative influences of treatment and seasonality be differentiated when treatments are applied to entire infestations. The implications of the seasonality of worker abundance on treatment efficacy remain unstudied for any pest ant species. It remains unclear if the bait is transferred to queens more readily when worker populations are at their greatest, which presumably would result in greater uptake, or when populations are at their lowest providing a greater queen to worker ratio.
Quantifying the reproductive phenology of a species in situ is important because there can be a difference in reproductive timing between the native and introduced ranges, and among novel environments (Bøhn et al., Reference Bøhn, Sandlund, Amundsen and Primicerio2004; Ansari & Daehler, Reference Ansari and Daehler2010). This is particularly so for A. gracilipes which shows great global variation in sexual production, ranging from throughout the year (Haines & Haines, Reference Haines and Haines1978), mid-year between March and August (Rao & Veeresh, Reference Rao and Veeresh1991) to predominantly between October and March (Greenslade, Reference Greenslade1971; Baker, Reference Baker1976). Possibly one of the greatest failings of ant management programs is the lack of recognition of the reproductive cycle, especially when using insect growth regulators (IGRs). IGR treatments conducted during the reproductive phase will be the least effective, because they do not affect new sexuals in the pupal stage, which can rapidly recover the population post-emergence. Treatment programs that rely solely on broad-scale bait application should be commenced as soon as possible at the end of the reproductive phase to enable a treatment regime that kills or sterilizes the population before it has an opportunity to breed again.
Parasites and nest co-inhabitants
Biological control of invasive ants using ecto-parasites and pathogens from the ant's native range is currently being trialed in the USA, but only against fire ants, Solenopsis spp. (Bouwma & Shoemaker, Reference Bouwma and Shoemaker2011; Callcott et al., Reference Callcott, Porter, Weeks, Graham, Johnson and Gilbert2011). Unfortunately, the native range of A. gracilipes remains unknown, so the potential biocontrol agents against this species must be sourced from its exotic range. However, biological control is only generally considered to be a management option for invasive species, not an eradication option, so its utility is at best as a companion strategy to accompany eradication options. To date, nothing is known about the effects that the associated invertebrate fauna has on A. gracilipes populations, but given the very low incidence of the occurrence of these fauna, and the often very high abundance of A. gracilipes in Arnhem Land, these fauna would appear to have little prospects as effective biocontrol agents.
Conclusions
History has constantly shown that management of invasive ants rarely incorporates biological knowledge into strategies, at least not until it is too late (Williams et al., Reference Williams, Collins and Oi2001; Tschinkel, Reference Tschinkel2006). The same basic principles for management success apply to all invasive species (Myers et al., Reference Myers, Simberloff, Kuris and Carey2000; Simberloff, Reference Simberloff2009). An improved knowledge of the target organism, as well as the associated environment, is a key factor that can help prevent making basic management mistakes, and improve project outcomes. An adaptive management approach (Walters & Holling, Reference Walters and Holling1990; Hauser & Possingham, Reference Hauser and Possingham2008; Hoffmann & Abbott, Reference Hoffmann, Abbott, Lach, Parr and Abbott2010) urgently needs to be adopted in more management programs if the success of management against many invasive species is to improve.
Acknowledgements
I thank the many people that provided technical assistance, especially Mihkel Proose, Jon Edgar, Daryl Lacey, Arian Pearson, Tony Hertog and Magen Pettit. Thanks also to Dhimurru Aboriginal Corporation and the traditional land owners of NE Arnhem Land for access to the region, and staff of Rio-tinto Alcan Gove (now Pacific Aluminium) for access to and support on the mining leases. Funding was provided by the Natural Heritage Trust through the Natural Resources Management Board of the Northern Territory, as well as Caring for Our Country and Biodiversity Fund from DSEWPaC. Comments from Alan Andersen and Gloria Luque improved the draft manuscript.