

Introduction
Large earthquakes are disastrous almost wherever they occur. At best they give everybody a good scare and cause some adjustments to the landscape that may affect buildings and infrastructure, such as roads, rails and utility services. At worst, they create massive and indiscriminate death and destruction. The level of public understanding of these events is indicated by the fact that the insurance industry refers to them as ‘acts of God’. In recent decades, however, detailed measurements of surface deformation associated with earthquakes have brought new understanding of why and where earthquakes occur. An earthquake is a natural consequence of internal forces within the Earth and it is possible, based on measurements of surface deformation and the historical record, to make generic predictions about the type and consequences of future earthquakes in specific contexts. Europe is no stranger to damaging earthquakes; Greece and Italy in particular have a long history of earthquakes, but most of the Mediterranean countries, from Portugal to Turkey, have experienced severe earthquakes.Reference Ambraseys 1 , Reference Woessner, Laurentiu, Giardini, Crowley, Cotton, Grünthal, Valensise, Arvidsson, Basili, Demircioglu, Hiemer, Meletti, Musson, Rovida, Sesetyan and Stucchi 2 In this article I focus on two large European cities (Istanbul and Bucharest) that are at particular risk to earthquakes, and the nature of the geological processes that make such events inevitable in these two cases.
Just as we understand the nature of lightning but cannot predict exactly when and where a lightning strike will occur, there is a degree of intrinsic unpredictability with earthquakes that we cannot avoid. The fact that large earthquakes are experienced unpredictably and infrequently on the human time scale has also meant that progress in understanding and adapting to the threat of these events has been slow, and over-shadowed by short term economic priorities. Every earthquake however is associated with movement on a fault, i.e. a roughly planar surface on which movement can occur. Such movements release internal stress that has slowly accumulated under the action of long-term geological movements that typically act on a much larger scale.Reference Dieterich 3
Most active faults have a prior history; indeed an important concept in earthquake studies is the earthquake cycle, the idea that a fault moves repeatedly on a more or less regular cycle as the stress field is continually renewed by some large-scale geological process.Reference Thatcher 4 Unfortunately, this movement is imperceptible for tens, hundreds, or even thousands of years, and then metres of displacement may occur within a minute or two on a fault surface that may extend tens or hundreds of kilometres, producing a sudden and colossal release of stored elastic energy. For large earthquakes, the next event is never an exact copy of a previous event, but there is a strong expectation that there will be future events that are comparable in their surface effects. Therefore, if we can identify the faults that are most at risk of producing earthquakes, and measure or map their properties and the prevailing stress field, there is some hope that we can anticipate what will happen in the next major earthquake, if not precisely when it will happen. Anticipation in this case can extend to construction of detailed models of the seismic waves and the accelerations that urban structures are subjected to as the seismic waves pass by.Reference Graves, Aagaard, Hudnut, Star, Stewart and Jordan 5
Most faults, however, are mostly buried; we see only the surface trace of the fault where it intersects the Earth’s surface. In some cases we don’t even see that, as the fault is entirely buried. We therefore mainly rely on indirect measurements to investigate what is happening on a fault. Seismology as a measurement tool has been around for about a century, but our ability to deploy large numbers of seismographs and to synthesise and interpret the seismic data more effectively has increased dramatically in recent decades.Reference van der Vink 6 , Reference Molinari, Clinton, Kissling, Hetényi, Giardini, Stipčević, Dasović, Herak, Šipka, Wéber, Gráczer and Solarino 7 A network of seismographs measures the elastic waves that are released when an earthquake occurs. We can use these data in two ways: first, we can map the locations and types of micro-earthquakes that are usually associated with an active fault. Such activity occurs especially in the aftermath of a large earthquake, but in general can also occur at any time during the earthquake cycle. Monitoring this activity can provide information about the potential for a large earthquake, although the relationship between large earthquakes and activity that might be considered precursory is uncertain and interpretation can be controversial.Reference Evison 8 – Reference Hall 10
Second, we can use the elastic waves emitted by distant large earthquakes to illuminate the structure of the Earth’s crust and upper mantle in the actively deforming region and thereby construct images of that structure,Reference Rawlinson, Pozgay and Fishwick 11 much as a physician may use imaging methods based on ultrasound or X-rays to identify structures within a human body.
Seismology, however, is insensitive to the slow background movements that occur in the periods between earthquakes. Fortunately, the development of Global Navigation Satellite Systems (GNSS) such as GPS and the new European system called Galileo, have provided an important new way to precisely measure surface earth movements. GPS measurements show the slow relative movements of the Earth’s surface across regions that are thousands of km wide, to an accuracy of the order of 1 or 2 mm/yr.Reference Kreemer, Blewitt and Klein 12 Where these measurements indicate that a region is undeforming, the velocities are entirely consistent with the geological record of how the tectonic plates have moved on time scales of 1 to 100 Myr. In some regions, however, the measurements enable us to see where the Earth’s crust is being stretched, shortened or sheared. Other satellite systems, such as ESA’s Sentinel, have provided a radar interferometry capability that can map with similar precision the displacements of the Earth’s surface associated with earthquakes and slow tectonic movements.Reference Elliott, Walters and Wright 13 These measurements enable an accurate quantitative interpretation of the distribution of displacement that occurs on a fault during an earthquake, even though the fault movement may have occurred tens of kilometres beneath the Earth’s surface.
The geological environments of Istanbul and Bucharest could hardly be more different, but both face a significant risk from damaging earthquakes. Both of these cities have suffered in past events and the relevant authorities are keenly aware of the present and future risk. In both Romania and Turkey, active monitoring programmes are undertaken. These programmes have the aim of getting better measurements of future events, and ultimately of getting a better understanding of what will happen there during the next major earthquake. While there seems little prospect in the near future of being able to accurately predict when the next major earthquake will occur in either of these cities, there have been significant advances in our understanding of why they happen and how the seismic energy will impinge on the urban environment.
Istanbul – Deprem!
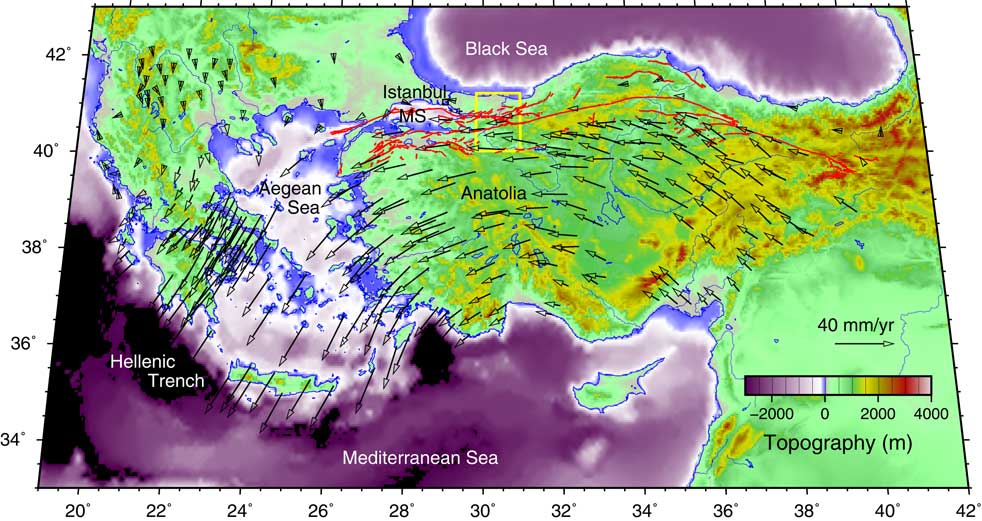
Istanbul is located close to the North Anatolian Fault, a major transform fault system which separates westward-moving Anatolia from the Black Sea, which is embedded in the relatively stable European landmass to the North (Figure 1). The North Anatolian Fault is similar in many ways to the San Andreas Fault system of California, in that both are long (~1000 km) strike-slip (horizontal movement parallel to the fault) fault systems across which relative displacement rates of 25 to 30 mm/yr are measured.Reference Stein, Barka and Dieterich 14 Whereas the record of large earthquakes on the San Andreas Fault has only been revealed by geological investigation of trenches across the fault,Reference Sieh, Stuiver and Brillinger 15 a long history documents the activity on the North Anatolian system, which culminated most recently in the catastrophic 1999 Izmit and Duzce earthquakes just east of the Sea of Marmara.Reference Barka, Akyüz, Altunel, Sunal, Çakir, Dikbas, Yerli, Armijo, Meyer, de Chabalier, Rockwell, Dolan, Hartleb, Dawson, Christofferson, Tucker, Fumal, Langridge, Stenner, Lettis, Bachhuber and Page 16 The general progression of these earthquakes during the 20th century has been westward,Reference Stein, Barka and Dieterich 14 leading to an expectation that the next major earthquake may occur beneath the Marmara Sea, close to Istanbul.Reference Pondard, Armijo, King, Meyer and Flerit 17 Earthquakes have occurred offshore in the northern Sea of Marmara, most notably in 1509, 1754 and 1766, all estimated to have magnitude in the range M6.8 to M7.2 and generally causing severe damage to Istanbul.Reference Barka, Akyüz, Altunel, Sunal, Çakir, Dikbas, Yerli, Armijo, Meyer, de Chabalier, Rockwell, Dolan, Hartleb, Dawson, Christofferson, Tucker, Fumal, Langridge, Stenner, Lettis, Bachhuber and Page 16 , Reference Ambraseys and Jackson 18 Other disastrous events located near the Marmara Sea occurred in 1719 (M7.4) and 1894 (M7.3).
Topographic map of Anatolia and the Aegean Sea. Superimposed are the mapped surface faults associated with the North Anatolian fault system (red) and the long-term geodetic displacement rate vectors (black) measured using GPS at a set of observing points across the region.Reference England, Houseman and Nocquet 21 GPS velocities are shown in a reference frame in which northern Europe is stationary. The light-coloured rectangle shows the location of Figure 2. The centre of Istanbul is shown by a black square and MS is the Marmara Sea. (To view this figure in colour please see the online version of this journal.)

The GPS velocity field in Figure 1 shows that all of Anatolia is moving westward relative to Europe at rates of 20 to 30 mm/yr, with velocities increasing in magnitude and turning southwest in the Aegean region.Reference Nocquet 19 The southward component of motion means that the Marmara Sea is not only being sheared in an east–west direction, but is literally being pulled apart by stretching of the crust in the NE–SW direction. Indeed, this stretching is responsible for the formation of the Marmara Sea basin and a broad region of crustal thinning and long-term subsidence that affects most of western Turkey and the Aegean Sea.Reference Floyd, Billiris, Paradissis, Veis, Avallone, Briole, McClusky, Nocquet, Parsons and England 20 The GPS velocity vectors shown in Figure 1 generally vary smoothly in direction and magnitude unless the measurement sites are close (in time and space) to recent large earthquakes. This smooth variation of surface velocity, although measured over decades, is thought to be representative of the deformation of the lithosphere (that outer, more rigid, layer of crust and upper mantle, ~100 km thick) over periods of millions of years. In fact, the pattern of movement shown in Figure 1 reveals that the lithospheric layer is just flowing like a very viscous fluid away from the region of high topography and greatest gravitational potential energy in Eastern Anatolia to where topography is lowest in the Hellenic trench south of Crete. This continental-scale movement is explained by the gravitational potential energy gradient that generally decreases smoothly from east to south-west in line with the variation of topographic elevation.Reference England, Houseman and Nocquet 21 The conditions at western and eastern ends of the region are sustained by subduction of the African plate lithosphere beneath Europe at the Hellenic trench and the northward movement of the Arabian plate toward the Caucasus.Reference Reilinger, McClusky and Vernant 22 The balance of force that sets the geological environment for Istanbul will not change on any human time scale, so we may expect earthquake activity there to continue at rates comparable to those of the historical record.
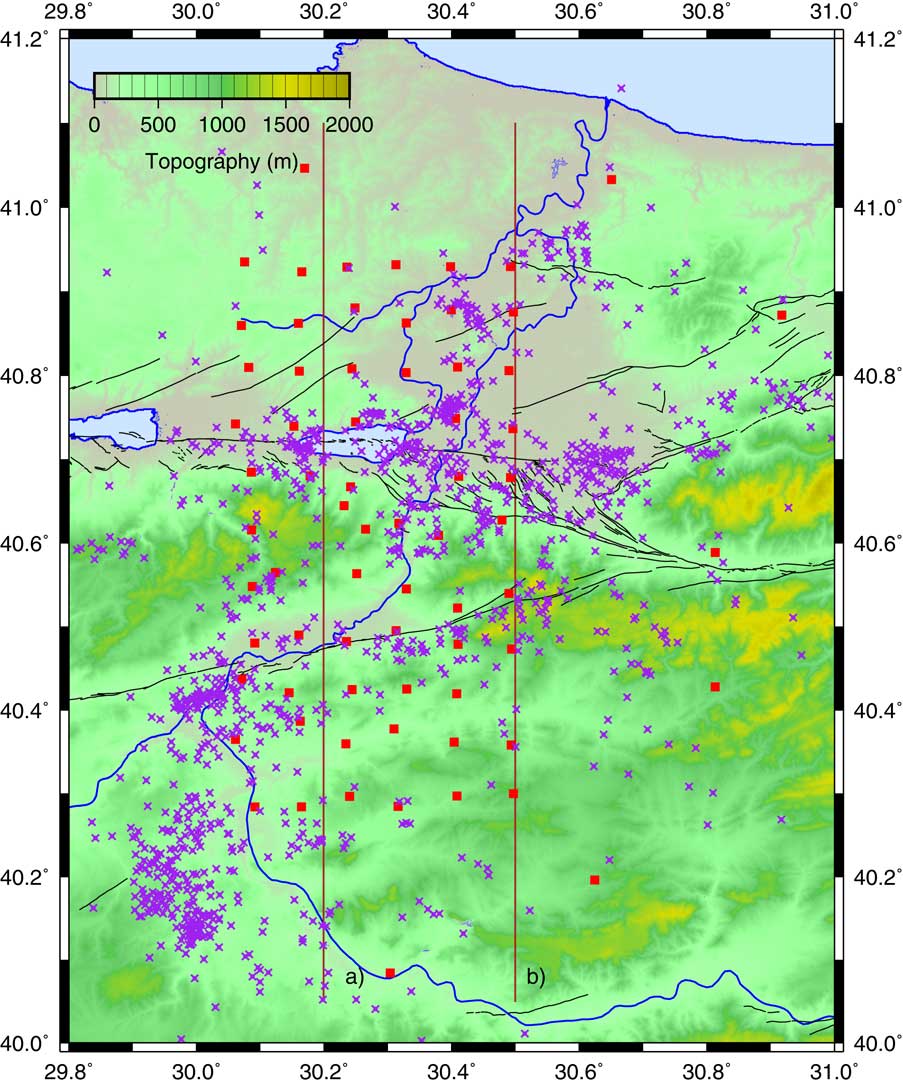
While the lithosphere en masse is flowing like a very viscous fluid, the upper 15 km or so of this layer is basically an elastic solid cut by numerous faults. Stress in the lower layer is dissipated by various creep mechanisms that approximate flow, but elastic energy is stored up in the faulted upper layer while the faults are locked during the inter-seismic period. At some point this elastic energy may be released in the form of an earthquake when the stress acting on one of the faults locally exceeds some threshold.Reference Freed 23 Where strain is applied in a consistent sense for long periods of time, a system of near-surface faults will organise into coherent structures on which the strain is localised.Reference Taylor, Bull, Lamarche and Barnes 24 , Reference Şengör, Tüysüz, İmren, Sakınç, Eyidoğan, Görür, Le Pichon and Rangin 25 Major fault systems such as the North Anatolian Fault thus develop to accommodate significant relative displacements. Even so, these fault systems contain much complexity. The North Anatolian fault system in westernmost Turkey has two major strandsReference Şengör, Tüysüz, İmren, Sakınç, Eyidoğan, Görür, Le Pichon and Rangin 25 which diverge west of a nexus in the Sakarya River floodplain at about 30.6°E (see Figure 2). The northern strand passes through Sakarya and Izmit and into the Marmara Sea, defining the locus of the many damaging earthquakes mentioned already. The southern strand enters the Marmara Sea about 30 km south of Izmit and runs along its southern coast. South of the Marmara Sea many large earthquakes have also occurred on other faults.Reference Eyidoǧan 26
To examine in more detail the structure of the North Anatolian fault system a team from the University of Leeds, the Kandilli Observatory and Earthquake Research Institute (KOERI), and Sakarya University deployed during 2012–2013 a network of temporary seismographs across the North Anatolian Fault system in the region of the 1999 earthquakes.Reference Kahraman, Cornwell, Thompson, Rost, Houseman, Türkelli, Teoman, Altuncu Poyraz, Utkucu and Gülen 27 In this deployment we recorded ground velocity, sampled 50 times per second, continuously for a period of about 16 months, at about 70 locations organised around a grid with a nominal 7 km station separation. Figure 2 shows the locations of DANA (Dense Array for North Anatolia) stations and many small earthquakes identified during the deployment period. If an earthquake is recorded at multiple locations, we can triangulate using the relative arrival times of the seismic waves at the different sites, and a model of the sub-surface seismic velocity, to determine its location. Having such a large number of stations in a relatively small area enabled us to detect and locate accurately many more micro-earthquakes than is possible using only the stations of the permanent national network operated by KOERI. Most of these micro-earthquakes are relatively uniformly distributed in depth between the surface and about 12 km, although some are as deep as 20 km.Reference Altuncu Poyraz, Teoman, Türkelli, Kahraman, Rost, Houseman, Thompson, Cornwell, Mutlu, Cambaz, Utkucu and Gülen 28 Although the uncertainty on location may be as great as 1 km, one obvious conclusion that can be drawn from Figure 2 is that, while some of these micro-earthquakes are associated with one or other of the major fault strands, the recent activity is only partly focused on the fault segment that failed in 1999. In particular, the Sakarya River is associated with significant concentrations of micro-earthquakes, which implies a major structure that cuts obliquely across the main North Anatolian fault zone. The Sakarya River gorge and floodplain generally follow this alignment of seismicity. An active fault in this orientation is secondary to the main fault zone, but a component of extensional displacement on such a fault may be partially responsible for the development of this valley and has likely constrained the location of the river system. It is also clear that sustained movement on the southern strand of the North Anatolian Fault system has caused a significant right-lateral offset of the river to develop.
Map of the study area for the FaultLab project. Red squares denote seismographs of the DANA (Dense Array for North Anatolia) array operated by Leeds University, Kandilli Observatory and Earthquake Research Institute and Sakarya University. Purple crosses denote micro-earthquake epicentres.Reference Altuncu Poyraz, Teoman, Türkelli, Kahraman, Rost, Houseman, Thompson, Cornwell, Mutlu, Cambaz, Utkucu and Gülen 28 Lake Sapanca is located at 40.72°N, 30.25°E; the Sakarya River flows northward to the Black Sea past the eastern end of Lake Sapanca. The lines labelled a) and b) show the locations of the N-S sections in Figure 3; mapped faults are shown in black. (To view this figure in colour please see the online version of this journal.)

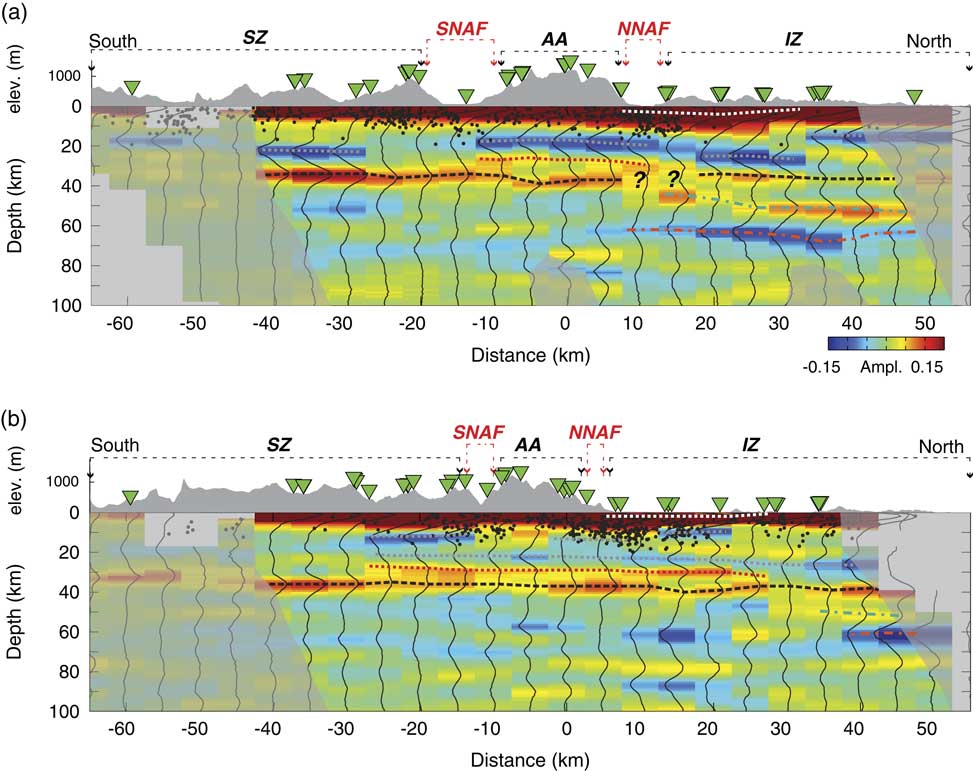
WeReference Kahraman, Cornwell, Thompson, Rost, Houseman, Türkelli, Teoman, Altuncu Poyraz, Utkucu and Gülen 27 also analysed seismic records of distant earthquakes obtained from the same array to construct an image of the crust and upper mantle beneath the array using the receiver-function technique. The principle that underlies this technique depends on the fact that the compressional waves from a distant earthquake interact with a discontinuity in elastic rigidity beneath each receiver to produce secondary shear waves. The secondary waves recorded on the array therefore image this surface, and the arrival time of these waves is directly related to the seismic velocities of the two wave types and the depth of the discontinuity. A major seismic discontinuity occurs at the base of the crust (known as the Moho after discoverer A. Mohorovičić). On crossing the Moho, the compressional wave velocity increases from about 6 km/s to about 8 km/s, but other discontinuities are present both in the crust and mantle. Images developed from the DANA array dataReference Kahraman, Cornwell, Thompson, Rost, Houseman, Türkelli, Teoman, Altuncu Poyraz, Utkucu and Gülen 27 (Figure 3) show two vertical slices perpendicular to the North Anatolian Fault, with the Moho prominent at depths of between 36 and 39 km. Moreover, they show the internal structure, including a low-velocity zone in the overlying crust, which is evidently truncated by both strands of the North Anatolian Fault. Such truncations are interpreted to be due to fault displacement juxtaposing contrasting structures. One interesting result here is that the displacement on the northern strand of the fault appears to penetrate the entire crust, and even the uppermost mantle, even though significant co-seismic displacements of the 1999 earthquake occurred only for depths shallower than about 20 km. The inference is that a sub-vertical zone of localised shear that presumably moves steadily at slow rates is located underneath the seismically active fault in the upper crust, and reaches at least to Moho depths.
Two vertical sections through the crust and upper mantle to depths of 100 km, perpendicular to the North Anatolian Fault zone at 30.2°E and 30.5°E (Ref. Reference Kahraman, Cornwell, Thompson, Rost, Houseman, Türkelli, Teoman, Altuncu Poyraz, Utkucu and Gülen27; refer to Figure 2 for location of sections). The colours represent the wave field arising from seismic waves originated at distant earthquakes and converted by sub-horizontal discontinuities in structure beneath the seismic array. Red denotes an increase in velocity with depth (as occurs at the Moho at about 40 km depth), blue a decrease (as occurs at about 20 km and about 60 km depths). Annotations I-Z, S-Z and A-A refer to geological terrains: Istanbul Zone, Sakarya Zone and Armutlu-Almacik block; SNAF and NNAF refer to the southern and northern strands of the North Anatolian Fault (indicated by black lines in Figure 2). Micro-earthquakes shown in Figure 2 are indicated by black dots projected onto the sections. (To view this figure in colour please see the online version of this journal.)

The interaction of the faulted elastic upper crust with the viscously creeping lower crust in the context of the earthquake cycle presents a difficult mechanical problem, but GPS observations in the immediate aftermath of the 1999 earthquake reveal an aspect of earthquake behaviour that tells us something interesting about the mid-crust in this region. As shown in Figure 1, Anatolia generally moves westward at rates of up to about 24 mm/yr relative to stable Eurasia.Reference McClusky, Balassanian, Barka, Demir and Ergintav 29 For some months after the 1999 earthquake, however, GPS sites within 10 or 20 km of the ruptured fault showed relative velocities across the fault of up to about 150 mm/yr.Reference Ergintav, McClusky, Hearn, Reilinger, Cakmak, Herring, Ozener, Lenk and Tari 30 Apparently, the displacement on the fault plane due to the earthquake caused an abrupt redistribution of stress within the crust, which subsequently relaxed by viscous creep in the mid-crust. Using computer models of how the stress field evolves during the earthquake cycle for a viscoelastic crust, Yamasaki et al.Reference Yamasaki, Wright and Houseman 31 showed that these high post-seismic rates can be explained if there is a low viscosity layer in the mid-crust. Viscosity and seismic velocity are very different physical properties, yet we expect a correlation between low viscosities and low velocities in crustal rocks, as both are influenced in that direction by increasing temperature or increasing pore fluid pressures. Intriguingly, the mid-crustal low-velocity zone in the distance range [–10, 30] km and depth range [20, 25] km of Figure 3(a) (blue in the online colour version) is in about the same location as the low viscosity zone deduced from the viscoelastic modelling of the post-seismic GPS data. Although we cannot directly sample this mid-crustal layer, these constraints on its physical properties may help us provide better models of the crustal stress field as it builds towards the next major event on this fault system.
If the next big earthquake to affect Istanbul is similar to the 1509 event, displacement on an 80 to 100 km long segment of the North Anatolian Fault in the Marmara Sea will cause an event of about magnitude 7, with large areas of Istanbul within ~30 km of the ruptured fault and affected by severe shaking. The time interval between the onset of fault movement and the onset of strong shaking in Istanbul will be less than 10 seconds, affording little or no warning time, even with borehole sensors located offshore close to the fault. A tsunami may follow. Turkish authorities have responded to this threat by establishing an earthquake rapid response and early warning system with the aim of providing a rapid quantitative assessment of the magnitude of any seismic event in the Marmara Sea region.Reference Alcik, Ozelb, Wu, Ozel and Erdik 32 Another government initiative is the Istanbul Seismic Risk Mitigation and Emergency Preparedness Project (ISMEP) which aims to enhance preparedness, strengthen critical infrastructure, and improve institutional and technical capacity for disaster risk management and emergency response. 33 Following the experience of collapsed buildings in the 1999 Izmit earthquake, the retro-fitting or reconstruction of public buildings (schools, hospitals, dormitories, administrative and social service buildings) and the enforcement of building codes to ensure compliance with seismic-resistant design standards have been designated as priorities under ISMEP. A training programme around the retrofitting code was provided to more than 3600 engineers throughout Turkey. A programme of urban renewal has been instituted in some neighbourhoods in an attempt to address the problem identified by a 2002 government audit, which estimated that two thirds of Istanbul’s housing stock for a population of about 14 million was then comprised of buildings that had no building permit or certificate of occupancy, and questionable structural integrity. 34 Recent newspaper reports however suggest that, while proceeding, this programme is not always accepted readily by those people who are required to move.
Bucharest – Cutremur!
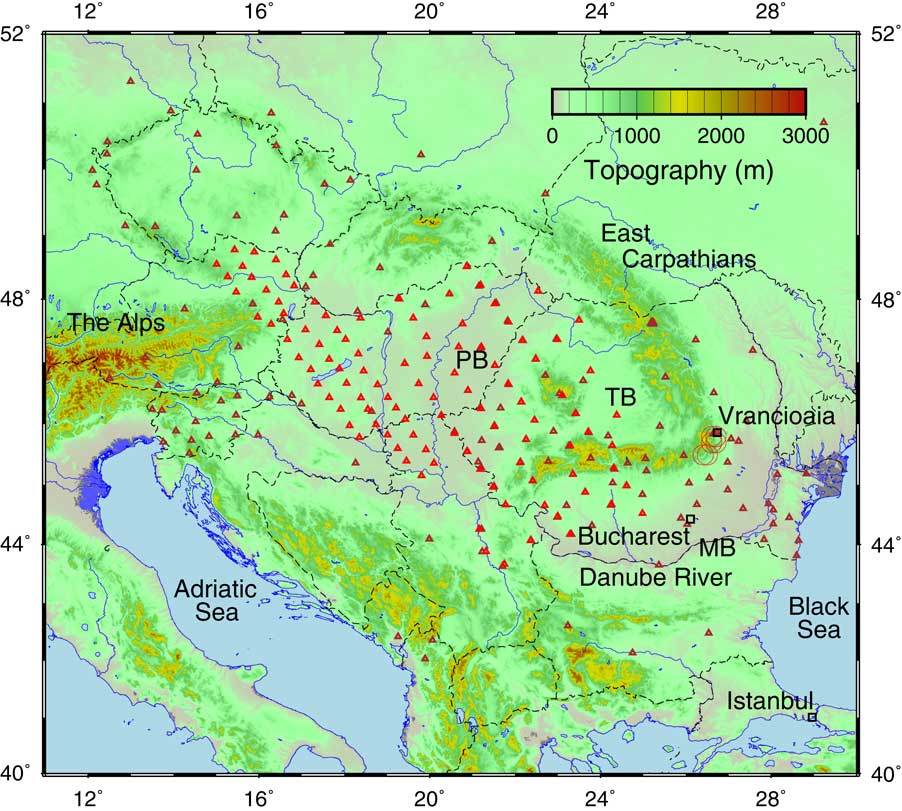
The geological environment of Bucharest makes a total contrast to that of Istanbul. It is located on a relatively stable crustal platform, the Moesian Block, located west of the Black Sea between the South Carpathian and Balkan Mountain ranges, and crossed by the Danube River and its floodplain (Figure 4). This stable platform has a Paleozoic–Mesozoic sedimentary succession that is locally as thick as 10 km and has experienced only minor deformation since the Jurassic period.Reference Tari, Dicea, Faulkerson, Georgiev, Popov, Stefanescu and Weir 35 Near Bucharest, the platform is covered by about 2 km of flat-lying Neogene sediments that have a low seismic velocity.Reference Hauser, Raileanu, Fielitz, Bala, Prodehl, Polonic and Schulze 36 The GPS velocity field in this region shows negligible internal deformation or relative motion between the Moesian block and the rest of Western Europe.Reference Nocquet 19 , Reference Ishchenko 37 The entire region is behaving to a good approximation as a rigid plate, although evidence from structural mapping shows that both Carpathians and Balkans have accommodated significant deformation during Miocene-era activity.Reference Neubauer 38 To the north, the Pannonian Basin was affected by a strong phase of crustal extension that probably finished about 11 Myr ago.Reference Horváth, Bada, Szafián, Tari, Ádám and Cloetingh 39 Minor crustal seismicity in the Moesian platform does occur, but post-Miocene sediments show little deformation.
Topographic map of south-central Europe showing locations of the Pannonian Basin (PB) and the Transylvanian Basin (TB) separated from the Moesian Block (MB) by the South Carpathian Mountains. Red circles near Vrăncioaia show epicentres of nine earthquakes of magnitude >7 which have occurred since 1802. Bucharest is indicated by the black square. Red triangles show locations of temporary seismograph stations installed by the Carpathian Basins Project and the South Carpathian Project teamsReference Ren, Stuart, Houseman, Dando, Ionescu, Hegedus, Radovanovic and Shen 47 in the period 2006 to 2011. Brown triangles show stations belonging to national networks. Major rivers (blue) and national borders (dashed black lines) are also shown. (To view this figure in colour please see the online version of this journal.)

However, the threat to Bucharest from earthquakes is much greater than one would infer from the preceding description. The historical record shows an exceptional level of seismic activity centred in Vrancea county about 200 km north of Bucharest, with nine earthquakes of magnitude M>7 since 1802 (Figure 4; and nearly 50 in the range 6<M<7).Reference Radulian, Mandrescu, Panza, Popescu and Utale 40 These earthquakes threaten numerous towns and cities in Romania and neighbouring Moldova. The impact on Bucharest, a city of about 2.5 million, could be severe even though the epicentres of these earthquakes are ~200 km distant and the focal depth is typically between 100 and 150 km.Reference Böse, Ionescu and Wenzel 41 A magnitude 7.4 event in March 1977 left a toll of 1578 dead and 11,221 injured in Romania, and damage estimated at ~US$2 billion.Reference Böse, Ionescu and Wenzel 41 The seismic activity is marked at the surface by a distinct geographical feature; this is where the East Carpathian mountain range meets the South Carpathians, enclosing the Transylvanian Basin to the northwest in a sharp bend (Figure 4).
Earthquakes at depths >50 km are usually associated only with oceanic subduction zones,Reference Astiz, Lay and Kanamori 42 but unlike oceanic subduction zones there is negligible surface convergence here, and the geological evidence for past subduction beneath the SE Carpathians is equivocal at best.Reference Knapp, Knapp, Raileanu, Matenco, Mocanu and Dinu 43 Several prior seismological investigations have been undertaken to probe the cause of this deep seismicity.Reference Martin and Wenzel F 44 , Reference Koulakov, Zaharia, Enescu, Radulian, Popa, Parolai and Zschau 45 However, in general, the scope of those studies was too limited to provide a clear picture of what was going on in the mantle beneath the south-eastern Carpathians. During 2006–2011, teams from the University of Leeds, the Romanian National Institute of Earth Physics (NIEP), the Eötvös Loránd Geophysical Institute (ELGI) of Hungary, the Technical University of Vienna and the Seismological Survey of Serbia collaborated in a regional seismic study that aimed to produce high resolution seismic images of the upper mantle (to depths of ~700 km) across the entire Pannonian–Carpathian system (Figure 4).
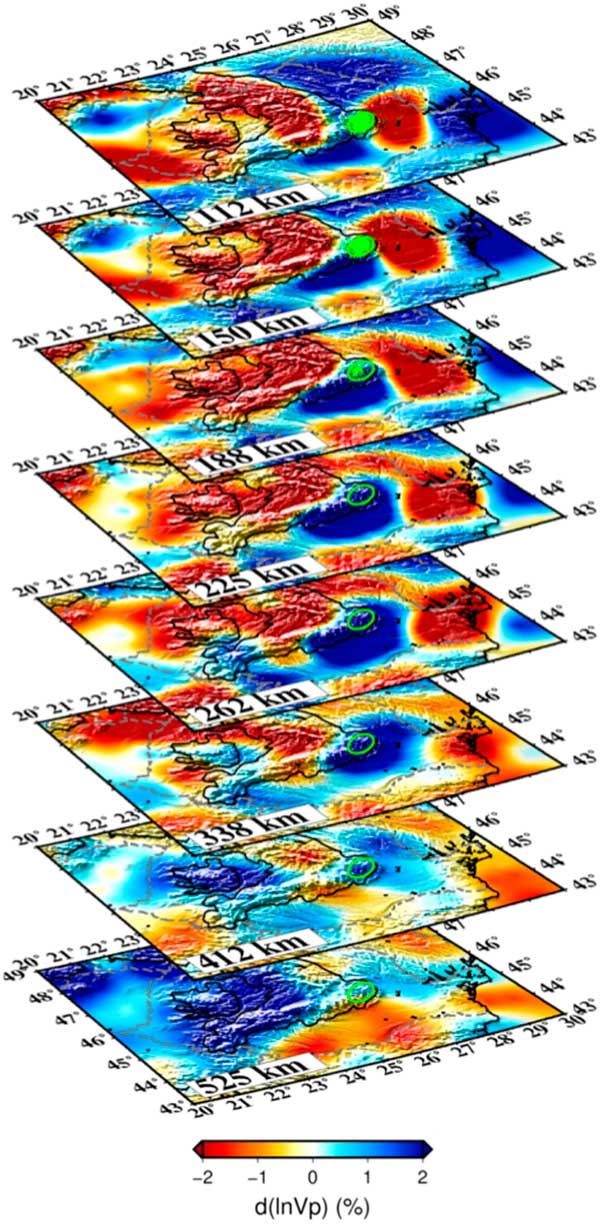
We used the technique of seismic tomography to map in three dimensions the variation of seismic wave velocity in the upper mantle for this region.Reference Dando, Stuart, Houseman, Hegedűs, Brückl and Radovanovic 46 , Reference Ren, Stuart, Houseman, Dando, Ionescu, Hegedus, Radovanovic and Shen 47 The technique is comparable to X-ray tomography as used in the medical context, with some significant differences: X-rays travel in straight lines, whereas seismic waves are strongly refracted by internal velocity variations. Seismic waves have a much greater wavelength (~8 km is representative for signals of ~1 s period), and their ability to resolve detail on shorter length scales is therefore quite limited in this type of tomographic application. The source of seismic waves used in the imaging is provided by distant earthquakes that we have no control over; we simply record everything and hope to record the signals from enough earthquakes in enough different locations that the region under investigation is well illuminated. Fermat’s principle allows us to think about the wave energy travelling along a ray path that is the fastest possible route between earthquake and receiver. Ren et al.Reference Ren, Stuart, Houseman, Dando, Ionescu, Hegedus, Radovanovic and Shen 47 used 1180 earthquakes and 185 seismic stations to obtain a dataset of 85,886 relative arrival times for the same number of ray paths. A mathematical inversion process is then used to infer the variation of seismic velocity within the upper mantle beneath the seismic array that can best explain the arrival times of the seismic waves. The resulting tomographic model of seismic velocity variation is shown (in part) in Figure 5.
Tomographic model of the upper mantle beneath the south-eastern Carpathian Mountains and surrounding regions (after Ref. Reference Ren, Stuart, Houseman, Dando, Ionescu, Hegedus, Radovanovic and Shen47). Horizontal sections are shown in oblique perspective for depths between 525 km and 112 km, as labelled. The colour represents the local deviation (up to about ±2%) from the average seismic velocity at that depth, as shown by the colour bar beneath. Blue implies mantle that is locally slower, colder and denser than average (as seen beneath and to the South and West of the earthquakes). Hypocentres of earthquakes are shown for depths shallower than 200 km and a green ellipse shows the location directly beneath these earthquakes. The approximate outline of the Carpathians is also shown by the 1000 m topographic contour projected onto all sections. (To view this figure in colour please see the online version of this journal.)

In the Earth, seismic velocity generally increases with depth, but we focus on the variations of velocity at any given depth by subtracting the average velocity profile. Velocities may depend on composition but the strongest effects depend on temperature; lower temperatures are associated with faster seismic velocities.Reference Priestley and McKenzie 48 In this case we are considering temperature variations of probably ~200°C relative to background temperatures that increase gradually with depth from about 1350°C at the base of the lithosphere. The velocity model obtained by Ren et al.Reference Ren, Stuart, Houseman, Dando, Ionescu, Hegedus, Radovanovic and Shen 47 effectively covers the upper mantle of the Pannonian-Carpathian region together with some neighbouring regions that include the Eastern Alps and the Bohemian Massif. One of the clearest features in the model is a mass of fast (cold) material between depths of about 400 and 660 km beneath the Pannonian Basin, surrounded by slower (warm) material. Between depths of about 100 and 400 km, the most prominent feature on the map is a relatively localised, high amplitude, fast anomaly beneath the Vrancea region. Figure 5 shows an oblique view of horizontal sections through the velocity model and shows the structure of the Vrancea anomaly relative to the measured locations of past earthquakes. The image shows a huge pendulous structure that extends to about 400 km depth. It is asymmetric at shallow depths but increasingly circular in cross-section at greater depths, with its centre of mass directly beneath the location of the large earthquakes.
Cooler temperatures of a mantle rock are associated not only with faster propagation of seismic waves, but also with increased density, simply due to the phenomenon of thermal contraction that we are all familiar with. Decreasing the temperature of mantle rock by 200°C can produce an increase in density by about 0.7%.Reference Bouhifid, Ardrault, Fiquet and Richet 49 For mantle rocks that density increase amounts to about 25 kg/m3. When one considers the volume of the Vrancea anomaly, the net effect is a huge downward force on the material that comprises the anomaly. Although the upper mantle appears rigid when seismic waves pass through it, it slowly deforms by the accumulation of microscopic creep processes when subjected to sustained stresses. In fact, the upper mantle behaves like a very viscous fluid on time scales of ~1 Myr or greater (as we have seen with the model of Anatolian lithosphere), so this huge mass anomaly beneath Vrancea behaves like a stone placed in honey; it sinks at a rate controlled by the viscosity.Reference Morgan 50 But the stone in this case is really also a very viscous fluid that previously was part of the mantle lithosphere beneath either the Transylvanian Basin or the Moesian block, and it remains connected to its source at the base of the lithosphere beneath the Vrancea region. That connection between the Vrancea anomaly and mantle lithosphere supports to some extent the stresses needed to resist the downward motion of the Vrancea anomaly, but the stresses are evidently great enough to cause large earthquakes in a very focussed volume of the upper mantle.
The nature of the earthquakes in this region supports this interpretation. When any earthquake occurs, the radiated energy pattern is distinctively related to the orientation of the fault plane and the direction of the motion on the fault plane.Reference Pondrelli, Salimbeni, Morelli, Ekström, Postpischl, Vannucci and Boschi 51 This quadrupolar radiation pattern manifests in two opposing quadrants, within which the ray paths transmit a compressional first motion as recorded at a seismic station, and two alternate quadrants where the first motion is dilatational. Thus, any earthquake for which this information is available reveals the approximate direction of the stress field that drives motion by defining the directions of principal compressive (P) and tensile (T) axes.Reference Michael 52 The fault plane contains the third axis and is typically inclined at about 20° to either side of the P axis. Compression and tension in this case are relative to a background stress field that is overwhelmingly compressive due to the weight of overlying material. The Vrancea earthquakes are all characterised by a vertical T axis, the consequence of the mass anomaly pulling downward.Reference Lorinczi and Houseman 53 The orientation of the P axis is variable but often either NW-SE or NE-SW, which suggests that this volume of material is contracting in both horizontal directions as it is stretched in the vertical direction. The magnitude of an earthquake is related to its seismic moment. This is a measure of the mechanical energy that is released when an earthquake occurs, and it enables a direct estimate of the average rate of strain of the volume that contains the active fault. Summing up the seismic moments of those events that have occurred since reliable instrumental records were available, Lorinczi and HousemanReference Lorinczi and Houseman 53 estimated that the seismically active part of the Vrancea anomaly is stretching at an average rate of ~22 mm/yr. That’s to say the mass of the anomaly is moving down into the mantle at that velocity (or faster because some of the deformation is aseismic). This estimate may only be accurate to within a factor of two, but it is one of the few hard measurements we have anywhere of rates of vertical motion in the mantle beneath stable lithosphere.
Other structures comparable to the Vrancea seismic anomaly have been recognised in places where data exist for seismic tomography on this regional scale (e.g. in the western USAReference Jones, Reeg, Zandt, Gilbert, Owens and Stachnik 54 ), but the Vrancea anomaly is unique in terms of its clearly defined structure and high rates of seismic activity. The rarity of this type of seismic activity may be related to the limited period of its activity. Theoretical models imply that, as the drip transits the upper mantle, the thin structure that connects it to the lithosphere of the Moesian block will attenuate at an increasing rate. As its cross-sectional area diminishes, it will warm up, and in time the mass of the drip beneath will sink below 400 km depth and begin to impinge on the base of the upper mantle. All of these factors will act to eventually diminish the rate of seismic activity. We are not sure enough of the time scale to predict whether this evolution will play out over 1 Myr or 10 Myr, but on the human time scale of the next century or two, the total displacement is too small to significantly change the situation. We can therefore expect that the seismic activity in the Vrancea zone will continue at a rate similar to the historical record, and with similarly unpredictable timing of individual earthquakes.
Why the shallow part of the Vrancea anomaly is so lopsided is not known, but is probably related to the geodynamic conditions that promoted the onset of this gravitational instability.Reference Lorinczi and Houseman 53 The asymmetry also offers a clue as to why Bucharest may be so vulnerable to these earthquakes. The fast (cold) material that extends to the south under the Moesian block, almost as far as Bucharest, is directly connected to the earthquake source region and provides a low attenuation path for earthquake wave energy that propagates in that direction. In contrast, waves that propagate to the northwest are more attenuated by slower (warmer) rocks under the Transylvanian Basin.Reference Russo, Mocanu, Radulian, Popa and Bonjer 55 Unfortunately, the combination of a high-velocity low-attenuation lithosphere that connects the platform to the source region, and relatively thick low-velocity sediments on top of the platform is a bad combination for the amplification of the seismic surface waves that reach Bucharest.
Bucharest has one potential advantage over Istanbul due to the ~200 km distance between Bucharest and Vrancea county where the Romanian seismic activity is focused. The National Institute of Earth Physics operate a seismic observatory in Vrâncioaia, ~100 km directly above these earthquakes.Reference Mărmureanu, Ionescu and Cioflan 56 When a significant earthquake happens there, this observatory will register the first seismic signals about 15 s before the first compressional waves reach Bucharest and perhaps 30 s before the strongest shaking from the surface waves occurs in Bucharest. This short lead time is the basis for an early-warning system in which automated notification is sent to users, including emergency response units from 12 counties, a large bridge located in Bucharest, a nuclear sterilisation facility in Măgurele city and to the nuclear power plant at Cernavoda.Reference Mărmureanu, Elia, Martino, Colombelli, Zollo, Cioflan, Toader, Mărmureanu, Craiu and Ionescu 57 Twenty or thirty seconds warning is not long, but it may be enough to shut down heavy machinery, trains and power plants. Bucharest has a great architectural heritage, but numerous of its older buildings have been classified as Class I risks since the 1977 earthquake. Although these buildings are clearly labelled by a large red disk, the commercial and political motivation to undertake the necessary engineering upgrades has too often been lacking. There are fears that the next major earthquake could cause a significant number of these buildings to collapse.Reference Gillet 58
Concluding Remarks
The earth movements at the origin of the large earthquakes that threaten Istanbul and Bucharest are inexorable, though quite explicable in terms of the large-scale geological context. There is, however, no real prospect at this time that we will one day be in a position to accurately predict when the next ‘big one’ will occur on a specific fault system. Why some faults move abruptly, producing large earthquakes at irregular intervals of hundreds or even thousands of years, and others appear capable of sliding smoothly, or in some cases intermittently producing movements that are called ‘slow-slip events’ or ‘slow earthquakes’, is not clear. These latter movements are imperceptible to humans and have only been documented using GPS measurements on specific fault segments since about 1999.Reference Schwartz and Rokosky 59 If the contrast between these behaviours prompts the thought that we could somehow engineer threatening faults to slide smoothly rather than by large earthquakes, bear in mind that the seismic activity on the North Anatolian Fault extends at least to 20 km depth and the faults that cause large earthquakes beneath Vrancea in Romania are typically >100 km deep. Fluids pumped into fault systems have been known to activate shallow fault systems and cause earthquakes, but even if the injection of fluids to depths greater than a few kilometres were feasible, who would risk triggering a large earthquake in this way?Reference Keranen, Savage, Abers and Cochran 60 In general, cities must adapt to the behaviour of faults, not vice versa.
Better understanding of the specific earthquake threat to both Istanbul and Bucharest is an important research objective, and there have certainly been major advances in our understanding of the threat that each of them faces. In particular, our understanding of why these earthquakes occur and our ability to calculate the radiation of seismic energy caused by an anticipated earthquake has been greatly improved in recent decades. It is certainly feasible to model in detail the shaking that different parts of these cities will experience in their next big earthquake and, in principle, the impact that the shaking will have on their buildings and infrastructure.
In general of course, most earthquake casualties are caused by buildings that collapse or sustain significant damage, so the clear priority in earthquake preparedness is to ensure the structural integrity of buildings and infrastructure. The example of Tokyo shows, however, that large cities can be defended against damaging earthquakes if the risk is accurately assessed and building standards are well designed and adhered to. In general, major structures that have been built in recent decades in both Bucharest and Istanbul have been built to withstand large earthquakes, but both cities of course also have significant numbers of buildings that predate the adoption of regulations designed to ensure their structural integrity. The accurate identification of such buildings is of course only part of the solution. Even if specific neighbourhoods or buildings are assessed as ‘at risk’ it can be difficult to allocate the funds needed to fix the problem, and both Istanbul and Bucharest face significant challenges in doing so.
Acknowledgements
The research projects described here have been supported primarily by the UK Natural Environment Research Council via separate grants focused on Carpathian and North Anatolian systems, and via the COMET consortium. SEIS-UK provided on loan most of the equipment used in the seismic arrays. I thank my co-investigators (see author lists of Refs Reference Kahraman, Cornwell, Thompson, Rost, Houseman, Türkelli, Teoman, Altuncu Poyraz, Utkucu and Gülen27, Reference Dando, Stuart, Houseman, Hegedűs, Brückl and Radovanovic46 and Reference Ren, Stuart, Houseman, Dando, Ionescu, Hegedus, Radovanovic and Shen47), and the many others who supported the fieldwork elements of these projects, including numerous rural and civic officials, and landowners who hosted seismographs in Austria, Hungary, Romania, Serbia and Turkey.
Greg Houseman is Professor of Geophysics in the School of Earth and Environment at the University of Leeds since 2001. Since 2017 he is also part time at the University of Sydney. His research focuses on the processes that have shaped the outer part of the solid Earth through geological time, specifically mantle convection, plate tectonics and the lithospheric deformation processes that result in mountains and basins. He has developed continuum dynamical codes to simulate earth deformation processes measured using seismic and geodetic data and has undertaken regional seismic tomography investigations of the Earth's crust and upper mantle in Central and Eastern Europe, Turkey and SE Australia. Greg is a Member of the Academia Europaea, a Fellow of the American Geophysical Union and in 2015 was awarded the Augustus Love Medal of the European Geosciences Union.